Phase spirals in cosmological simulations of Milky Way size galaxies.

Begoña García-conde 1 , Santi Roca-Fàbrega 3,1 , Teresa Antoja 2

  • 1 Universidad Complutense de Madrid, Madrid
  • 2 Lund Observatory, Division of Astrophysics, Department of Physics, Lund University, Lund
  • 3 Institut de Ciènces del Cosmos, Universitat de Barcelona, Barcelona

Abstract

The Gaia DR2 revealed several substructures in the phase space of the Milky Way's disk, such as the phase spirals in the Z-Vz plane, whose origin is still under study. Further studies have confirmed that the phase spiral can be a consequence of the Sagittarius dwarf galaxy tidal interaction. In our work we detect phase spirals in the vertical projection Z − Vz of the disc’s stellar particles for the first time in zoom-in cosmological simulations that include hydrodynamics, and star formation. 
The detection and characterization of the phase spirals has been carried out with a Fourier decomposition-based technique. Our algorithm allows us to automatically analyze a large number of snapshots and locations in the simulated galactic disk. Our results indicate that these spiral-like structures in the phase space are present in a wide range of times and locations across the disk, and that they become more evident in times close to the satellite pericenters. For the first time, and thanks to the physics included in our model we are able to confirm with simulations that, as seen in the data, the phase spirals are better observed in the range of younger-intermediate star populations in cosmological simulations. Also, although the satellites of this system are lighter (10⁸ M☉) than the minimum mass estimated to trigger this response (1010 M☉), their effect is evident on the kinematics of the stellar disk. 
We state that there might be other mechanisms at play which appear naturally in our model such as the physics of gas, the collective effect of multiple perturbers, and a dynamically cold population that is continuously renovated by the star formation that helps satellites to trigger the observed disk response.
We expect that new observations combined with our intensive study of the origin of the phase spirals in fully self-consistent cosmological simulations will provide new insights into the nature/origin of the phase spiral.

Introduction

• Gaia Data Release 2 (2018): the Milky Way's disk is perturbed, and presents phase spirals in the Z - 𝑉Z plane (Antoja et al. 2018) of the solar neighborhood.​
• The phase spirals are present in the Z - 𝑉Z plane of a local region of the galactic disk and are the consequence of a phase mixing process triggered by external or internal perturbation which causes vertical and radial oscillations. ​
• Spiral shape that winds up over time: Also can be seen when coloured by 𝑉ϕ and 𝑉𝑅.

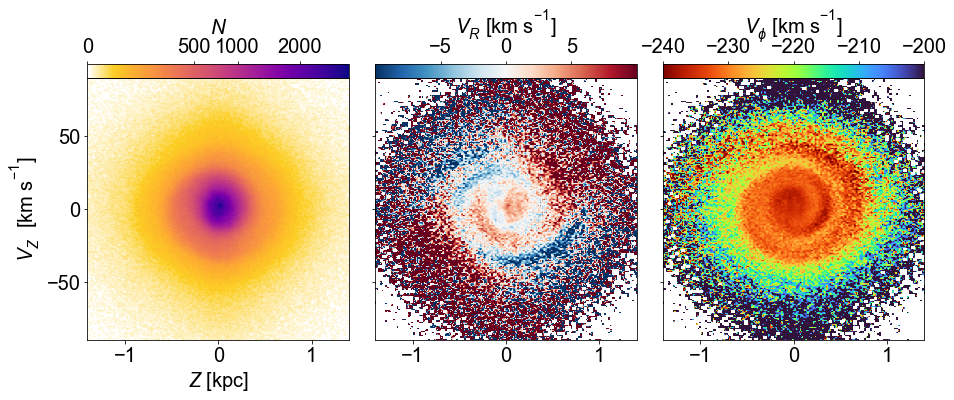
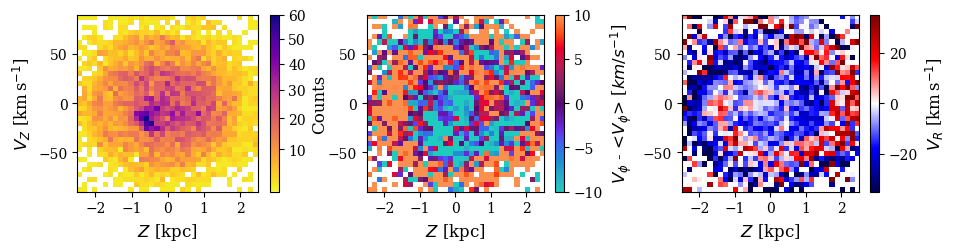
Figure 1: Local phase spiral as seen by Gaia DR3. Two-dimensional histogram of the vertical projection of phase space (Z–VZ) Middle: Same projection but color-coded by median radial velocity VR. Right: Same projection but color-coded by median azimuthal velocity Vφ.

An interacting satellite can induce an energy kick and trigger phase mixing event.

This spiral pattern is compatible with the last pericenter of the Sagittarius Dwarf Galaxy estimated at 500 Myr ago.

Since Gaia DR2, the phase spirals as consequence of Sagittarius have been studied in isolated models (N-body).

The GARROTXA Simulation

We use a MW-size GARROTXA model (a hydrodynamical zoom-in cosmological simulation).

• Spatial resolution of 100 pc.​
• Minimum mass of 103 𝑀 for star particles and 105 𝑀 for dark matter particles.​
• Minimum timestep 103 years.​
• Mass assembling history similar to Milky Way.​

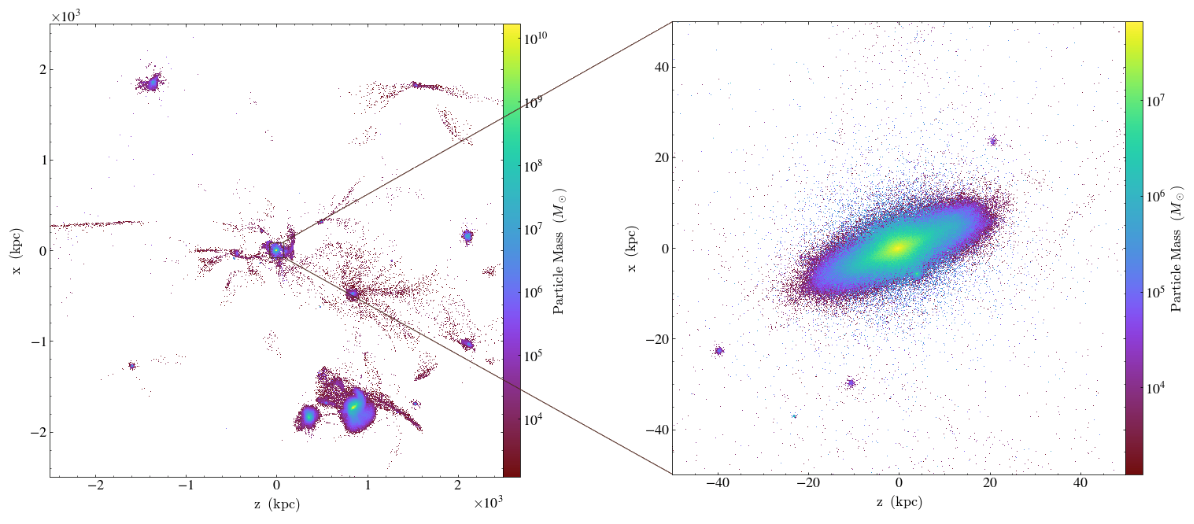
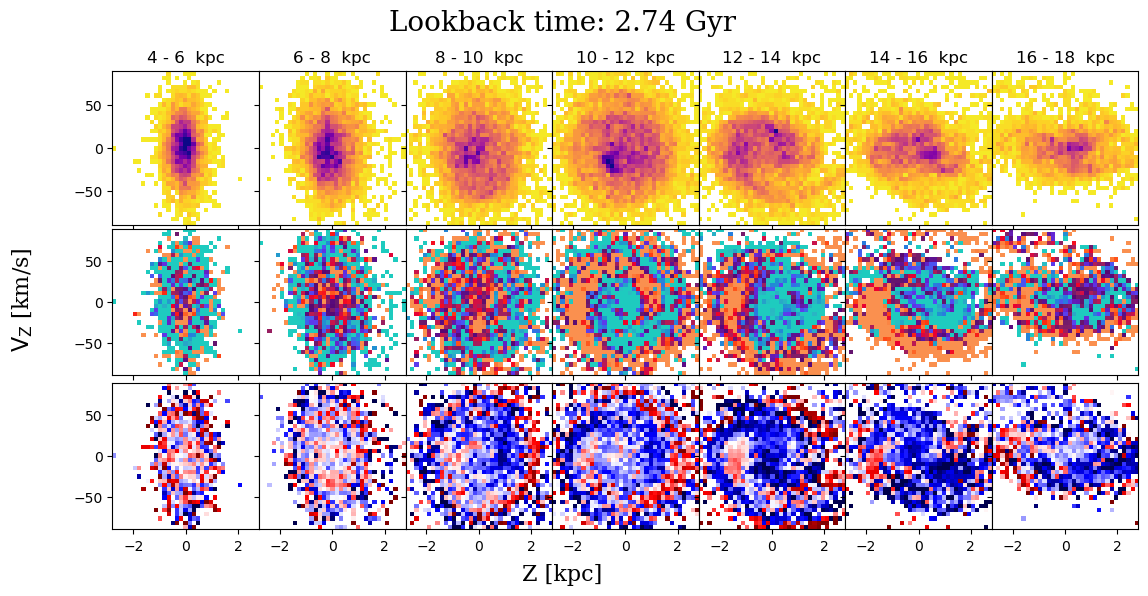
Figure 2: GARROTXA's MW sized model G.322.

Stellar particles with ages between 0 and 5 Gyr.
Galactocentric radii from 10 to 12 kpc and vertical position |𝑍 | < 2.5 kpc.
12 adjacent sectors spanning 30 deg in 𝜙
Temporal evolution from lookback time of 6 to 0 Gyr.
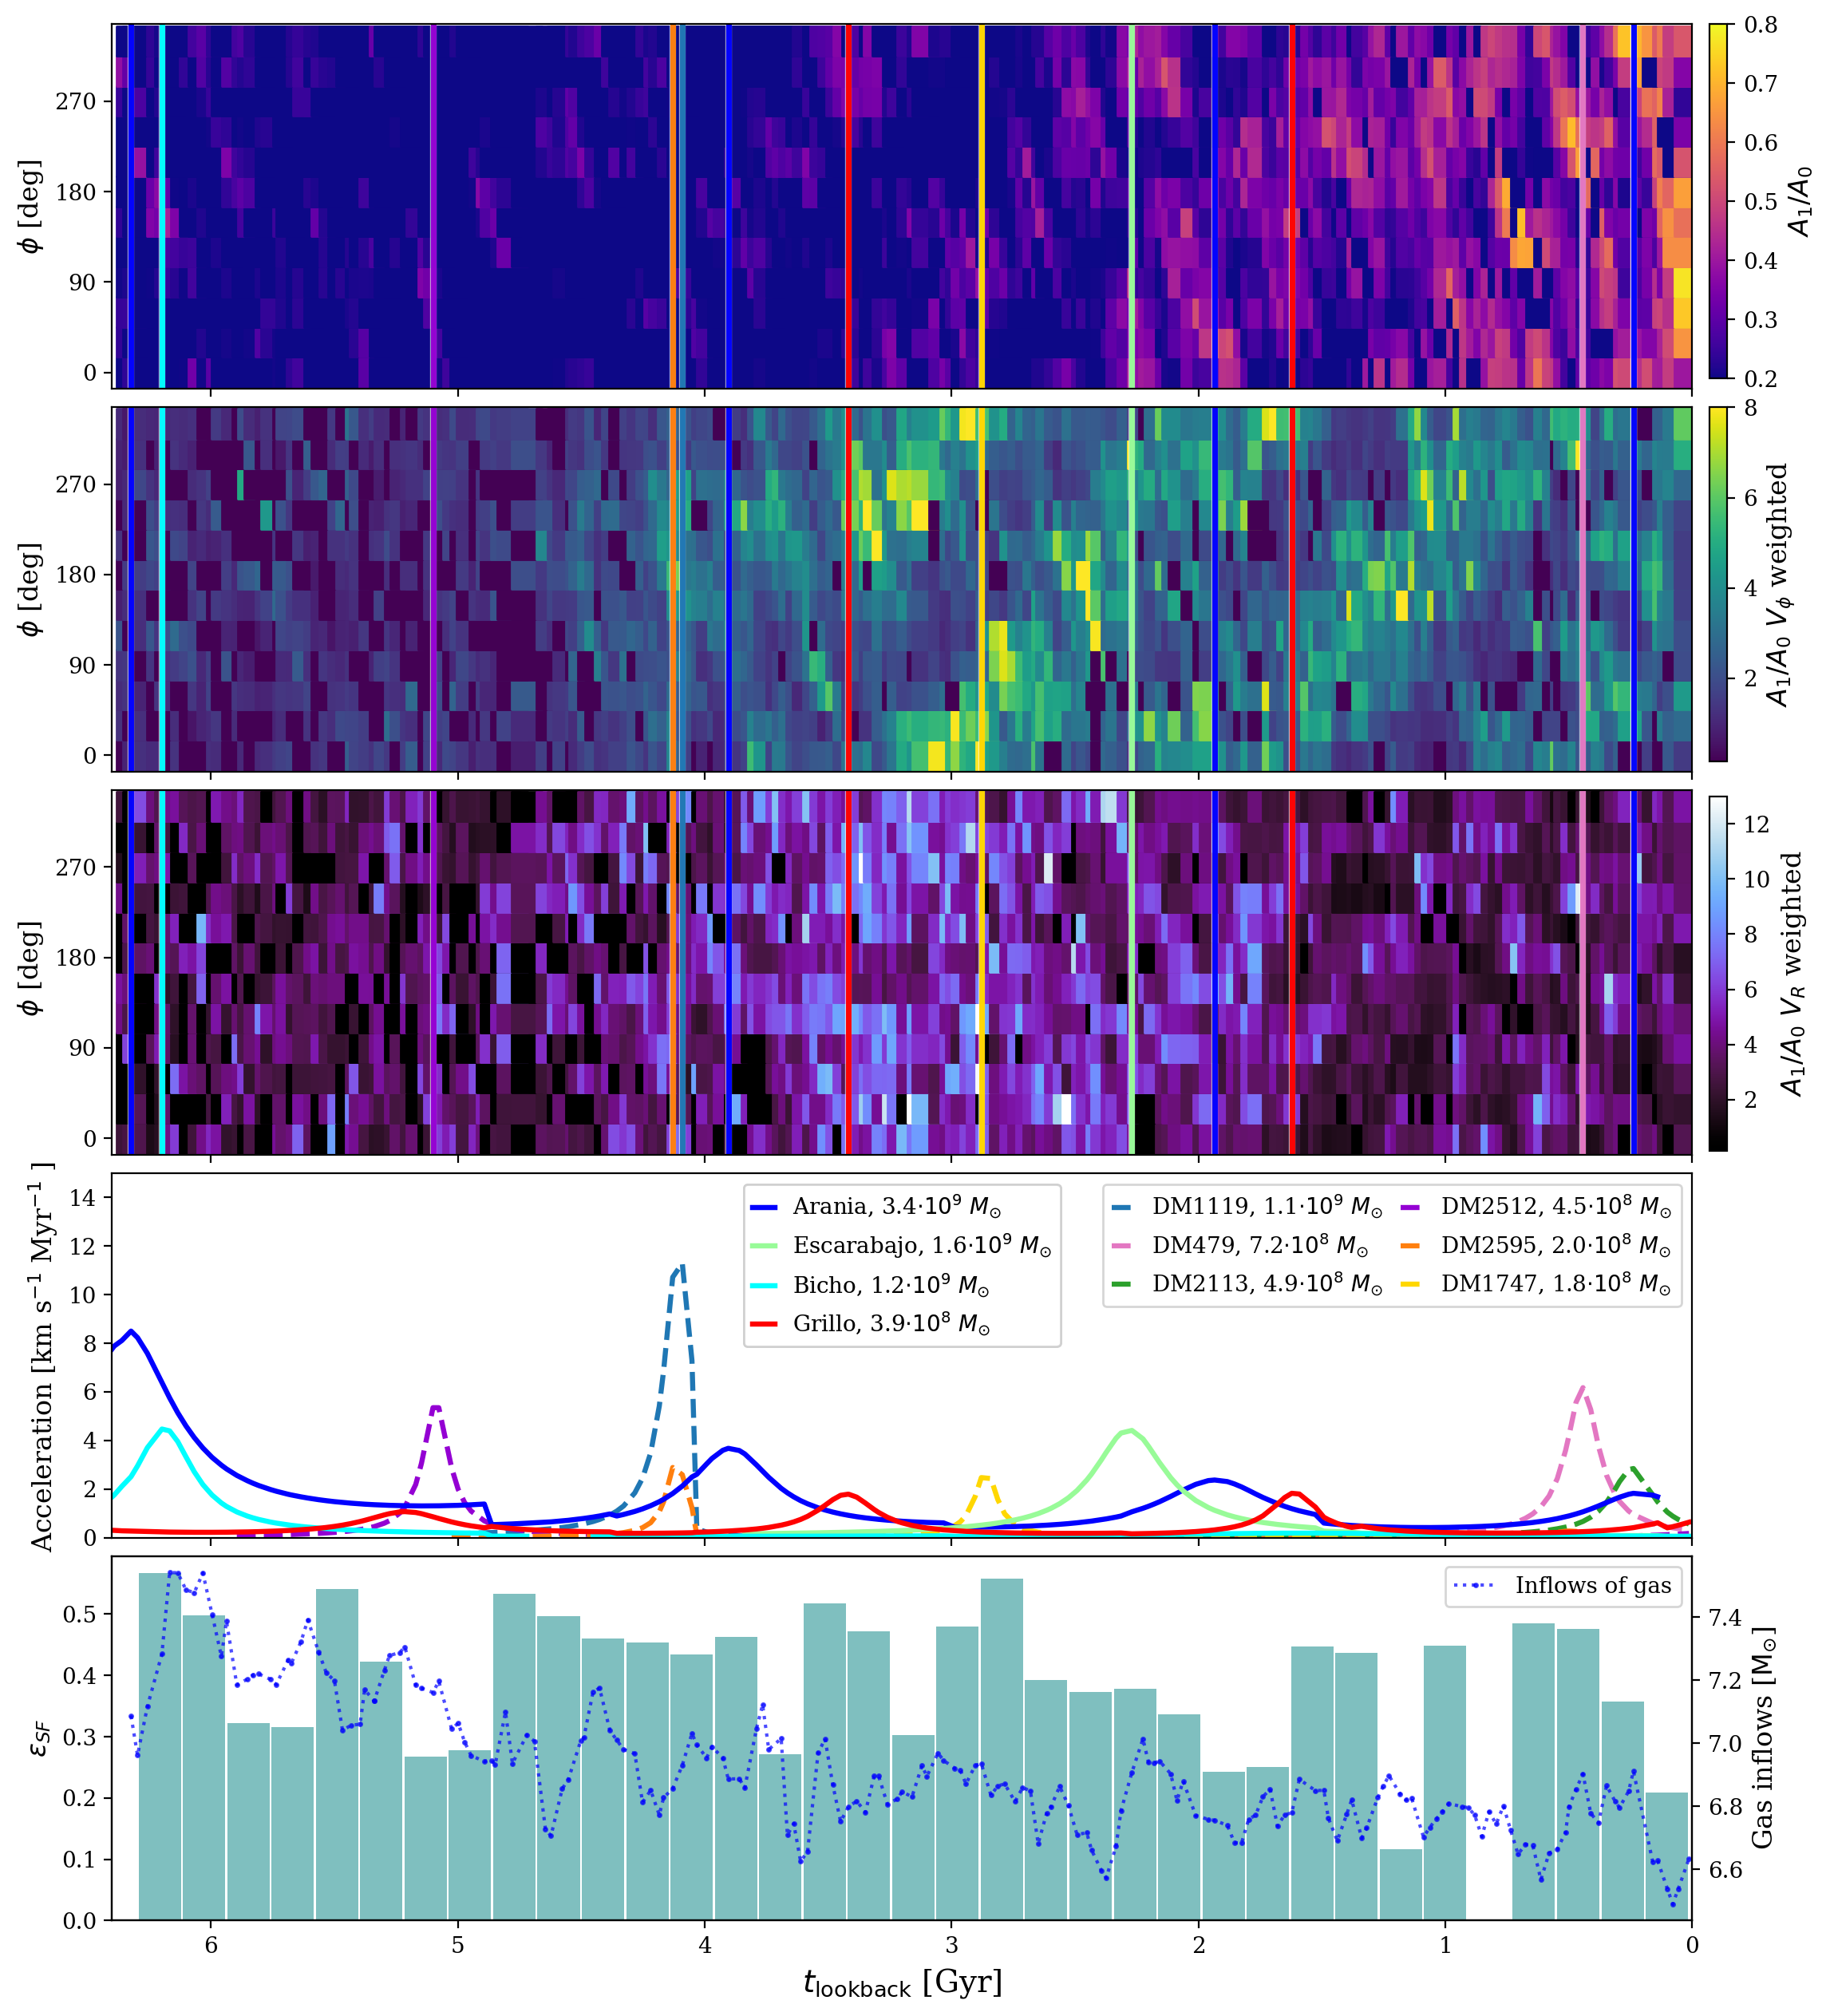
Satellites

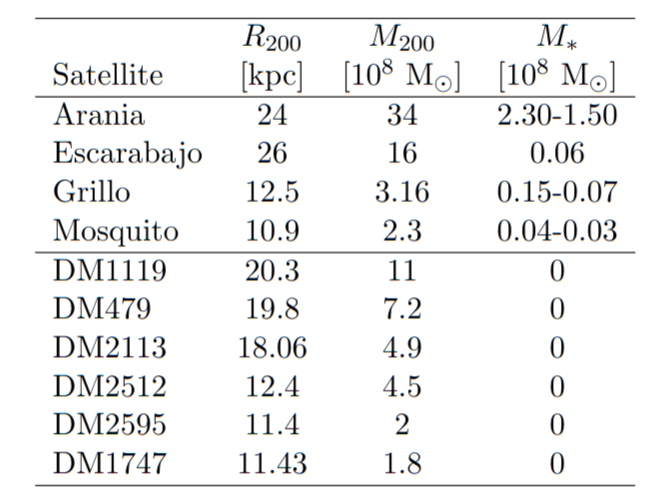
Table1: Properties of the largest satellite galaxies and dark satellites in the simulation as computed by Rockstar halo finder. From left to the right: R200 , M200 and stellar mass  contained in 20% of the R200 .

We use Rockstar halo finder  to identify all sub-halos that may impact the disk’s kinematics.

In Table 1 we summarize the characteristics of those which are more massive and reach lower distance to the main galaxy over the timespan studied.

Phase spirals in GARROTXA simulation

Figure 3: Phase space spirals ( Z − VZ ) observed in the 0–5 Gyr stellar particles’ age population of the GARROTXA simulation at 2.74 Gyr in lookback time. From left to right: a 2D histogram with no weighting, Vφ weighted, and VR weighted.

  • The formation of the stellar thin disk in our model is enhanced at 9 Gyr by  several pericenters,  and it remains almost permanently disturbed by the many following interactions with the satellites.
  • We can see that the phase spiral becomes more perceptible around the 4 Gyr (complete figure in García-Conde et al 2022.)

Figure 4: Vertical phase space distributions of stellar particles with age of 0–5 Gyr at seven different radial bins and at a fixed azimuthal direction.

  • In Fig. 3 we explore the vertical phase space structures as a function of radius for a single azimuth. We see that the global distribution changes from elongated in VZ axis at small radii to elongated in 𝑍 in the outer disc.
  • This has been detected in the Gaia data (Laporte et al. 2019, Antoja et al. 2023) and is a consequence of the smaller restoring vertical force in the outer parts of the disc.
  • The phase spiral becomes detectable at radii larger than 6 kpc and is present up to very large radius, showing that they are not exclusive of the range of 10-12 kpc.
  • The short vertical extent of the distribution at inner radii, combined with the limitations in resolution, may be hampering our ability to see clear structure there.

Figure 5: Vertical phase space of seven age populations within a region with fixed azimuth (240 ) and distance to the galactic center (10-12 kpc), at lookback time of 2.2 Gyr. From top to bottom we show: density of stars; 𝑉 𝜙 − < 𝑉 𝜙 > weighted; 𝑉𝑅 weighted. Additionally, the first column shows the cold gas and the newborn stellar particles as black dots.

  • We show in Fig. 4 seven stellar populations with increasing age, starting with the cold gas (< 8000 K) and newborn stellar particles.
  • We see that the global phase spiral is more pronounced in stellar particles with ages of about 1−5 Gyr confirming the age analysis in Tian et al. (2018) and Bland-Hawthorn et al. (2019).
  • Although there are some hints of structure in the older groups, it definitively fades out for particles older than 5 Gyr.
  • This is due to younger stars being dynamically colder, thus reflecting more prominently the effects of perturbing phenomena. Also, as described in Li & Shen (2020), groups of older stars whose orbits are kinematically hot have a larger range of vertical frequencies, which may blur the phase spiral.
  • We note here that the spiral pattern observed in the 𝑉𝜙 -weighted maps (central row) differs from one age population to another (e.g. the 2 − 3 Gyr group vs. the 3 − 4 Gyr one). This result suggests that different stellar populations may have been perturbed and/or phase mixed differently.
  • Finally, we see that the very young stellar particles (less than 1 Gyr) are found in groups that do not fully cover the phase space but present some sort of spiralility.
  • The cold gas appears to be distributed in non-isotropic phase space patterns and the newborn stellar particles (black dots) are not born close to 𝑍 ∼ 0 and 𝑉𝑍 ∼ 0. This will lead to subsequent phase mixing of the young populations which could create the thin spirals in the vertical phase space projection.

Satellites and star formation

Figure 6: Amplitude of the phase spiral with time and relation with satellite orbits and star formation. First three panels: m=1 Fourier amplitude in the Z-𝑉𝑍 space,  computed for the density, 𝑉𝜙 -weighted, and 𝑉𝑅 - weighted, respectively. Fourth panel: acceleration onto the disc by the main satellites with darker colours indicating a lower vertical distance above/below the disc plane. Bottom panel: star formation efficiency (histogram) and gas inflow histories (blue dots and line). Coloured vertical lines indicate the times of pericentres.

The Fourier estimator

  • In this work we detect phase spirals at multiple times and locations, but it is not trivial to distinguish the moment of their appearance.
  • A phase spiral will present a high amplitude of the m=1 mode in the 𝑍-𝑉𝑍 space (or m=2 mode if two-armed).
  • We also take into account angle variation (to ensure a spiral shape) and m=1 dominating over higher mdoes (more details in García-Conde et al 2022).
  • We observe a coincidence between the phase spirals and pericenters.
  • The maximum strength of the gravitational pull of our satellites remains rather constant with time, in contrast with an interaction with a Sagittarius-like system, where every new pericentre induces a larger kick in velocity than the previous one, making it easier to “overwrite” the existing phase-space substructure.
  • We have multiple pericenters (of different satellites) that appear naturally in our simulation. This, combined with the fact that in our model dynamically cold stars are being formed all along the evolution of the galaxy, results in different stellar populations responding differently to the new perturbations, which is something not captured by isolated models without star formation and gas.

Future work

  • Other possible perturbative mechanisms: highly anisotropic distribution of dark matter left over from the satellites, multiple dark subhalos, misalignment between disc and halo, resonances, and the presence of non-axisymetric structures in the disc.
  • These mechanisms are currently under study with this simulation (García-Conde et al in prep).
  • The combination of the acceleration of the different components of the simulation are of special interest to understand this behaviour of the disk.
  • The possibility of connecting local dynamical phenomena with global perturbations from satellites, gas behaviour and star formation processes in the same model in the context of a cosmological simulation is definitively a promising future avenue of work that we open in García-Conde et al 2022.
  • We will study these velocity substructures in other cosmological simulations with Milky Way -like models and with different codes (RAMSES).

Conclusion and discussion

  • We can still not claim a perfect match between the phase spirals observed in the Gaia data and the ones found in our model.
  • These spirals are present throughout the last several Gyr of the evolution, suggesting that this phenomenon might be common in the life of certain galaxies.
  • The spirals are more notable for younger to intermediate-age stars and are especially prominent near pericenter passages of the three main galaxy satellites.
  • These passages coincide with the times of star formation enhancements, an effect that has already been directly related to accretion events.
  • Recent studies modeling Sagittarius as the main perturber estimate its mass as ≳ 1010 M at the time of impact, more especifically,  6 · 1010 and 2 · 1010 M in Laporte et al. (2019) and Bland-Hawthorn & Tepper-García (2021) , respectively.
  • Our satellites seem to belong to the low mass regime, and the pericenter distance of our heaviest satellites is larger than the ones of recent Sagittarius pericenters (the effects of our perturbers should be far less strong), yet we do observe phase spirals and a correlation between pericenters and the strength of the phase spirals.
  • This can be attributed to other collective effects (García-Conde et al in prep),  such as the dark matter structures or gas misalignment can also play an important role in the vertical behavior of the galaxy.
  • Our model pericenters get synchronized over time, and there is a combined mass of up to ∼ 109 𝑀 by the time they start affecting the disc.

References

Antoja T., et al., 2018, Nature, 561, 360.

Antoja, T., et al., 2023, A&A, 673, A115.

Bland-Hawthorn J., et al., 2019, MNRAS, 486, 1167

Bland-Hawthorn, J., & Tepper-García, T., 2021, MNRAS 504, 3168.

García-Conde, B., et al., 2022, MNRAS, 510(1), 154-160.

Laporte C. F. P., Minchev I., Johnston K. V., Gómez F. A., 2019, MNRAS, 485, 3134.

Roca-Fàbrega et al 2016, ApJ, 824(2), 94.

Tian H.-J., Liu C., Wu Y., Xiang M.-S., Zhang Y., 2018, ApJ, 865, L19