Galaxy detection: Prospect for unveiling SKA precursor data with deep learning

Adrien Anthore 1 , David Cornu 1

  • 1 LERMA, Observatoire de Paris, PSL research Université, CNRS, Sorbonne Université, Paris

Abstract

Current interferometers are known to generate large and highly dimensional datasets, which presents significant challenges for traditional analysis methods.
In this context, the MINERVA team developed a new specialized Deep Learning source detection and characterization method, YOLO-CIANNA, which was successfully applied to synthetic datasets from the first two SKA Science Data Challenge (SDC) editions composed of 2D continuum images and 3D HI emission cubes. This method allowed the MINERVA team to reach first place in the SDC2, and it can also produce a score on the SDC1 dataset that outperforms the best original participating team by +139%. The team is now working on applying this methodology to real observational data from SKA precursors such as ASKAP, MeerKAT, and LoFAR.

We have already successfully applied the detector trained only on synthetic data to observed data products from several instruments, which produced good results in the general case. However, it is prone to false detections in the presence of some instrumental artifacts absent from the simulated data the detector was trained on. Although these false detections can be partly reduced through post-processing, the result remains unsatisfactory, especially considering that these artifacts can be easily identified by the eye. For our detector to learn these specific patterns, we need to complete its training with a labeled dataset derived from the observed data.

I will present the preliminary results of the work we are carrying on building a high-confidence source catalog on a subset of LoTSS fields to be used as a complementary training dataset.
I will start by presenting how we built a detection catalog using the alternative AstroDendro classical detection method and how we deal with the resulting false detections caused by instrumental artifacts, I will discuss how our classic identification method compares to the reference catalog obtained by PyBDSF. I will then present how we improve the completeness of our catalogs with optical and infrared counterparts. Finally, I will describe the results of this approach on the LoTSS data, and discuss the overall pipeline progression.

Introduction

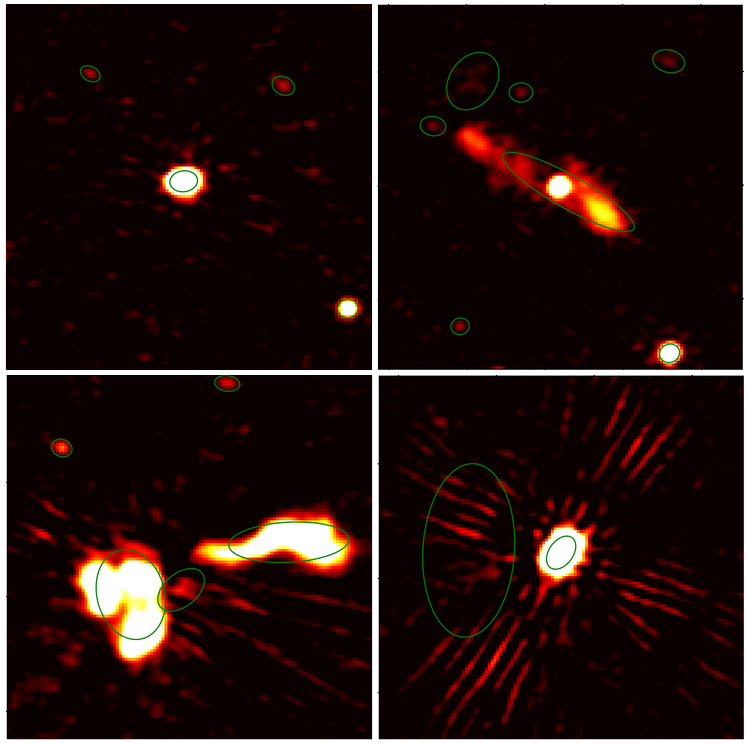
3.2' sided close-up on classical detections in LOFAR 144 MHz continuum data. The detections from Shimwell+ 2022 [2] are the green ellipses. The figure shows in the top left frame the simple case with few point sources and no strong artifacts; in the top right frame an ANG with jets; in the bottom left a blended emission; and in the bottom right frame small sources with bright artifacts around. The pixel values are normalized surface brightness with an arbitrary unit.

Today's radio interferometers produce complex and large data, reaching the PB scale. Classical methods commonly used for source detection and characterization struggle with such data due to specific morphologies or artifacts, leading to false detections, and have poor scaling with data size and dimensionality.

Classical methods will be even more challenged by the forthcoming Square Kilometre Array (SKA), which is expected to generate 700 PB of archived data per year and a raw output of about 1 TB per second.

To develop new analysis methods, the community can rely on data from SKA precursors (MeerKAT, ASKAP, MWA, HERA) and pathfinders (LOFAR, NenuFAR, VLA, ...), as well as the Science Data Challenges (SDCs) from the SKA Observatory (SKAO). This provides a robust framework to prepare for SKA data analysis.

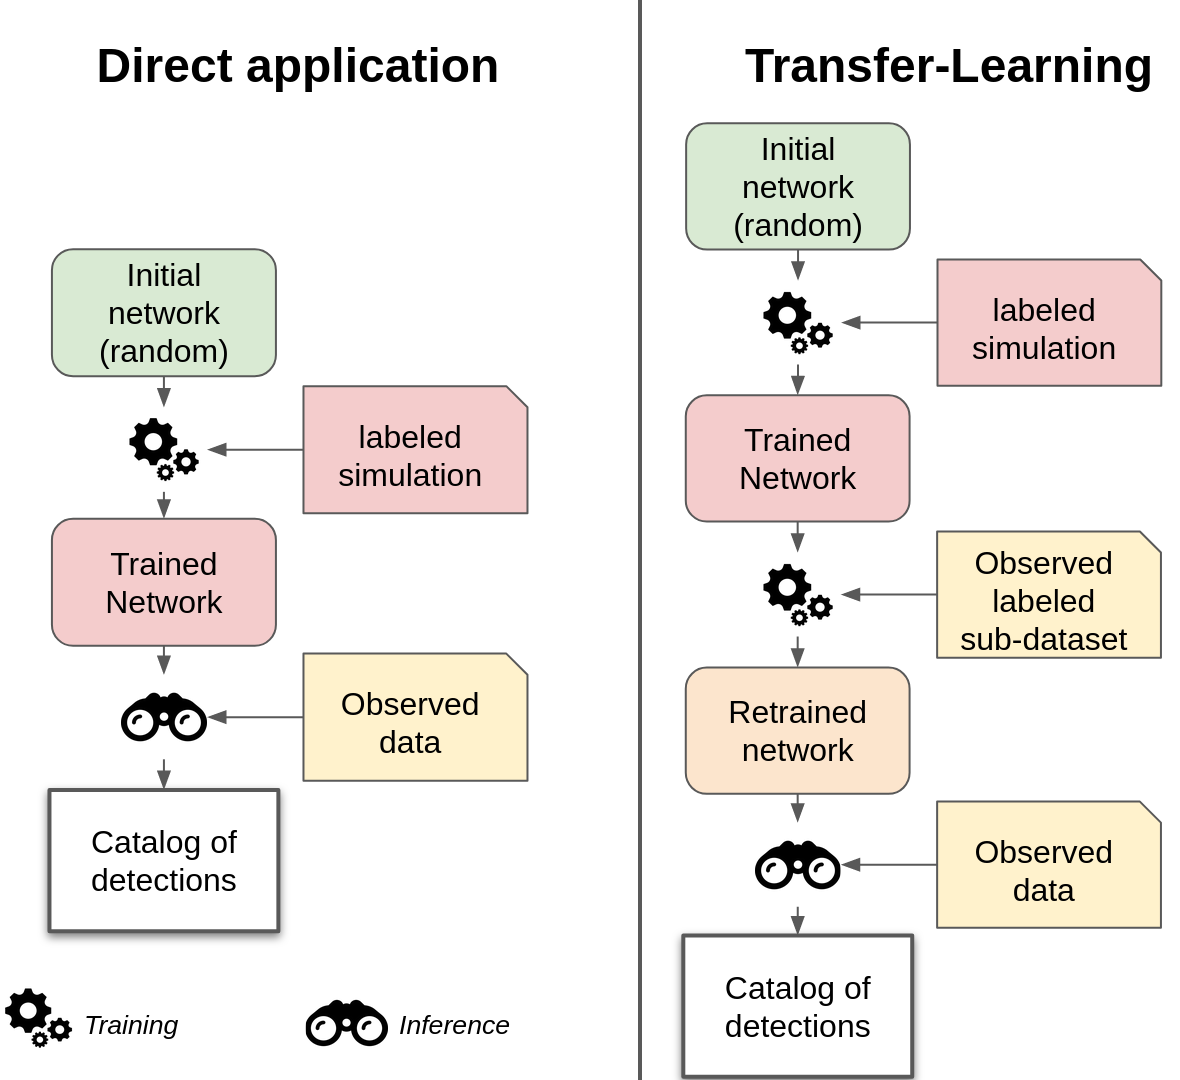
The MINERVA team (MachINe lEarning for Radioastronomy at the Observatoire de Paris) developed a supervised deep learning method, YOLO-CIANNA, in the context of the SKAO SDCs. With this method, the team reached the first place in SDC2 and the highest score a posteriori on SDC1 data (Cornu+ 2024 [1]). This method shows state-of-the-art performance on simulated data, and we aim to apply it to observational data from SKA precursors and pathfinders.

Application to observations

Our method is supervised, meaning it needs to be trained on labeled examples. Due to the model's complexity, it requires a large number of examples. If we use only observational data to train the network, we would need to label a large area of the survey to have enough examples. However, if the area is too large compared to the size of the survey, the machine learning detection will then be pointless as it will try to find the same sources as the one labelled in the training sample.
The other option is to use simulated data, which has the advantage of being able to generate as many examples as necessary and to compensate for scarcity effects in the data . However, these data are biased by the physical and instrumental model.

In practice, observed and simulated data can be combined to train the network. We are left with two approaches for the inference of observational data:

    • Direct application: network trained on available simulated data;
    • Transfer-Learning: network trained on available simulated data and then on observational data.

On the one hand, the direct application requires that the inference data match the training data, in our case the SDC data. For the final images, this is the case, but we have to match the pixel dynamics by adjusting the normalization and the sampling of the images to ensure that a point-like source is represented by the same number of pixels in both data.
On the other hand, the implementation of the transfer learning approach requires the labeling of a subset of the observed data. We carried out this labeling thanks to the classical method Astrodendro with filtering and confirmation by IR/optical counterparts.

YOLO-CIANNA method

Illustration of the detection process with YOLO-CIANNA on the SDC1 data. The input image is on the left, the middle frame is the list of bounding boxes at the output of the network, and the right frame is the final detection after removing all multiple detections.

The YOLO-CIANNA method is based on one of the top performing detection method for computer vision in everyday images: You Only Look Once (YOLO) of Redmon+ 2015 [3], 2016 [4], 2018 [5]. MINERVA team have adapted this method to be dedicated to astrophysical data and represents the state-of-the-art for detecting and characterizing simulated data.

It consists of a fully convolutional network in which a YOLO layer is added at the end. This last layer allows us to detect objects of interest in bounding boxes, and to characterize the object by regression. In practice, the method produce a list of bounding boxes with predicted parameters (position, flux, size, etc.).

The method works as follows: the network grids the image; for each grid element, a list of bounding boxes is predicted; each bounding box is associated with a score that determines its relevance; the output is a list of one vector per bounding box containing the geometry of the box, its score, and the parameters predicted by the regression.
Eventually, we post-process the detections, keeping the most probable boxes, then perform Non Maximum Suppression (NMS), keeping the boxes with the highest score and deleting the boxes that overlap them if their scores are below a fixed threshold.

Schematic representation of our YOLO-based CNN used on 2D continuum data. On the left is represented the layers with the number of filters and their size, and on the right side is represented the dimension of the output at each layer. The color represents the stride used, when the stride is equal to 1 (in green), there are no changes in spatial dimension for the output while if the stride is equal to 2 (in red) the output dimension is divided by 2 on both axes (4 in total for the 2D case). Source: Cornu+ 2024 [1]

Conclusion

Applying the YOLO-CIANNA method to SKA precursors and pathfinders gives satisfactory source detection and characterization results with a high recall and purity in 2D continuum data. Work is ongoing to obtain the best results on LOFAR, to continue ASKAP data analysis, and to generalize the approach to other 2D continuum and HI surveys in preparation for the SKA.
In addition to the detection performance, this process is swift compared to the integration time: the inference of our network to the data takes about 0.5 s/deg2.

References

The CIANNA (Convolutional Interactive Artificial Neural Networks by/for Astrophysicists) framework can be found here.
The MINERVA team page can be found here, and the summary of SDC results can be found here.
You can find me on my personal web page, my Linkedin and my other links.

[1]    Cornu et al. YOLO-CIANNA: Galaxy detection with deep learning in radio data. I. A new YOLO-inspired source detection method applied to the SKAO SDC1, arXiv e-prints Feb. 2024

[2]    Shimwell et al. The LOFAR Two-metre Sky Survey V. Second data release, A&A March 2022

[3]    Redmon et al. You only look once: Unified, real-time object detection. 2015

[4]    Redmon and Farhadi YOLO9000: better, faster, stronger. 2016

[5]    Redmon and Farhadi Yolov3: An incremental improvement. 2018

[6]    McConnell et al. The Rapid ASKAP Continuum Survey I: Design and first results, Astronomical Society of Australia 2020

Results

Results on LOFAR data (120-168 MHz)

Example fields of 12.8' × 12.8' from the LoTSS DR2 data. The image shows an example with instrumental artifacts in the right frame and a field with few artefacts in the left frame. The pixel values are normalized surface brightness with an arbitrary unit. The predictions of the networks are the green boxes with the associated probability in white.

Reference: Shimwell+ 2022 [2] (PyBDSF)
Direct application: 50% Recall; 20% Precision
Dirct application + prunning: 45% Recall; 30% Precision
Transfer-Learning: 90% Recall; 50% Precision (Preliminary)

Results on ASKAP data (888 MHz)

Example fields of 3.5° × 3.5° from the RACS low DR1 data. The image shows an example with instrumental artifacts in the right frame and a field with few artefacts in the left frame. The pixel values are normalized surface brightness with an arbitrary unit. The predictions of the networks are the green boxes with the associated probability in white.

Reference: McConnell+ 2020 [6] (PyBDSF)
Direct application: 55% Recall; 40% Precision
Dirct application + prunning: 50% Recall; 65% Precision