FRELLED : The FITS Realtime Explorer of Low Latency in Every Dimension

Rhys Taylor 1

  • 1 Astronomical Institute of the Czech Academy of Sciences, Prague

Abstract

I present FRELLED, the FITS Realtime Explorer of Low Latency in Every Dimension. This is a data visualisation package specifically designed for examining 3D FITS files, primarily (but not exclusively) intended for HI and higher-frequency radio data sets such as those from ALMA. It provides a number of different visualisation techniques to maximise the scientific returns from the data. Users can view their data volumetrically, as isosurfaces, or as a traditional series of 2D images with the option to use displacement maps, or even in virtual reality. The display can be rapidly toggled between different viewing methods. Multi-volume rendering is possible, both by overlaying two volumetric data sets directly, or plotting contours or isosurfaces from an unlimited number of data cubes over one volumetric display. FRELLED incorporates tools to allow rapid visual cataloguing of data sets of up to 1500^3 voxels, as well as performing basic analysis tasks : comparing their data with the SDSS, querying NED, plotting integrated flux and velocity maps, and measuring the spectral features of the data. Users can create different virtual objects to mask and catalogue data, interactively rescaling and positioning them and using different colours to indicate different object types. These objects can be exported either to produce simple catalogues or for direct processing of the data. In an era where automatic techniques are increasingly dominant, I will demonstrate that the correct cools can still ensure that visual examination can still play an important role even in cataloguing large data sets.

1 : FRELLED version 5.0

Shiny software logo, showing both volumetric and isosurface display capabilities.

FRELLED is a FITS visualisation and analysis package for the 3D art modelling software "Blender". It consists of a series of Python scripts which allow Blender to display and interact with FITS files in different ways. The scripts also change the appearance of Blender's GUI, hiding all the features not typically needed in astronomy and making those normally accessed via the keyboard (or in otherwise inconvenient locations) easy to access. A suite of documentation is provided, including an extensive wiki, in-program help links, and over 80 minutes of video tutorials.

The main FRELLED page with links to installation and useage instructions is here : http://www.rhysy.net/Code/Software/FRELLED/

FRELLED is currently supported on Windows and Linux, but not (alas) Macs. Any Mac users wishing to donate a few hours of their time to try and make this work are welcome to get in touch !

All scripts in FRELLED are controlled via GUIs, with no need for users to ever edit or even access the source code. It is, however, entirely open source, and the code is easily availble within the FRELLED.blend file itself.

2 : What's it for ?

FRELLED has been in development since 2012. Recently it was recoded from scratch to use a more modern, easier to maintain version of Blender which also makes upgrading and adding new features much easier. Originally, it was designed exclusively for HI data cubes and source cataloguing, later expanded to allow numerical simulations as well.

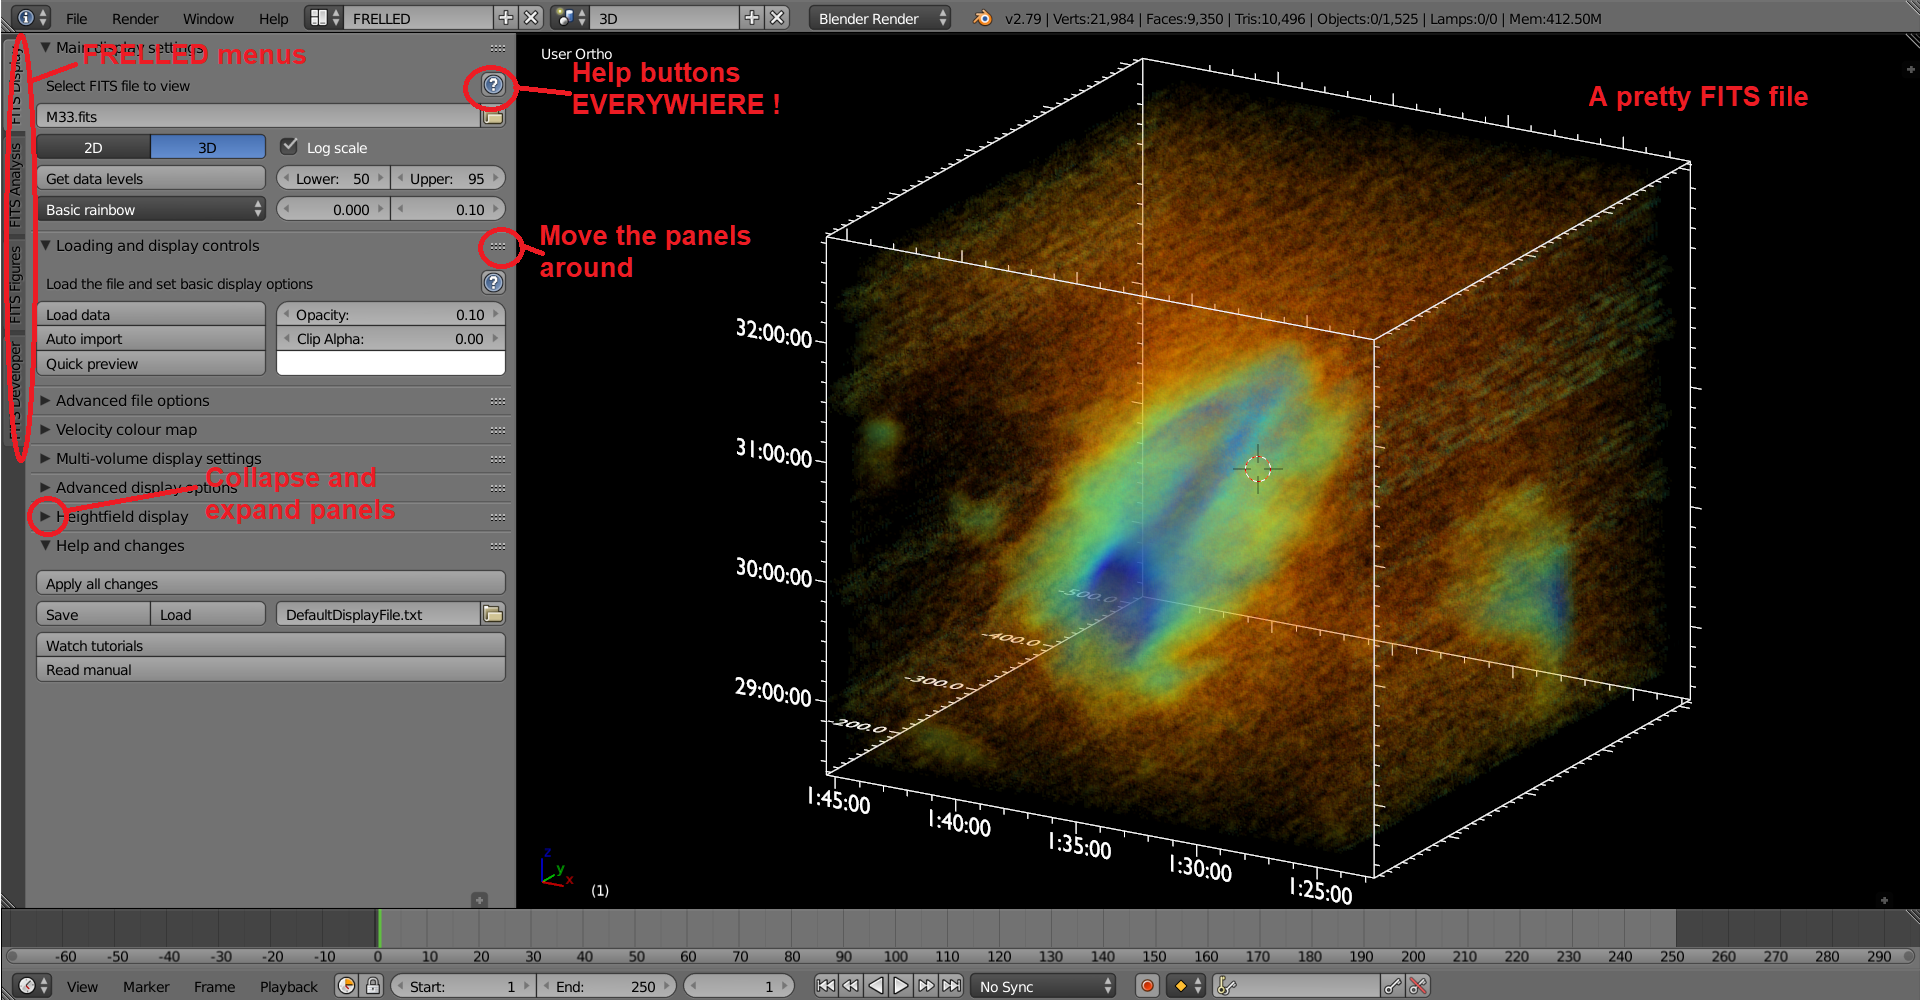
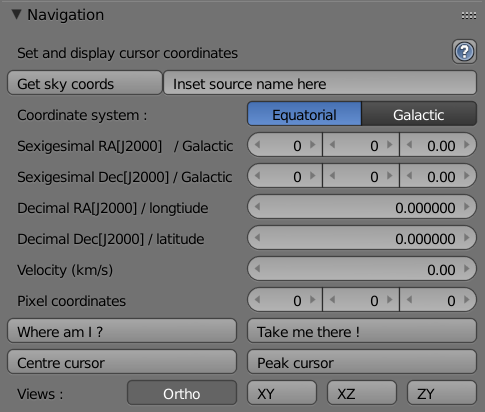
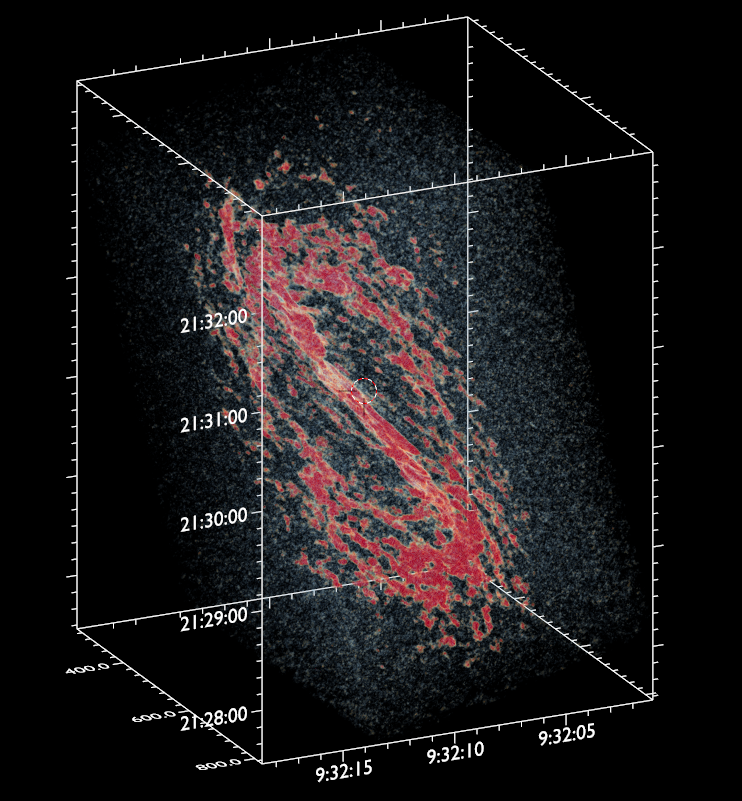
The main motivation was and remains to allow a truly real-time exploration of 3D volumetric data whilst also accounting for essential astronomical features like using a world coordinate system. Being able to explore the data in this way, and also interact with it using Blender's intuitive and powerful interface, allows for very rapid cataloguing of astronomical sources : hundreds per day by eye, in the case of extragalactic HI.

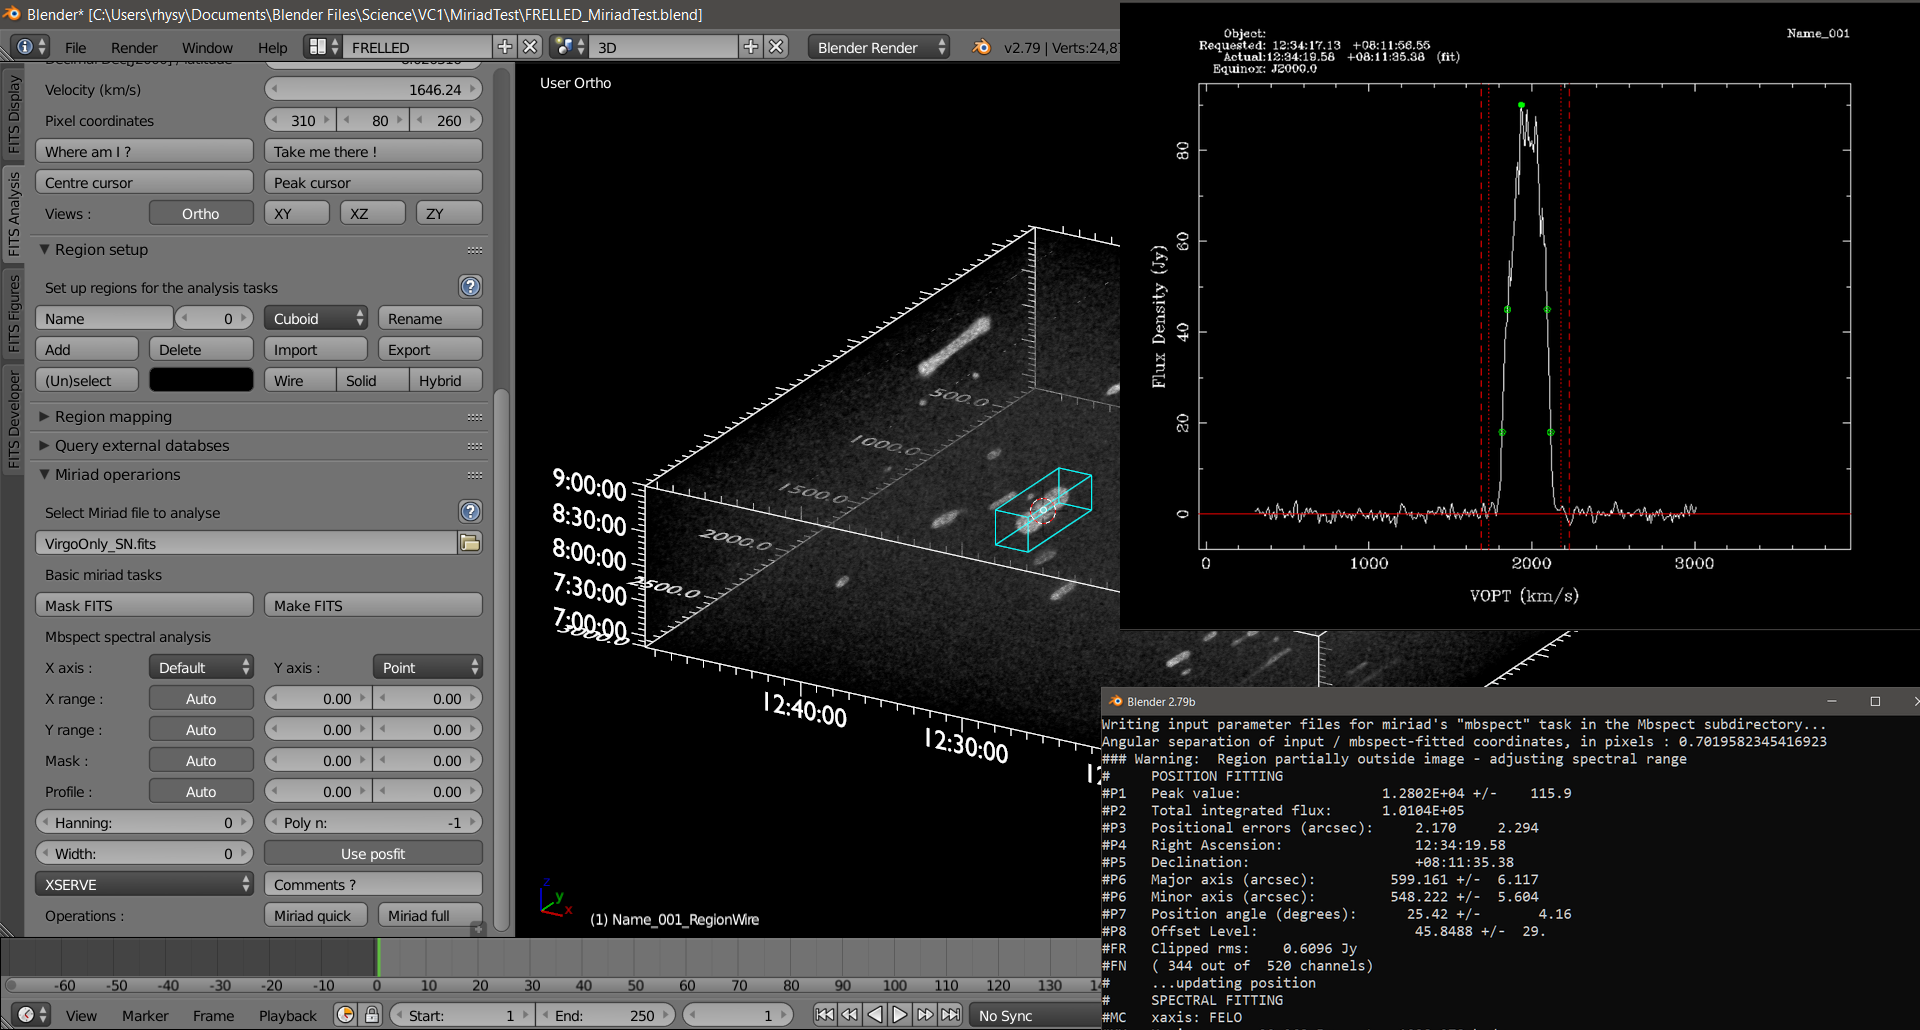
This latest version greatly expands the capabilities of FRELLED. The goal is to include as many different visualisation and analysis tools in the same package as possible – the whole is more than the sum of the parts, and being able to work fully within the same environment is much easier than having to switch programs. Many packages can do some of FRELLED's capabilities but few astronomical products can do all of them at once.

The principle new features include :

  • MUCH easier installation procedure, supporting both Windows and Linux
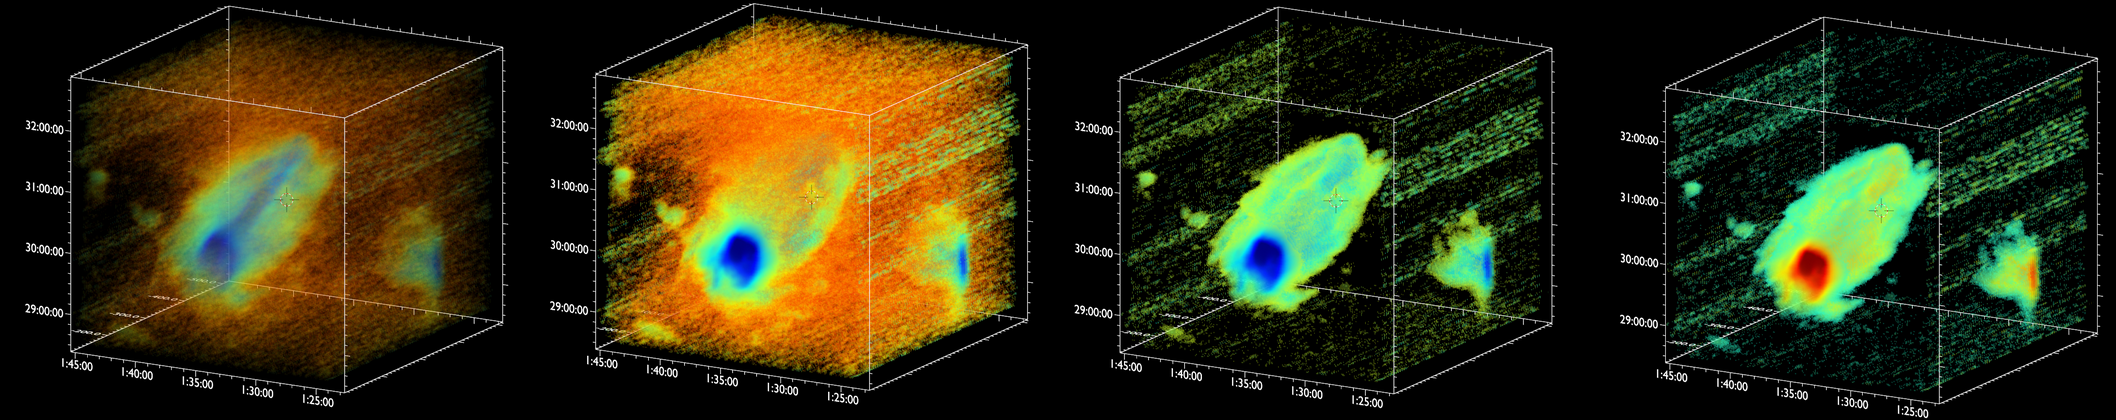
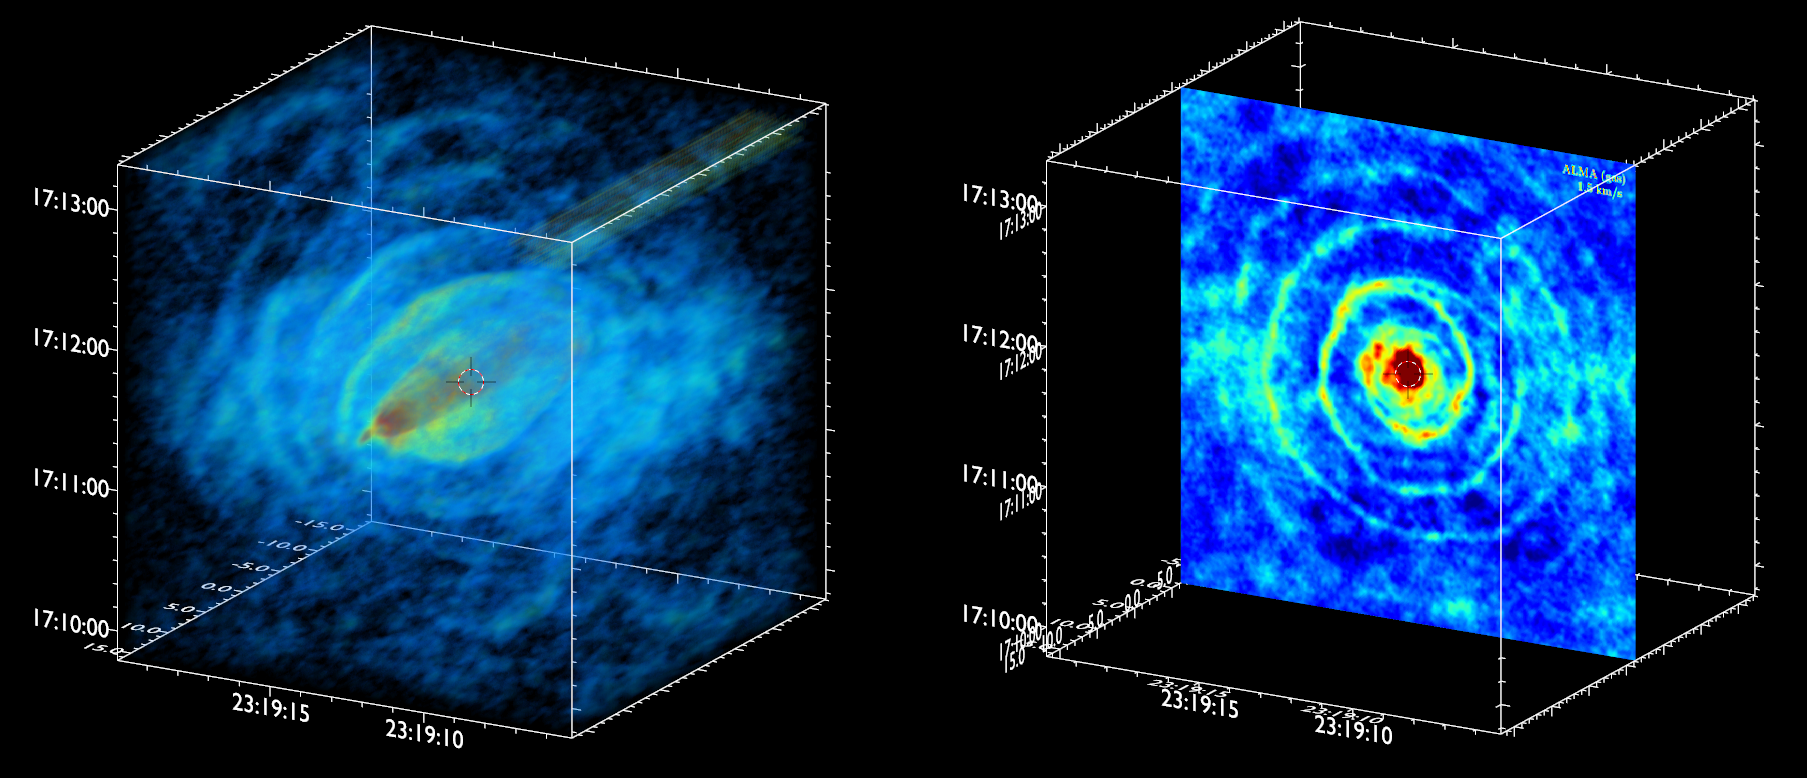
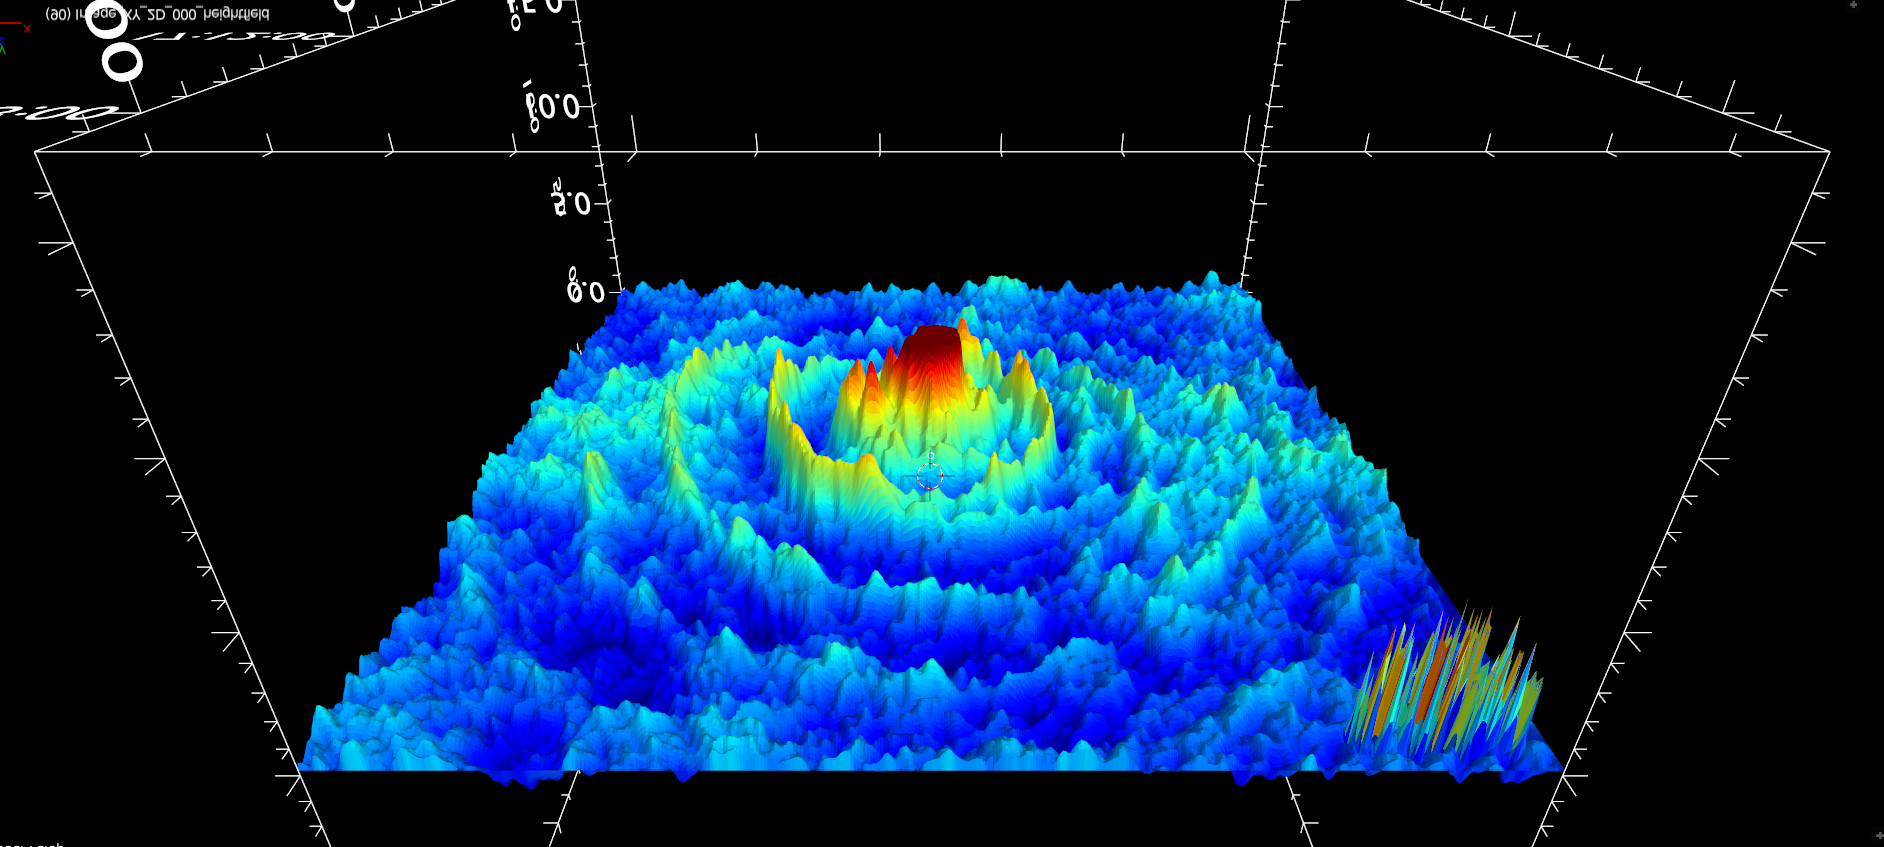
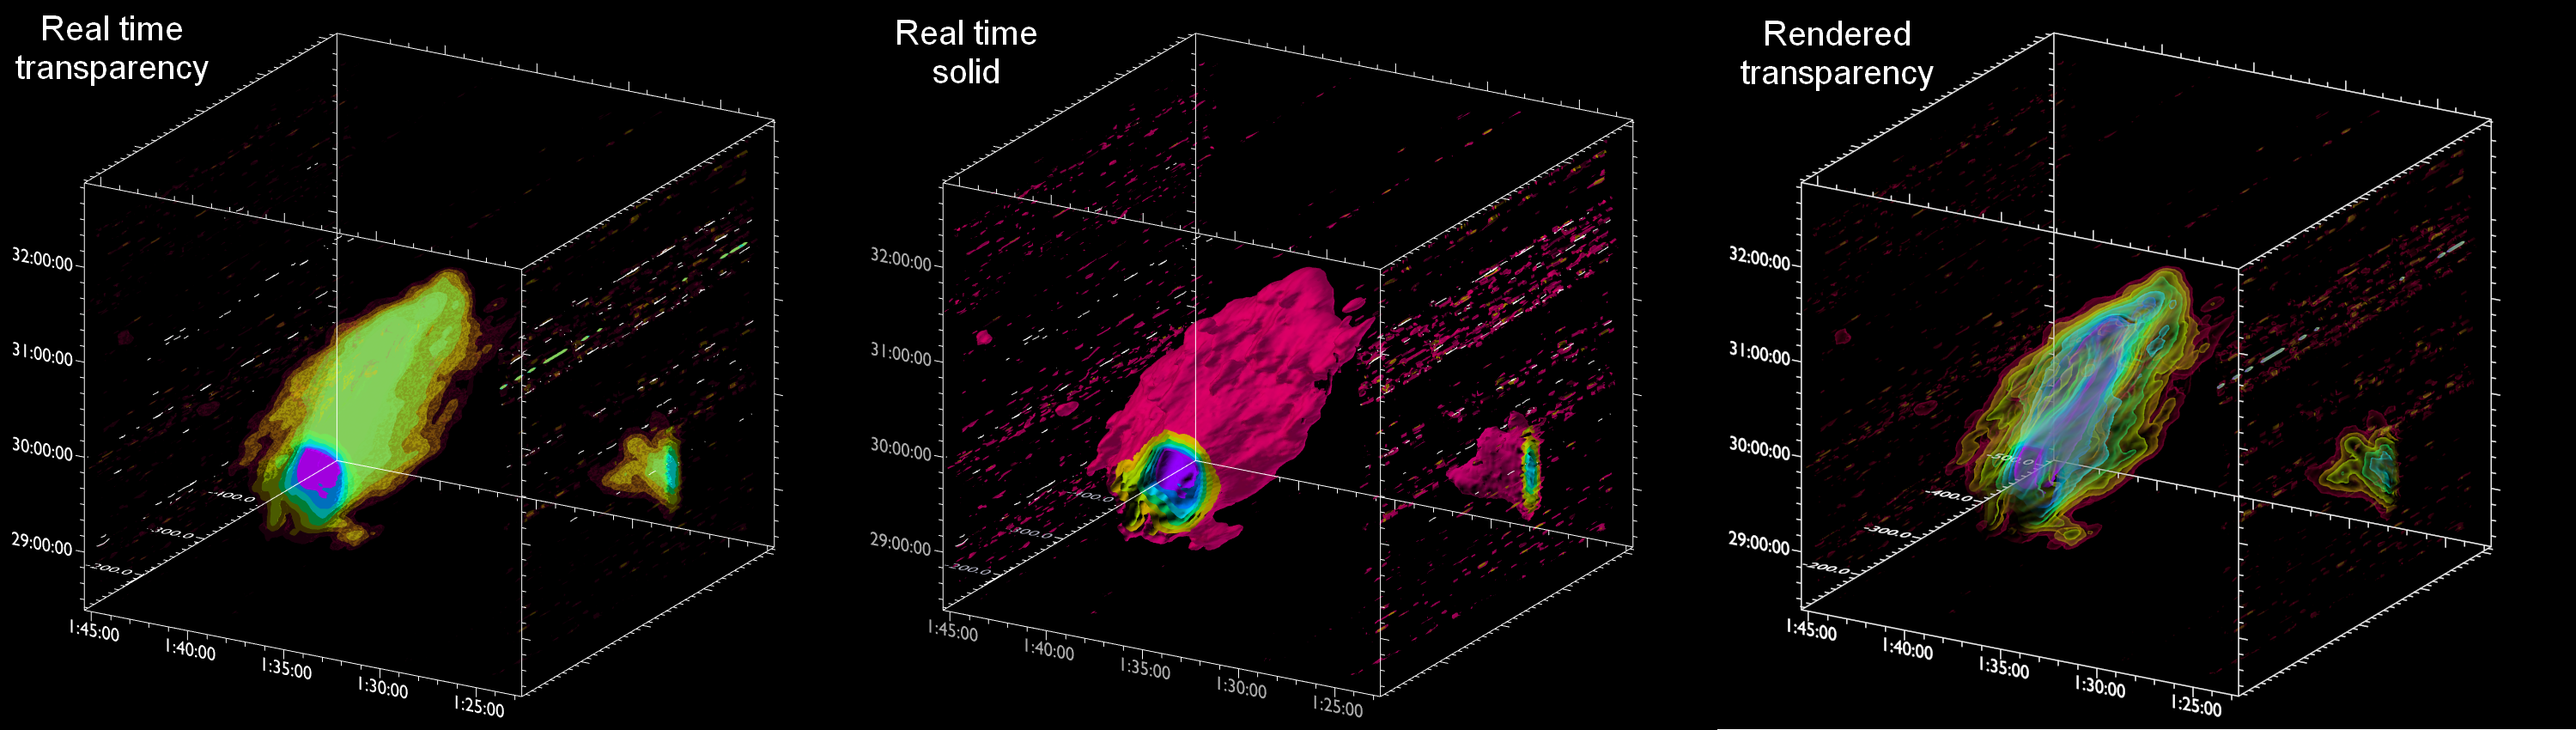
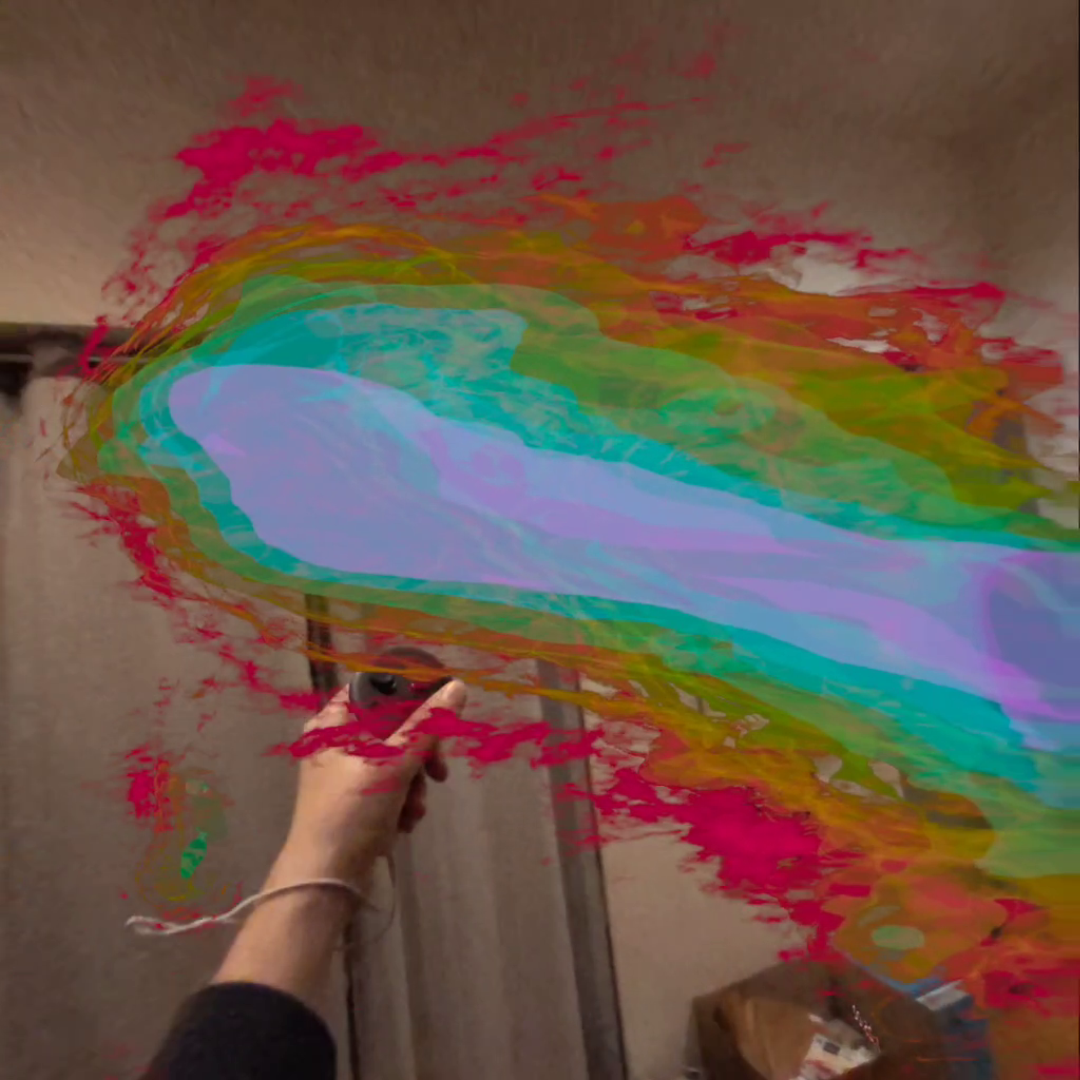
  • Data can be displayed as isosurfaces, heightfields (displacement maps) and in virtual reality, in addition to the standard volumetric display and channel map capabilities
  • Transparency of the volumetric display is adjustable in real-time
  • Data cubes up to 1500voxels are supported (larger cubes are possible, with some limitations, using workarounds)
  • Data is now much faster to load and uses astropy for more accurate world coordinate system display
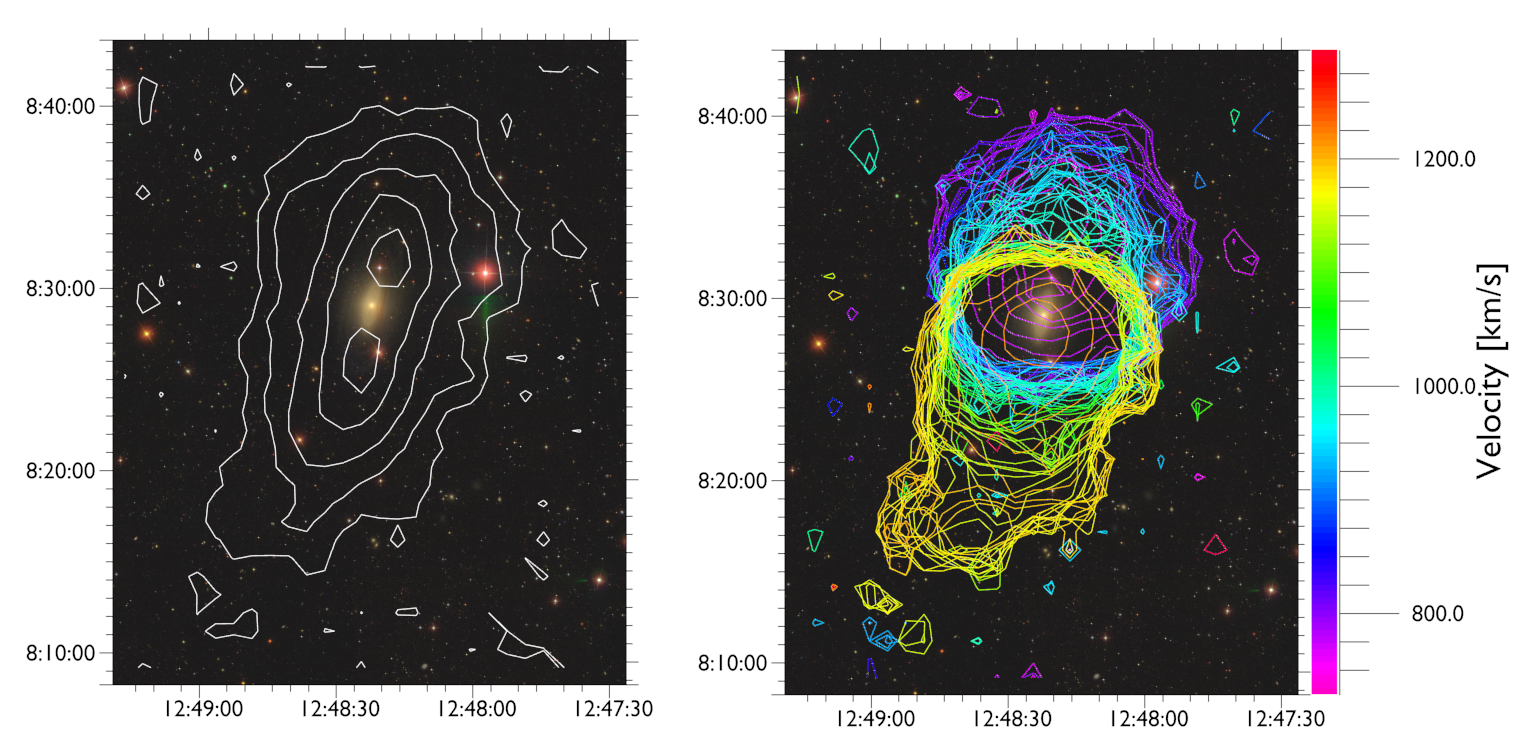
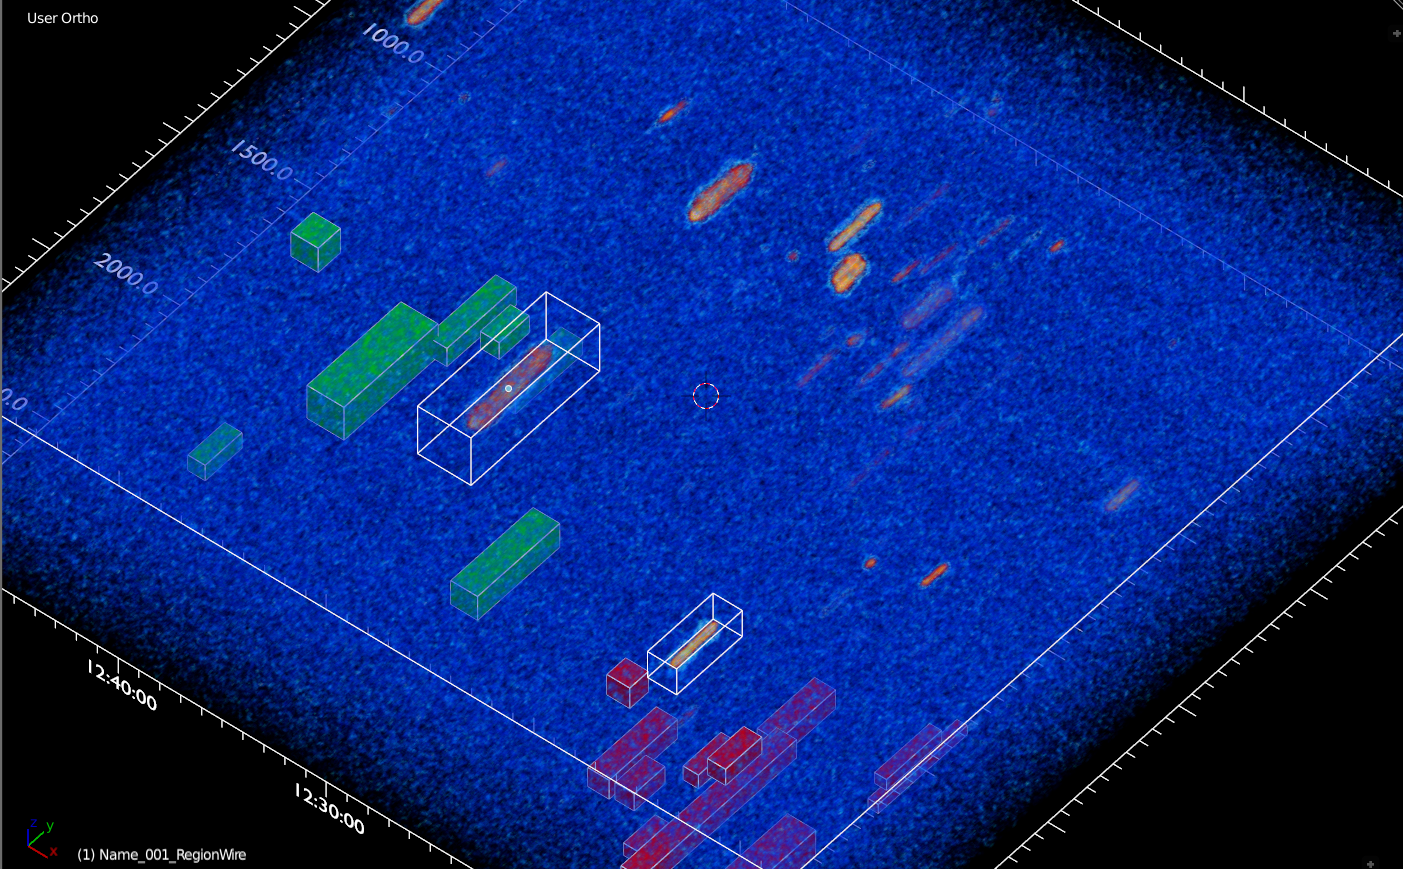
  • A more powerful cataloguing interface allowing different colours for different sources
  • The ability to annotate figures with a variety of markers and save them as presentation-quality plots
  • A much friendlier, simpler GUI with extensive documentation

In particular, using astropy modules has made it much easier to allow ANY astronomy data set to be used, no longer limited to HI. This has been particularly designed towards ALMA data, and while it's still aimed primarily at radio astronomy, in principle any FITS file should be useable.

There are quite likely to be bugs when trying to load data from different sources – in the main, I've found these are generally 5-minute fixes. Please do get in touch if have any problems loading files !

3 : Interface

Major features of the FRELLED graphical user interface.

The FRELLED GUI makes use of Blender's adjustable panel system. All of Blender's standard buttons are hidden by default to avoid scaring astronomers, replacing them with tools more often needed for astronomical data analysis. The interface consists of the control panels on the left and the 3D display window on the right. By default this is very large, so that as much of the screen as possible is dedicated to data visualisation.

The tabs on the left control access to the different menus :

  • The default "Display" tab allows users to load the data and control its display
  • The "Analysis" tab allows users to navigate in world coordinate systems, create regions to mask and catalogue sources, generate contours, query NED and the SDSS, and perform spectral line analysis with MIRIAD (if installed)
  • The "Figures tab" is for creating annotations useful in explanatory figures, as well as setting up both rotating turntable and time series animations. The data display values can also be animated, and it's even possible to batch-render animations of multiple time series
  • The "Developer" tab helps provide access to under-the-hood diagnostic tools for when things go wrong, as well as reconfiguring FRELLED for specialist cases

The navigation panel in the Analysis menu. Users can resolve the coordinates of a source using astropy's name resolver, and can operate in either equatorial or galactic coordinates (and can switch between them). They can use sexigesimal as well as decimal values, or operate in pixel values. This is particularly useful if the file doesn't have a world coordinate system, e.g. simulation data.

The size of the whole panel can be adjusted, and the whole tool shelf can even be dismissed entirely so only the data is visible. By default, panels less likely to be used are collapsed, and these can be expanded with the little triangles. Individual panels can be moved around. Each panel comes with a help button detailing what all its buttons do.

When the user has set up the data display how they like, the FRELLED.blend file can be saved. This includes all regions and annotations they create, so they don't have to start from scratch. It's also possible to save files which preserve the display options (such as the data display range), allowing users to easily re-use the same display options multiple times if needed.

4 : Volumetrics

The original motivation behind FRELLED was to be able to display 3D FITS files in real time as volumetrics. Other FITS viewers do this, but generally only to a limited extent : for example DS9's 3D viewing capability takes several seconds to update the view every time the orientation is changed. With FRELLED there is no delay at all. The user can freely rotate the view, toggle perspective, control the opacity and clipping of the data, and even display two different volumetric data sets simultaneously. 


The same volume with different display settings. The default transparency (far left) allows the interior of the data and the noisier parts to be shown. In the next panel, increasing the opacity leads to a brighter display, but hides the inner parts of the data and makes the noise more prominent. Adjusting the clipping (third panel) helps hide the noise while keeping the brighter data clearly visible. All of these adjustements are possible in the real time view. On the far right, the same settings as the third panel are used, but with the colour scheme reversed. This requires reloading the data. The file shown here is M33 from the AGES HI survey.

The major disadvantage of FRELLED is that the colour transfer function cannot be altered after the data is loaded - to do so, the data must be loaded again with the new settings. This does not, however, alter any of the user-created maps or regions (see panels 6 and 7). It's also possible to alter the transparency and data clipping levels in real time, as shown above, which can often be sufficient to avoid the need to reload the data.

PHANGS CO(2-1) data of NGC 2903.

The old version of FRELLED was hard-coded to assume HI for the spectral axis. This new version now uses astropy and associated modules to be much more robust to different coordinate systems, and has also been significantly optimised for faster loading times. The above PHANGS data from ALMA loaded in 28 seconds, whereas the same file on the same machine took 38 seconds with GLNemo2 (with the caveat that FRELLED does not allow such fine control over the colour transfer function without reloading the data).

5 : Channel maps

The advantage of volumetric displays is that the user can see everything, everywhere, all at once. They get an instantaneous, intuitive understanding of the structures in their data that can take much longer to develop when viewing traditional 2D slices of the data. However, slices posses the advantage that none of the intervening noise in the data gets in the way of the view, which can be extremely problematic when trying to find the faintest sources in the volumetric display. FRELLED also lets the user display the data as channel maps along the three major projections (literally as channel maps showing intensity as a function of sky position; RA-Velocity maps; Declination-Velocity maps - or whatever the spectral axis happens to be). Users can have both the 3D and 2D views of their data in the same file, and can toggle back and forth between the two display modes.

ALMA data of LL Pegasii, with a volume render on the left and a channel map on the right.

Channel maps and data slices can also be toggled into heightfields, a.k.a. displacement maps. Here each pixel is displaced orthogonally to the map direction by an amount determined by the data value at that point. What would otherwise be a flat, coloured image, becomes a landscape of data to explore. This can greatly alleviate the difficulties of choosing a sensible colour transfer function for data with a high dynamical range : instead of saturating the brightest data, it simply extends to higher displacement levels; instead of suppressing the faintest data, one can simply zoom in to see its height variation. The user can also toggle (in real time) the scaling factor and function used for setting the displacement.

The same data as above but rendered as a heightfield, in which each pixel is displaced orthogonally to the image by an amount proportional to its value. Here the scaling is linear, but logarithmic and square root transformations are also possible.

6 : Maps

The volumetric and channel maps are both designed as ways to search the data in the broadest possible way for different features, without imposing any more than the most necessary constraints on the data. However, sometimes less is more, and restricting the view of the data can help reveal more than it hides. Contour plots are the classic case. By restricting the view to known significance levels, the data can be more reliably judged to determine what's real and what might be noise, e.g. is that a bridge of gas or just some fluff ? 

FRELLED allows the user to create several different maps from their data :

  • Moment 0 maps / contours, integrating the flux over a specified range
  • Peak flux maps / contours, only showing the brightest parts of the data along the spectral axis
  • Velocity maps / contours (moment 1) , showing the typical velocity of the data
  • Renzograms, plotting single level contours at multiple channels, with each contour coloured according to the velocity - a useful, compact alternative to channel maps
  • Isosurfaces, essentially contours but in 3D, plotting where the data as fixed-level surfaces

In addition, FRELLED can also overlay SDSS RGB images. Once generated, all these maps can be toggled, so the user can combine them however they need. It's also possible to use different data sets to create the maps from the ones used for the main volumetric (or channel map) display. This means there's no actual limit on the number of data sets FRELLED can overlay except from system performance.

Examples of different maps possible with FRELLED, both showing HI data of VCC 2034 from AGES overlaid on an optical image from the SDSS. Left : peak flux map, with the lowest contour at 1 sigma and increasing geometrically by a multiple of 2. Right : renzogram at 3.5 sigma, with each channel coloured according to velocity.

Isosurfaces are a special kind of map which can be as useful for visualisation as for analysis. By reducing data to a series of surfaces at constant flux levels, complex, three-dimensional structures can be revealed even in comparitively noisy data. FRELLED can display them either as transparent structures in the real time 3D view (albeit with artifacts due to limitations of Blender, which are removed in the rendered view) or as solid surfaces. Users can set the visibility of the isosurfaces using the same clipping controls as for volumetric data, and they can also set their transparency if only a single surface is generated.

Isosurfaces of the M33 HI data from AGES, shown in the different availabe viewing modes.

7 : Analysis

One key reason to develop FRELLED was because looking at 3D data in 3D is fun. Beyond this, Blender's tools for manipulating objects give it extremely powerful capabilities for analysing data. The main tool provided by the FRELLED scripts is the ability to create objects called regions which can be used for cataloguing, masking, and understanding selected parts of the data. At its simplest, a region can be used to mask that part of the data : the user then knows there's a source there which they've catalogued.

HI cube of part of the Virgo Cluster from AGES. Here several galaxies have been identified and masked, with different colours used for different sources. Two sources are shown in wireframe mode so that the source data is still visible, while the rest are shown as solid objects that completely hide the data in those locations. Mask regions can be exported to and imported from text files, and can be used as crude catalogues or for more detailed analysis.

This cataloguing can be extremely rapid. The speed of visual source extraction is not limited by the human brain, which identifies features in a matter of milliseconds, but by the speed they're able to record what they see. In real-world tests, users can identify and mask ~300 extragalactic HI sources per working day. With optimisations, this figure rises to ~800. This cataloguing speed brings visual extraction back into the realm of feasibility even for really large data sets, although the largest would require teams of users to complete the examination in a reasonable time.

Example of using FRELLED as a GUI for MIRIAD's "mbspect" task. The highlighted region is used to set the input coordinates and spectral profile window, which mbspect uses to compute and analyse the spectrum at that point. The plotted spectrum and output to the terminal (which gives some of the basic spectral parameters) are shown inset.

Regions also allow different parts of the data to be examined quantitatively. In extragalactic HI, for example, galaxies are typically unresolved, discrete sources, so there is no point plotting the contours or measuring the spectra over the whole cube : one needs to restrict this to where the signal is present. As well as plotting contours, regions can be used to interface with miriad's "mbspect" task for spectral analysis. They can also be used to measure the total flux, even in volumes of arbitrary shape.

8 : Virtual Reality

Why wouldn't you want to look at your data in virtual reality ? No reason that I can think of ! FRELLED uses Blender 2.79, which doesn't support VR headsets directly. However it comes with a couple of simple scripts to export the data for display in Blender 2.9+ (works even in Blender 4.0), which does. You can walk around your data as though it were floating in front of you, and interactively adjust the scaling. A mixed reality display is also possible.

Exploring the M33 HI data cube from AGES in mixed reality. Here the data is shown using isosurfaces, but volumetric renders can also be used. FRELLED can create annotations to highlight and label selected features and these can also be displayed in virtual or mixed reality, making this useful for public outreach.

Virtual Reality in FRELLED is currently only a proof-of-concept feature, useful for public outreach but not yet allowing any interaction with the data : this will require further development of Blender itself. However, just as viewing the data in 3D on a 2D screen helps reduce projection effects which can give a false impression of the structures present, so too does having a true stereoscopic view of the data reduce this still further. VR is still something of a fun toy or gimmick, but in the long term, it has potential to make a real difference to data analysis.

9 : The Future

The recoding of FRELLED has made it more modular for easier maintence and migratability. Moving it to the most modern version of Blender is still a big undertaking - anyone wanting to participate will be welcome ! The rewards are potentially substantial :

  • Blender 4.0 has a significantly more powerful real-time display, allowing for much faster loading and larger data sets to be displayed
  • Blender 4.0 supports updating the display of the images in the real-time display, allowing truly interactive colour transfer functions
  • Blender 4.0 allows for native VR display, bypassing the need to run additional scripts to convert the data

Other upgrades may be possible within the current FRELLED framework, such as :

  • Incorporating the astroquery module to automatically label known features in the data
  • Restoring the n-body and vector display capabilities of the old version of FRELLED
  • Allowing queries / overlaying images from other data sets such as the Legacy Survey and ESA sky
  • A control to limit the data shown to some fixed range around a selected point, helping reduce the intervening noise without needing to clip the data

Implementing these and other features will depend mainly on user interest and whether I can summon the necessary willpower/resources to make it happen.