SpotDIPy: an Open-Source Python Package for Stellar Surface Imaging

Engin Bahar 1 , Hakan V Senavci 1 , Emre Isik 2 , Sanghee Lee 3

  • 1 Dept, of Astronomy and Space Sciences, Ankara University, Ankara
  • 2 Max Planck Institute for Solar System Research, Goettingen
  • 3 Dept. of Astronomy, Kyoto University, Kyoto

Abstract

Magnetic activity plays a crucial role in the structure and evolution of stars and their planets, manifesting itself on stellar atmospheres as starspots and their associated brightness variability. Investigating stellar magnetic activity through the analysis of surface brightness variations provides key insights into a star's magnetic dynamo and its astrospheric impacts. High-fidelity reconstructions of these surface brightness distributions are needed for studying the scaling and effects of magnetic activity. To perform such analyses, powerful, open-source tools are required, enabling researchers to conduct detailed and reproducible studies on stellar surfaces and magnetic phenomena in a collective way.

SpotDIPy is an open-source Python package designed for reconstructing stellar surface brightness distributions of single stars using spectroscopic data (Bahar et al. 2024). The package implements Doppler imaging to map surface brightness variations based on spectral line profile distortions. The new version we present here employs light curve inversion to infer surface features from high-cadence photometric observations. Both techniques are based on a three-temperature model, where the stellar surface elements consist of local line profiles or intensities representing the photosphere, hot spots, and cool spots. A key feature of SpotDIPy is its ability to perform these two techniques simultaneously within a maximum-entropy minimisation scheme, enhancing the reliability of surface reconstructions.

SpotDIPy accounts for key astrophysical effects such as limb darkening and gravity darkening and computes local continuum specific intensities using model atmospheres, ensuring physically realistic brightness maps. The package includes a grid search feature that enables precise determination of stellar parameters such as the projected rotational velocity (v sin i) and axial inclination. Despite its advanced capabilities, the package is designed to be highly user-friendly, allowing researchers to efficiently reconstruct stellar surfaces with minimal effort. Additionally, SpotDIPy features a powerful plotting interface that enables clear and detailed visualisation of the results, making it easier to interpret the reconstructed surface maps.

SpotDIPy is openly available on GitHub, making it easily accessible for researchers working on stellar surface imaging. This study presents its key methodologies and validations using both synthetic and observational data.

Introduction

Stellar surface spot distributions are commonly studied using Doppler Imaging (DI) or Light Curve Inversion (LCI) methods. DI leverages rotationally modulated spectral line distortions to effectively map starspots, especially at high latitudes on rapidly rotating stars. In contrast, LCI interprets brightness variations in photometric light curves to infer spot characteristics such as longitude, size, and temporal evolution. Each method offers unique strengths but also comes with inherent limitations. Noise in observational data is a key reason why ill-posed problems like DI do not yield unique solutions. While LCI provides valuable insight, it faces limitations due to degeneracies between spot latitude, size, and contrast—making accurate latitude determination difficult. The emergence of space-based telescopes has notably facilitated access to high-precision photometric data, which is now generally more attainable than high-SNR spectroscopic data. In this study we introduce updated version of SpotDIPy, which is a new open-source Python package that reconstructs single-star surface brightness distribution maps using Doppler Imaging (DI) and Light Curve Inversion (LCI) techniques simultaneously. Here, we carried out a simulation to illustrate the advantages of the combined DI+LCI approach, followed by a joint application of DI and LCI to the Sun-like star V1358 Ori.

Future Works

o Support for reconstruction using multi-band light curves

o Capability to perform imaging for binary star systems

o Implementation of Zeeman Doppler Imaging

Application on V1358 Ori

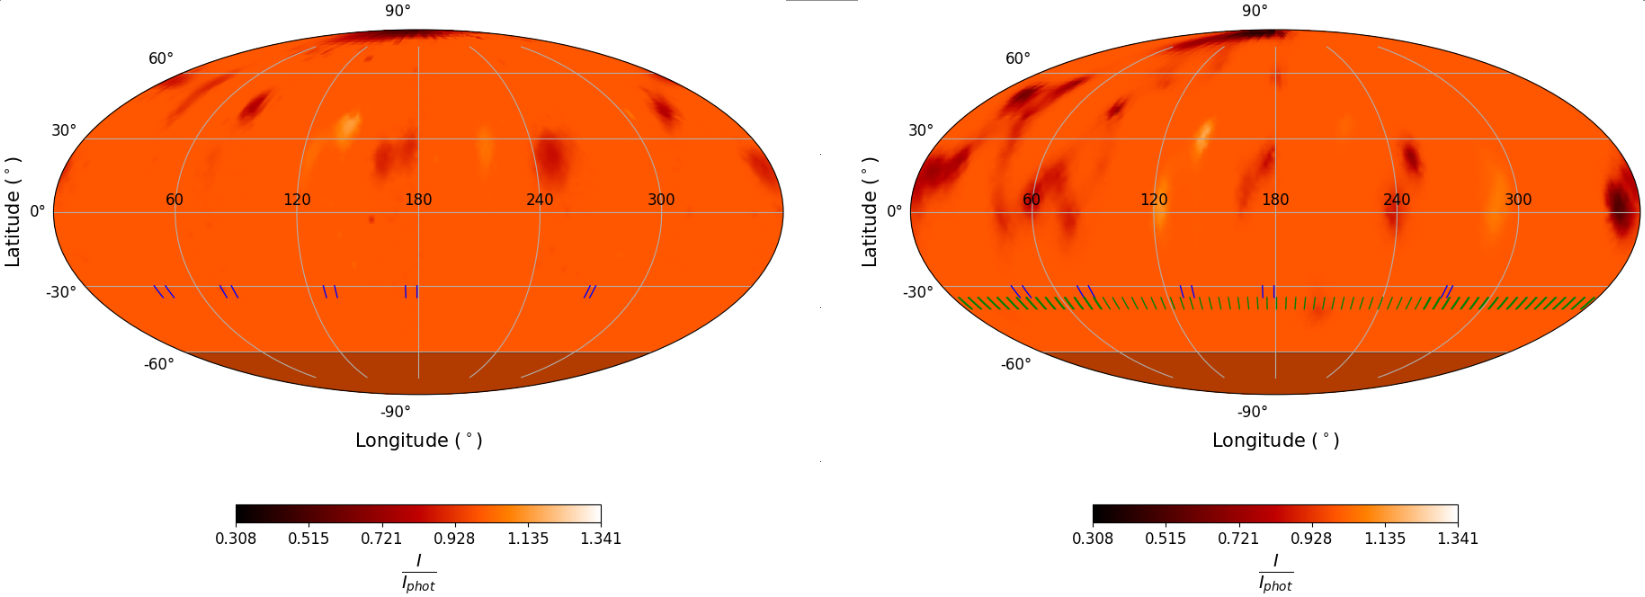
The panels above show the surface brightness maps of V1358 Ori, a young F9-type star with a rotation period of 1.4 days, reconstructed using DI alone (left) and the combined DI+LCI approach (right). When the TESS light curve is incorporated into the reconstruction, some spot features at low and even mid-latitudes become recoverable, and some of the spots initially identified with DI alone are seen to shift toward lower latitudes. This highlights the enhanced latitude sensitivity achieved through the combined method.


For a detailed analysis of the surface brightness distribution of V1358 Ori, see Bahar et al. (2025).
Recovery of Spot Latitudes

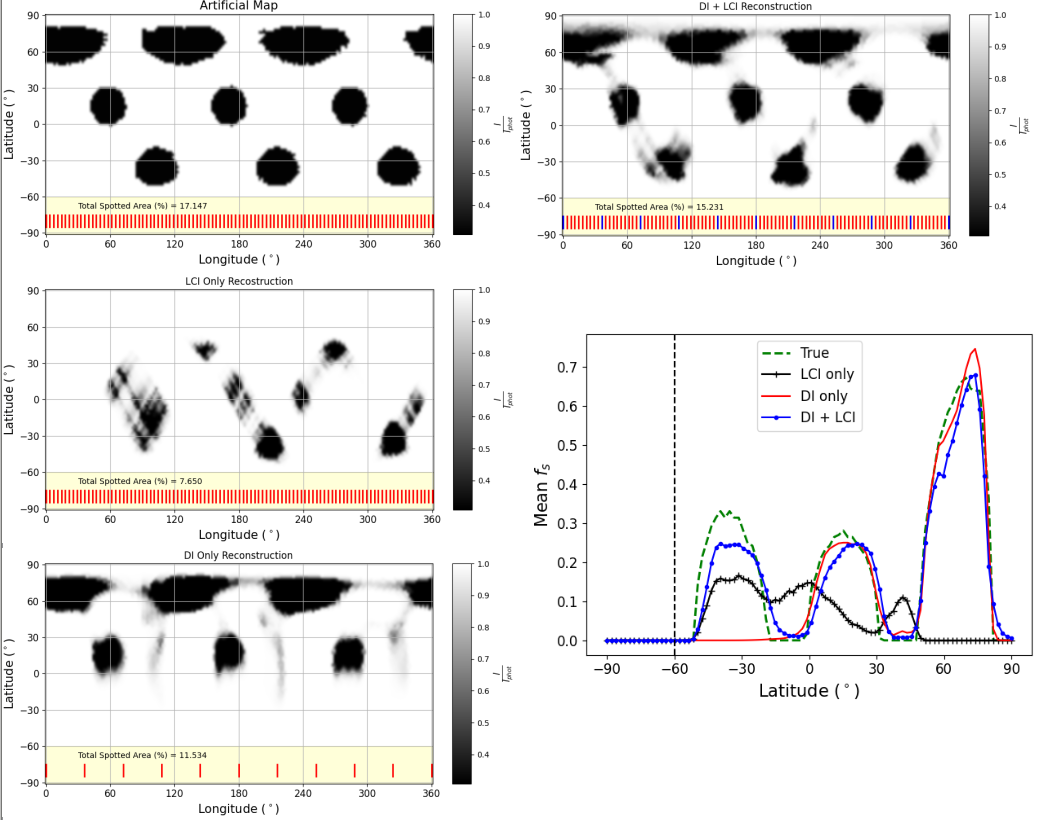
The advantage of combining DI and LCI is clearly demonstrated in the panels above. The top-left panel displays the brightness distribution of a synthetically generated stellar surface. Based on this artificial map, corresponding spectral line profiles and light curves were simulated and subsequently degraded by the addition of noise. These data were used to reconstruct surface brightness maps using DI only, LCI only, and a combined DI+LCI approach. The middle-left panel shows the surface map derived from light curves using LCI, while the bottom-left panel shows the map obtained from line profiles using DI. The top-right panel presents the result of the combined DI+LCI reconstruction, using both spectroscopic and photometric data simultaneously.


The similarity between the DI+LCI map and the original artificial distribution is remarkable and highlights the accuracy of the reconstruction. The simulations clearly demonstrate that Doppler Imaging (DI) alone lacks sensitivity to spots on the less visible hemisphere (cross-equatorial streaks), whereas light curve inversion (LCI) is largely insensitive to high-latitude spots, and it partly fails to disentangle low-latitude features on opposite hemispheres. In contrast, the combined DI+LCI approach leverages the strengths of both methods, substantially reducing their individual biases and enabling a more comprehensive surface reconstruction. This improvement is also clearly reflected in the bottom-right panel, which shows how the average spot coverage varies with latitude. This complementarity between the two diagnostic methods has also been demonstrated in previous studies (Waite et al., 2011; Finociety et al., 2021, 2023).

In the case of V1358 Ori phase sampling

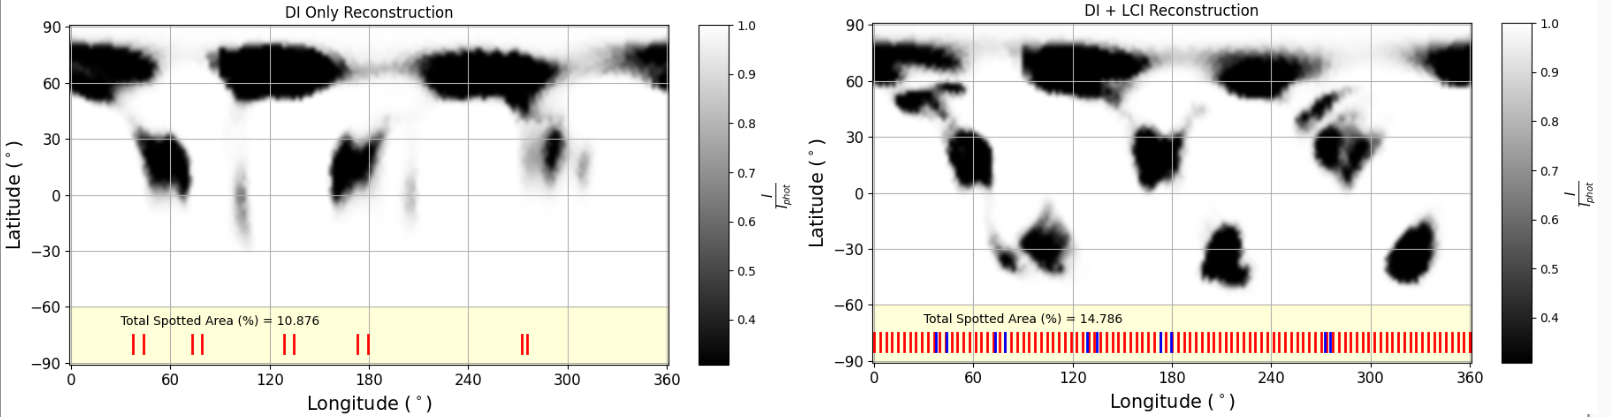
Just like SNR, phase coverage is also critical for reconstructing a realistic surface brightness map. If the number of spectra is insufficient and/or the phase sampling is not uniformly distributed, certain spot features may not be recovered, and artificial spots may appear in the map. However, if a continuous, high-precision light curve—obtained simultaneously with the spectroscopic data—is incorporated into the reconstruction, these issues can be significantly mitigated.


In the figure above, the left panel shows the surface map reconstructed using DI alone under inhomogeneous phase coverage (as in the case of V1358 Ori), while the right panel shows the result of the combined DI+LCI reconstruction. The improvement provided by including the light curve is evident.

SpotDIPy Available on GitHub

References

Bahar, E., Şenavcı, H. V., Işık, E., et al. 2024, ApJ, 960, 60

Bahar, E., Özavcı, İ., Yorulmaz, E. B., et al. 2025, CoSka, 55, 352

Donati, J. F., Semel, M., Carter, B. D., Rees, D. E., & Collier Cameron, A. 1997,

MNRAS, 291, 658

Espinosa Lara, F., & Rieutord, M. 2011, A&A, 533, A43

Finociety, B., Donati, J. F., Grankin, K., et al. 2023, MNRAS, 520, 3049

Finociety, B., Donati, J. F., Klein, B., et al. 2021, MNRAS, 508, 3427

Grant, D., & Wakeford, H. R. 2022, JOSS, 9, 6816

Waite, I. A., Marsden, S. C., Carter, B. D., et al. 2011, MNRAS, 413, 1949

SpotDIPy

SpotDIPy (Bahar, 2024) is a Python package for reconstructing stellar surface brightness maps using DI on mean line profiles from stellar spectra (via Least Squares Deconvolution; Donati 1997), and LCI on photometric light curves.


Both DI and LCI model surface inhomogeneities (cool/hot spots) using a three-temperature model, with appropriate local line profiles and intensities. The methods can be used independently or jointly, leveraging both spectroscopic and photometric constraints. To address the ill-posed nature of the inversion, SpotDIPy applies maximum entropy regularization to yield the smoothest solution consistent with the data.


Key features include:

  1. Construction of an equal-area surface grid, accounting for rotational oblateness and gravity darkening (Espinosa Lara & Rieutord, 2011).
  2. Calculation of limb-darkening coefficients using the ExoTiC-LD package, based on local temperature, gravity, and metallicity.
  3. Inclusion of macroturbulence and instrumental broadening in the local line profiles.
  4. Support for differential rotation in the inversion.
  5. Estimation of stellar parameters (e.g., v sin i) via grid-search optimization.
  6. User-friendly usage, installation and a visual interface for inspecting inversion results.