Finding T-Dwarf Companions to Gaia Primary Stars

Gemma Cheng 1 , David Pinfield 1

  • 1 University of Hertfordshire, Hatfield

Abstract

Since they were first discovered 30 years ago, T-dwarfs have been an area of interest due to their low masses and cool atmospheres straddling the realm between stars and planets, but the properties of lone brown dwarfs are notoriously hard to determine due to the degeneracy between age, mass and temperature. By finding T-dwarfs that are part of wide binary systems with Gaia-detected primary stars, we can infer some of the characteristics from the primary star (such as age), which helps us to determine other properties and aids in building a better understanding of the physics of T-dwarfs.

In this work, we have employed the VISTA Hemisphere Survey DR6 and Dark Energy Survey DR2 to perform a deep search for T-dwarfs, reaching down to J-band magnitudes of ~20. We have found ten T-dwarfs in wide binary systems, with spectral types between T4 and T9 and proper motions ranging from 50 mas/yr to 1 arcsecond/yr – these include four T-dwarfs in binary systems with white dwarf primaries. We have obtained FourStar observations to confirm the binarity of our T-dwarfs through common proper motion, and we have also obtained FIRE spectra of our confirmed companions to further constrain the properties of the T-dwarfs.

Introduction

Brown dwarfs slowly cool as they age, leading to a degeneracy between their ages, masses and temperatures, and meaning that isolated brown dwarfs can be difficult to characterise (Burrows et al. 2001). By studying brown dwarf companions to Gaia-detected primary stars, we are able to break the age-mass-temperature degeneracy by inferring some of the properties of the brown dwarf from the primary star by assuming the co-evolution of the binary system.

In this work, we use the VHS and DES surveys to detect new candidate T-dwarf companions to Gaia-detected primary stars. Similar searches for T-dwarfs have yielded promising results (see Carnero Rossell et al. 2019, dal Ponte et al. 2023), and this work searches for mid-late T-dwarfs deeper than ever before. With a wider proper motion range than in previous studies, we aim to find T-dwarfs which lie further away, pushing the limits of proper motion accuracies. Ultimately, our sample of T-dwarfs in binary systems can be used to create a set of benchmarks with dynamical masses and ages (Marocco et al. 2017).

Measuring Proper Motions

Finding all available VHS J-band and DES z-band epochs for each T-dwarf candidate allowed us to use the longest possible baselines to measure the proper motions. Using the earliest available VHS J-band image and the most recent DES z-band or z-stack image, we measured the T-dwarf proper motions by locating the centroid of the T-dwarf in each epoch and calculating its motion between the observations:

\begin{equation} \mu_\alpha = 1000 \frac{\Delta\alpha 15 \cos(\delta)}{\mathrm{baseline}} \end{equation}
\begin{equation} \mu_\delta = 1000 \frac{\Delta\alpha}{\mathrm{baseline}} \end{equation}

In order for a pair to be retained in our sample, we require the primary star and T-dwarf proper motions to be within the ranges of one another.

This resulted in our initial sample of 91 candidate pairs.

The Final Sample

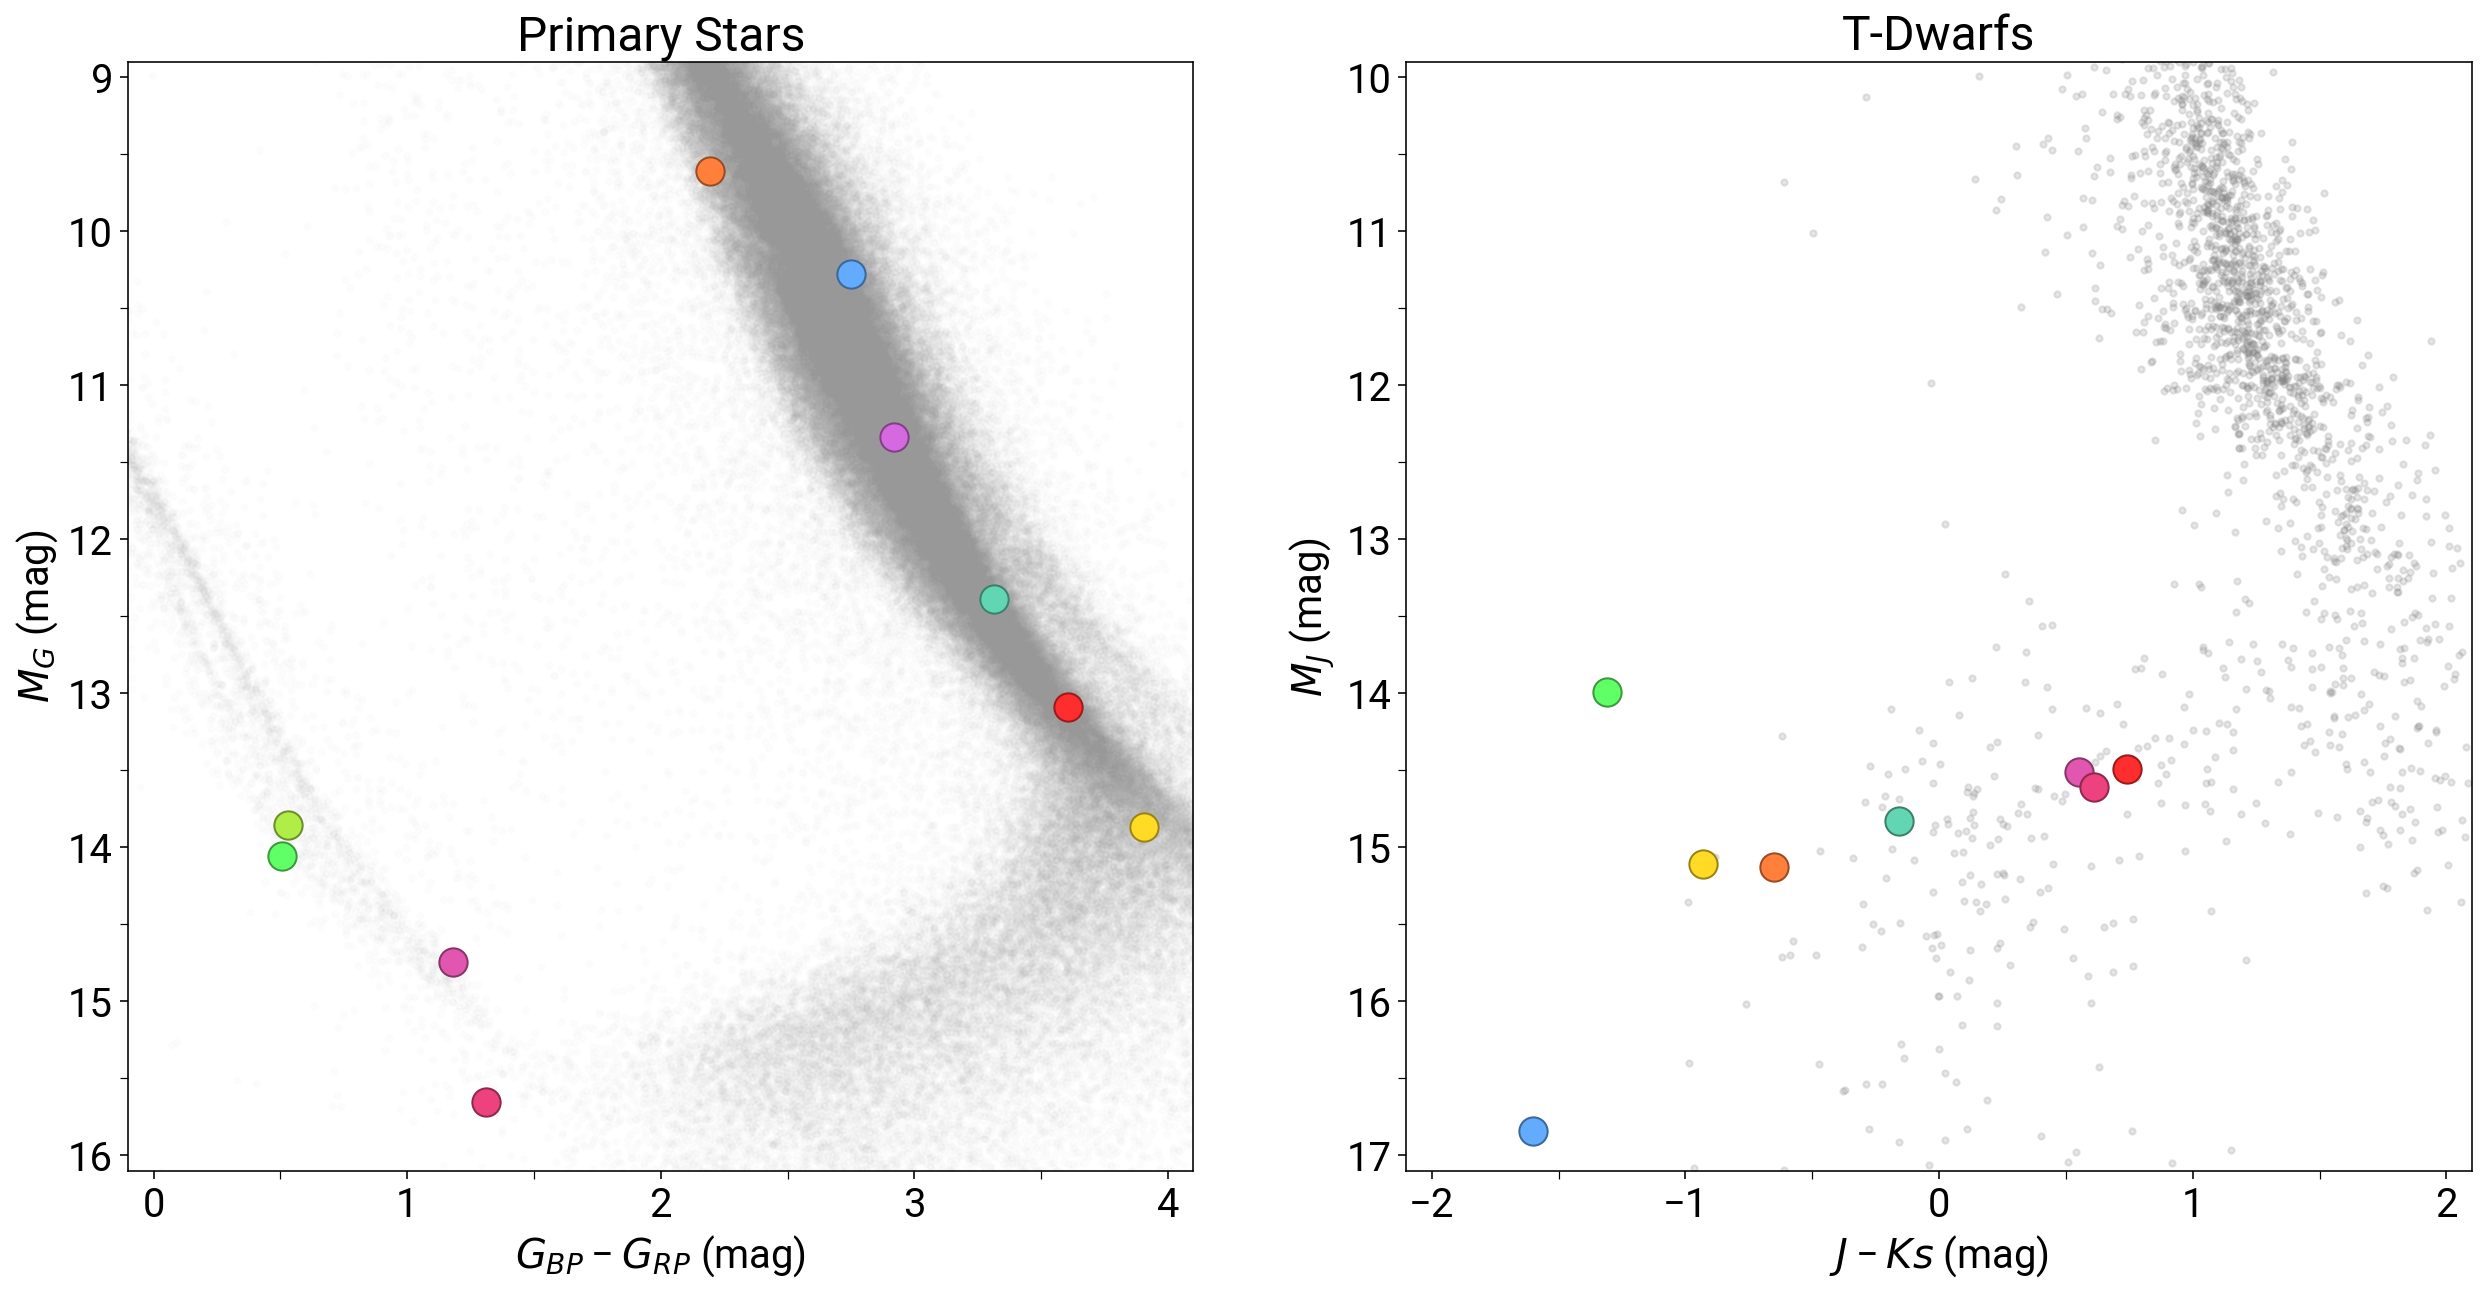
Our sample consists of ten pairs of T-dwarfs and Gaia primary stars, eight of which are previously undiscovered binaries. Four of the primary stars are white dwarfs, leading to better-constrained upper limits on the ages of these systems. A summary of the key properties of the primary stars can be seen in the table below; values are taken from Gaia DR3 and Gentille Fusillo et al. 2021.

By assuming the co-evolution of the binaries in our sample, we can use the primaries' properties to infer the properties of the T-dwarfs. Since some of the primaries are white dwarfs, their companion T-dwarfs have well-constrained ages, thus we will be able to break the age-mass-temperature degeneracy and create a set of well-constrained benchmark T-dwarfs in wide binary systems.

Colour-magnitude diagrams showing the positions of the primary stars and T-dwarfs in relation to the main sequence. Left panel: primary stars on a CMD of Gaia absolute G-band magintude against BP-RP colour, while grey background points are stars from GCNS. Right panel: T-dwarfs on a CMD of 2MASS absolute J-band magnitude against J-Ks colour, grey points are UCDs taken from the UltracoolSheet.

Candidate Selection

In order to select the potential primary stars for our sample, we first applied a parallax limit of 5 mas (corresponding to a distance of 200 pc, where a typical T5-type brown dwarf will have a J-band magnitude of ~20 mag). This parallax limit means that none of the primaries in our sample will be too distant for a T-dwarf companion to be detected. We also applied a minimum proper motion criterium: requiring a total proper motion >50 mas yr⁻¹ ensures that the proper motion of any companion T-dwarfs can be measured over the available VHS/DES baselines.

To create our sample of T-dwarf candidates, we used a 6 arcsec radius to match VHS and DES sources and applied a series of photometric cuts:

  1. MJ > 13.5 (companion at distance of primary)
  2. J > 12 (brightness limit to avoid saturdated sources)
  3. Jerr < 0.1551 (7σ detection)
  4. J−H and J−Ks < 0.1 (or non-detections in H and Ks-bands)
  5. yerr and zerr < 0.217 (5σ detection)
  6. i−z > 1 (select L and T-dwarfs)
  7. z−y > 0.5 (remove L-dwarfs)
  8. y−J > 1.8 (select L and T-dwarfs)
  9. g−J > 4 (or g-band non-detection)
  10. r−J > 3 (or r-band non-detection)
  11. J−W2 > 1.6 (remove M-dwarfs)
  12. W1−W2 > 1.4 (remove M and early T-dwarfs)

We matched the Gaia stars with the T-dwarf candidates using a 1° match radius. Any pairs with projected separations >20000 AU were discarded, since they are unlikely to be true binaries. We also required the binary components to have common proper motion directions: we calculated the T-dwarf proper motion directions using CatWISE2020, VHS and DES data, and rejected any pairs where the primary and T-dwarf have opposing proper motions directions.

The final part of our candidate selection process was to apply angular distance and positional angle requirements (>0.4 arcsec and ±0.6 arcsec, respectively), and to use CatWISE2020 colours to reject any candidate brown dwarfs which are unlikely to be mid-late T-dwarfs (any CatWISE2020 non-detections were retained in the sample).

Photometric Spectral Types

The spectral types of each of the 91 T-dwarfs were classfied photometrically using the method outlined by Skrzypek et al. 2015. We adapted the method to use the photometry of VHS and DES, as well as creating our own template of colours based on the UltracoolSheet (Best et al. 2024).

By measuring the flux of each T-dwarf in the most recent VHS and DES epochs, we were able to calculate their magnitudes in each of the available bands. This photometry was used to determine the spectral type for each of the T-dwarfs.

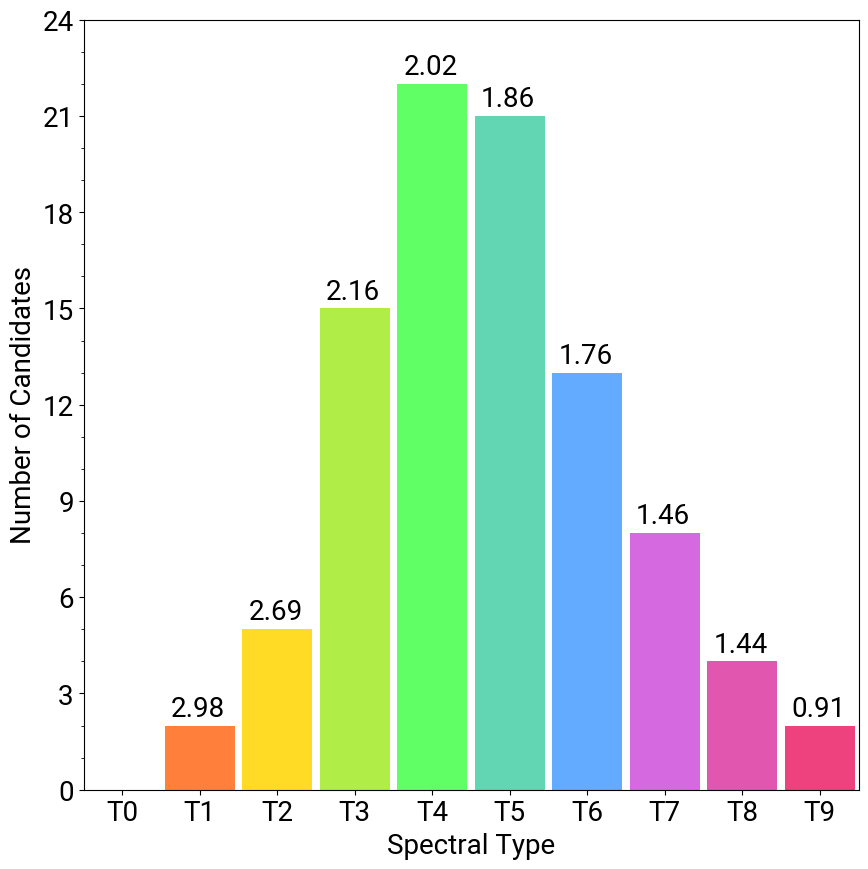
The plot below shows the distribution of the best-fitting spectral types for the T-dwarf candidates, with the mean error for each spectral type shown above the corresponding bar. Errors are calculated for each object by fitting a polynomial to the chi-squared values and finding the difference between the best-fitting spectral type and the spectral type corresponding to a chi-squared value of χ²ₘᵢₙ+1.0 and adding 1 sub-type to account for systematic errors through the template creation and chi-squared fitting processes.

Distribution of best-fitting spectral types for the T-dwarf candidates, determined using the minimised χ² method. Mean errors for each spectral type are shown above the corresponding bars.

Follow-Up With FourStar

We used the FourStar near-infrared camera on the 6.5m Magellan Baade telescope at the Las Campanas Observatory in Chile to obtain new NIR images of the T-dwarfs in the J-band, extending our baseline for measuring proper motions by up to eight years.

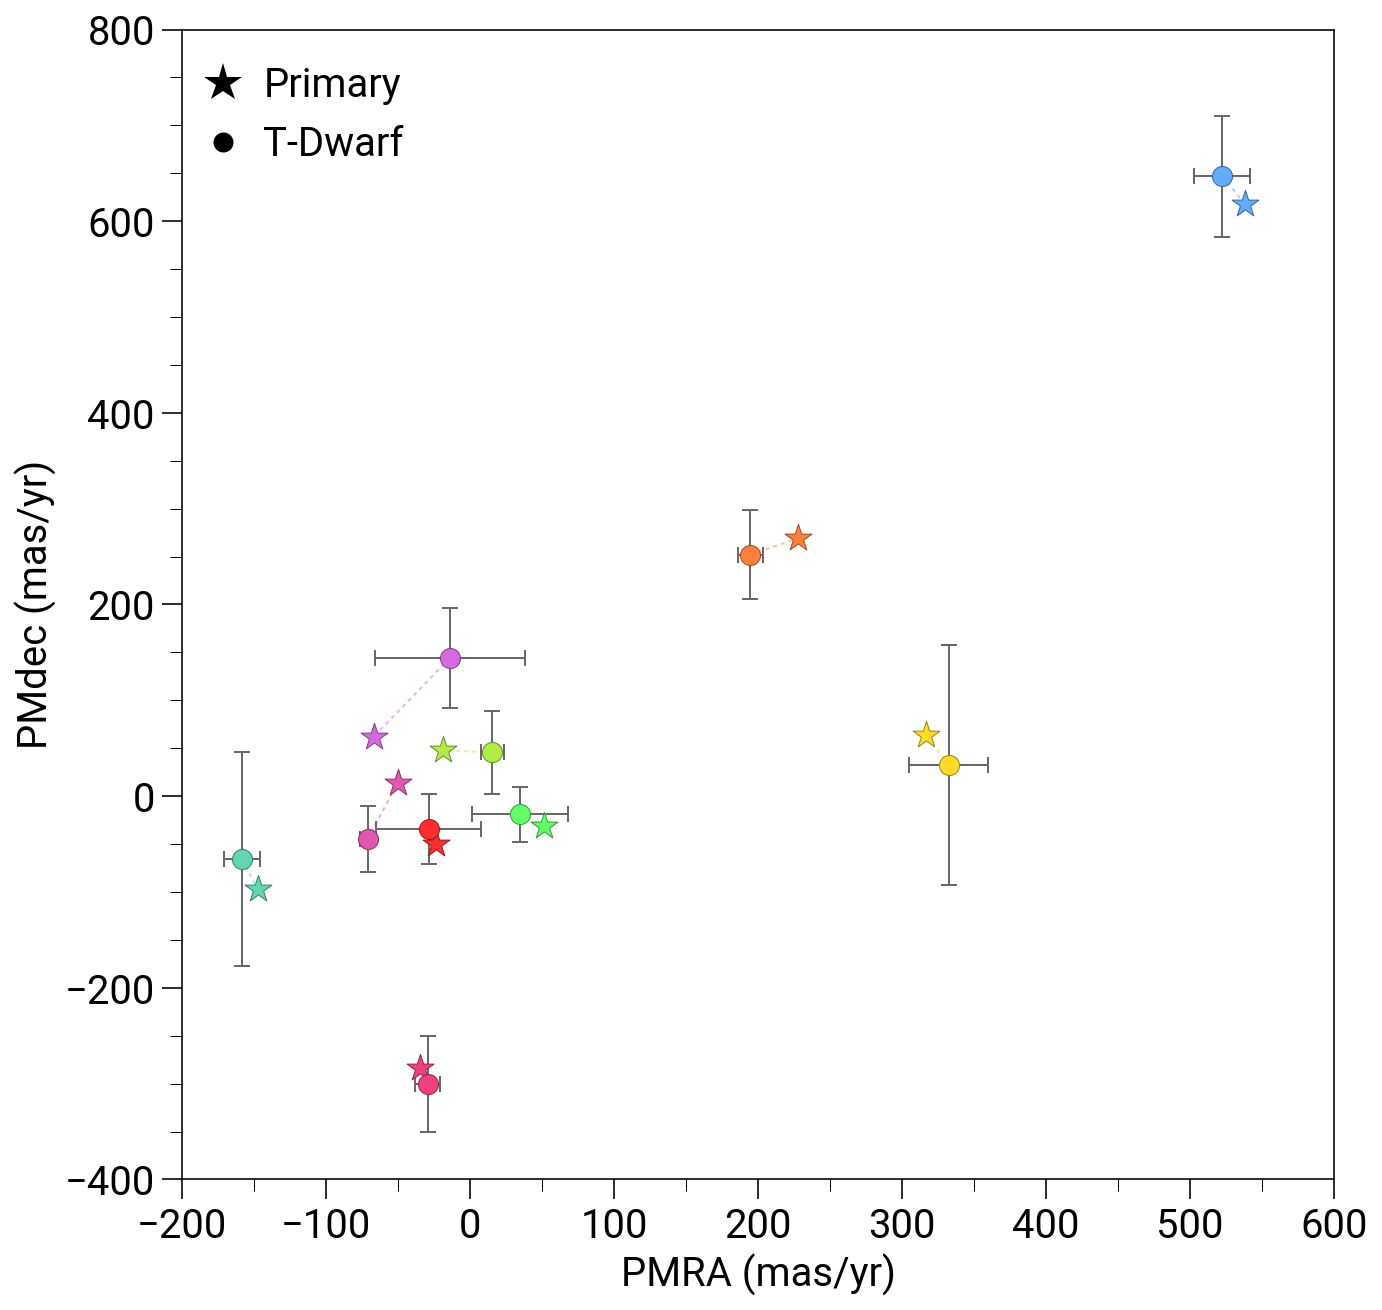
These new J-band epochs allowed us to refine our T-dwarf proper motion measurements, as well as adding the ability to calculate the associated proper motion uncertainties. Using these updated proper motion values, we compared the proper motion of each T-dwarf candidate to that of its associated Gaia primary's proper motion. We reject pairs without common proper motions, accounting for the new uncertainties on the T-dwarf candidate proper motions, which results in 13 potential companion pairs with common proper motions.

With the updated proper motion measurements, we were able to calculate false alarm probabilities for each of the T-dwarfs:

P(H|E) = \frac{P(H) P(E|H)}{P(H) P(E|H) + P(\neg H) P(E|\neg H)}

The likelihood function, P(E|H), was calculated as the probability of the pair being a line-of-sight association, with E being the parameter space of the T-dwarf and H being the hypothesis that the pair is a false positive.

P(¬H) is a constant: it is the probability that a pair is not a false positive, based on the observed binary fraction of Bardalez Gagliuffi et al. 2019 and the expected number of T-dwarfs within 1° of any given Gaia star. P(H) is simply calculated as 1−P(¬H), since it represents the probability that the pair is a false positive.

The final term in the false alarm probability equation is P(E|¬H), which is set to 1.0, since it represents the probability of a T-dwarf being within the parameter space of the candidate T-dwarf given that it is a true companion.

Applying a threshold false alarm probability value of 0.001 results in ten pairs, and, as would be expected, all of these ten pairs have common proper motion, thus we consider them to be true companion pairs.

Vector-point diagram showing the measured proper motions of T-dwarf in our sample, alongside their associated Gaia primary stars (binary pairs are matched by colour). 1σ error bars are plotted for the T-dwarf proper motion measurements.

Follow-Up With FIRE

In addition to the FourStar observations, we used the FIRE spectroscopic instrument to obtain near-infrared spectra of the T-dwarfs with the lowest likelihood values. These spectroscopic observations allowed for the verification of the photometrically-classified spectral types, ensuring that the photometric spectral classifications are reliable.

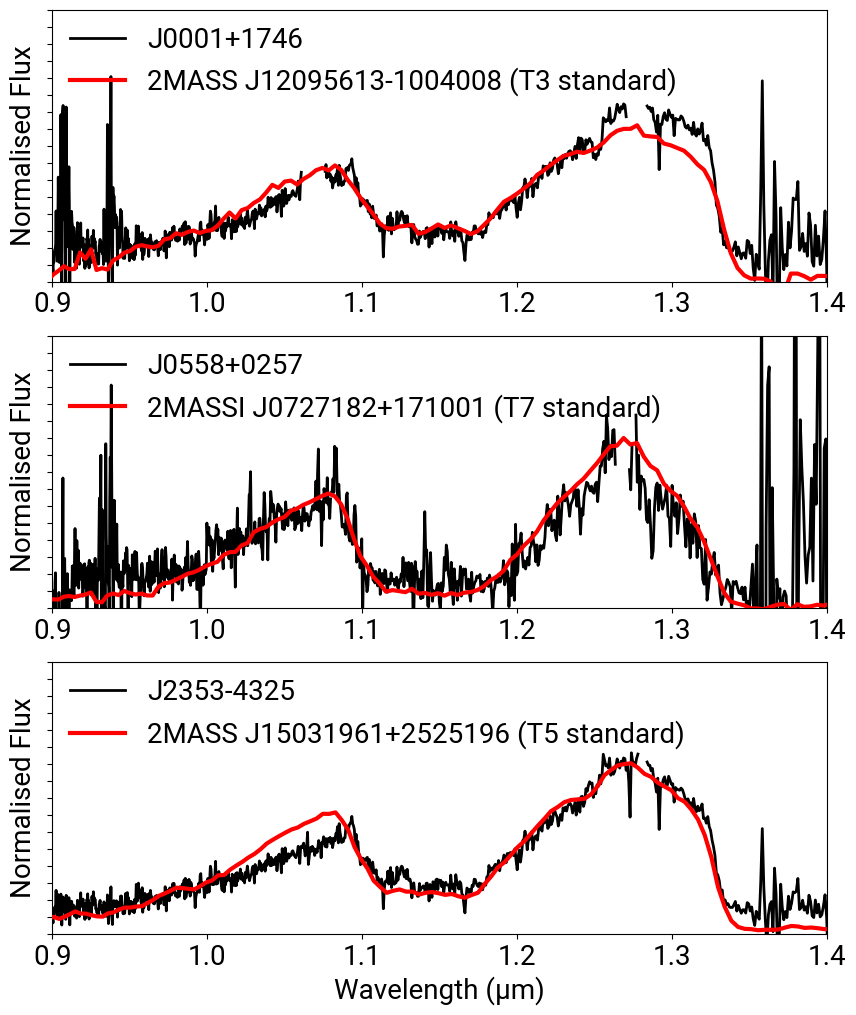
We used the SPLAT package for Python to spectroscopically classify the spectral types of each of the T-dwarfs observed with FIRE, following the method of Kirkpatrick et al. 2010 by fitting to wavelengths 0.9−1.4μm (where our spectra have best signal-to-noise ratios). By calculating chi-squared fits for each standard spectrum in the SpeX Prism Libraries, SPLAT finds the best-fitting spectral type for each T-dwarf and its associated uncertainty.

The spectroscopically-determined classifications for each T-dwarf like within the ranges of those determined photometrically, supporting our use of photometry to classify the spectral types of the T-dwarfs. We take the adopted spectral classifications for the T-dwarfs observed with FIRE to be the weighted mean of the spectroscopic classifications, and the associated error as the standard error of the weighted mean.

T-dwarf spectra obtained with the FIRE instrument (black) and the best-fitting standard spectra from the SpeX Prism Libraries (red). Spectra are normalised at 1.27μm.