A “deep” look at Mira light-curves: Mira classification with CNN

Michele Trabucchi 1,3 , Giuliano Iorio 1,2,3

  • 1 University of Padova, Department of Physics and Astronomy, Padova
  • 2 Institut de Ciències del Cosmos de la Universitat de Barcelona, Barcelona
  • 3 INAF Padova Astronomical Observatory, Padova

Abstract

Mira variables are pulsating stars displaying periodic photometric and radial-velocity variations on timescales of order of months. They represent the final evolutionary stage of low- to intermediate-mass stars, and understanding their variability is critical to several applications, from constraining stellar models to characterizing the stellar-wind-mediated injection of nucleosynthesis products in the interstellar medium. Moreover, Mira variables follow a period-luminosity relation which is a promising distance indicator, possibly key to alleviate the Hubble tension.
Mira variables occur in two types, oxygen- and carbon-rich, depending on the relative abundance of these two elements at their surface. They have drastically different photometric and spectroscopic features, and any astrophysical application of these stars requires being able to accurately classify their chemical type. Customarily, this can either be done by spectroscopy, or by combining optical and near-infrared photometry. Both approaches have severe limitations, as the former can only be applied to limited samples of stars, and the latter relies on multi-epoch observations with wide spectral coverage, typically requiring multiple observational facilities.
Currently, a wealth of multi-epoch photometric observations of Miras exists at optical wavelengths, with data availability expected to increase exponentially due to ongoing and upcoming time-domain observational surveys. We explored the potential of using machine learning and deep learning algorithms to classify O- and C-rich Miras based on single-band photometric time series. Specifically, we considered several algorithms: Random Forest, XGBoost, and Support Vector Machine, applied to features extracted from Mira light curves using Fourier decomposition, as well as a Convolutional Neural Network (CNN) trained directly on 2D “images” generated from Mira light curves in the phase-magnitude plane. To the best of our knowledge, this is the first application of this method (typically used to classify photographs based on their content) to the characterization of highly-evolved pulsating stars.
Interestingly, the CNN method outperformed all the others. In particular, it demonstrated the ability to correctly classify cases that fall within regions of overlap when analyzed using traditional diagnostic plots based on Fourier decomposition features. We also conducted a preliminary interpretability analysis of the CNN results by identifying the parts of the light curves that most influence the classification process. These initial findings are especially promising, as they could help us uncover new features in light curves associated with the chemical composition of the stars. This is a promising example of how deep learning methods can not only enhance classification tasks on astrophysics datasets but also contribute to a deeper understanding of the underlying physics.

Context

Miras are pulsating asymptotic giant branch (AGB) stars, with periods of 80 to 1000 days and amplitudes over 2.5 visual magnitudes. They experience envelope mixing events that enrich their surface composition in nucleosynthesis products, possibly turning them into carbon stars.

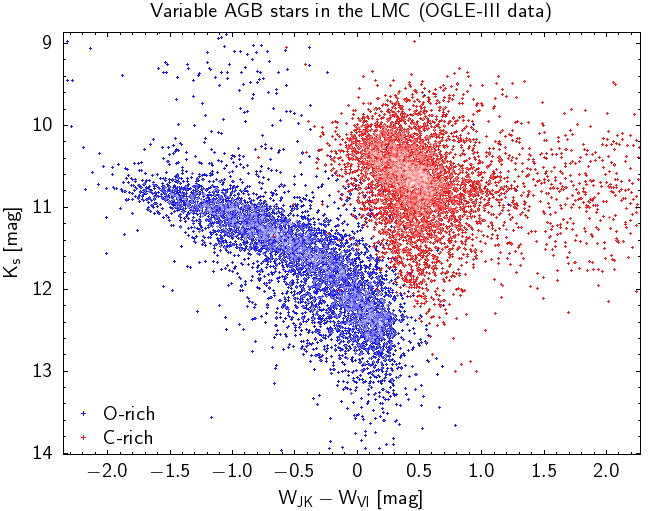
Distinguishing between O-/C-rich Miras is crucial for their application as distance and age indicators (Huang et al., 2024; Trabucchi & Mowlavi, 2022). This relies either on demanding spectroscopic observations, or on approximate multi-band photometric methods.

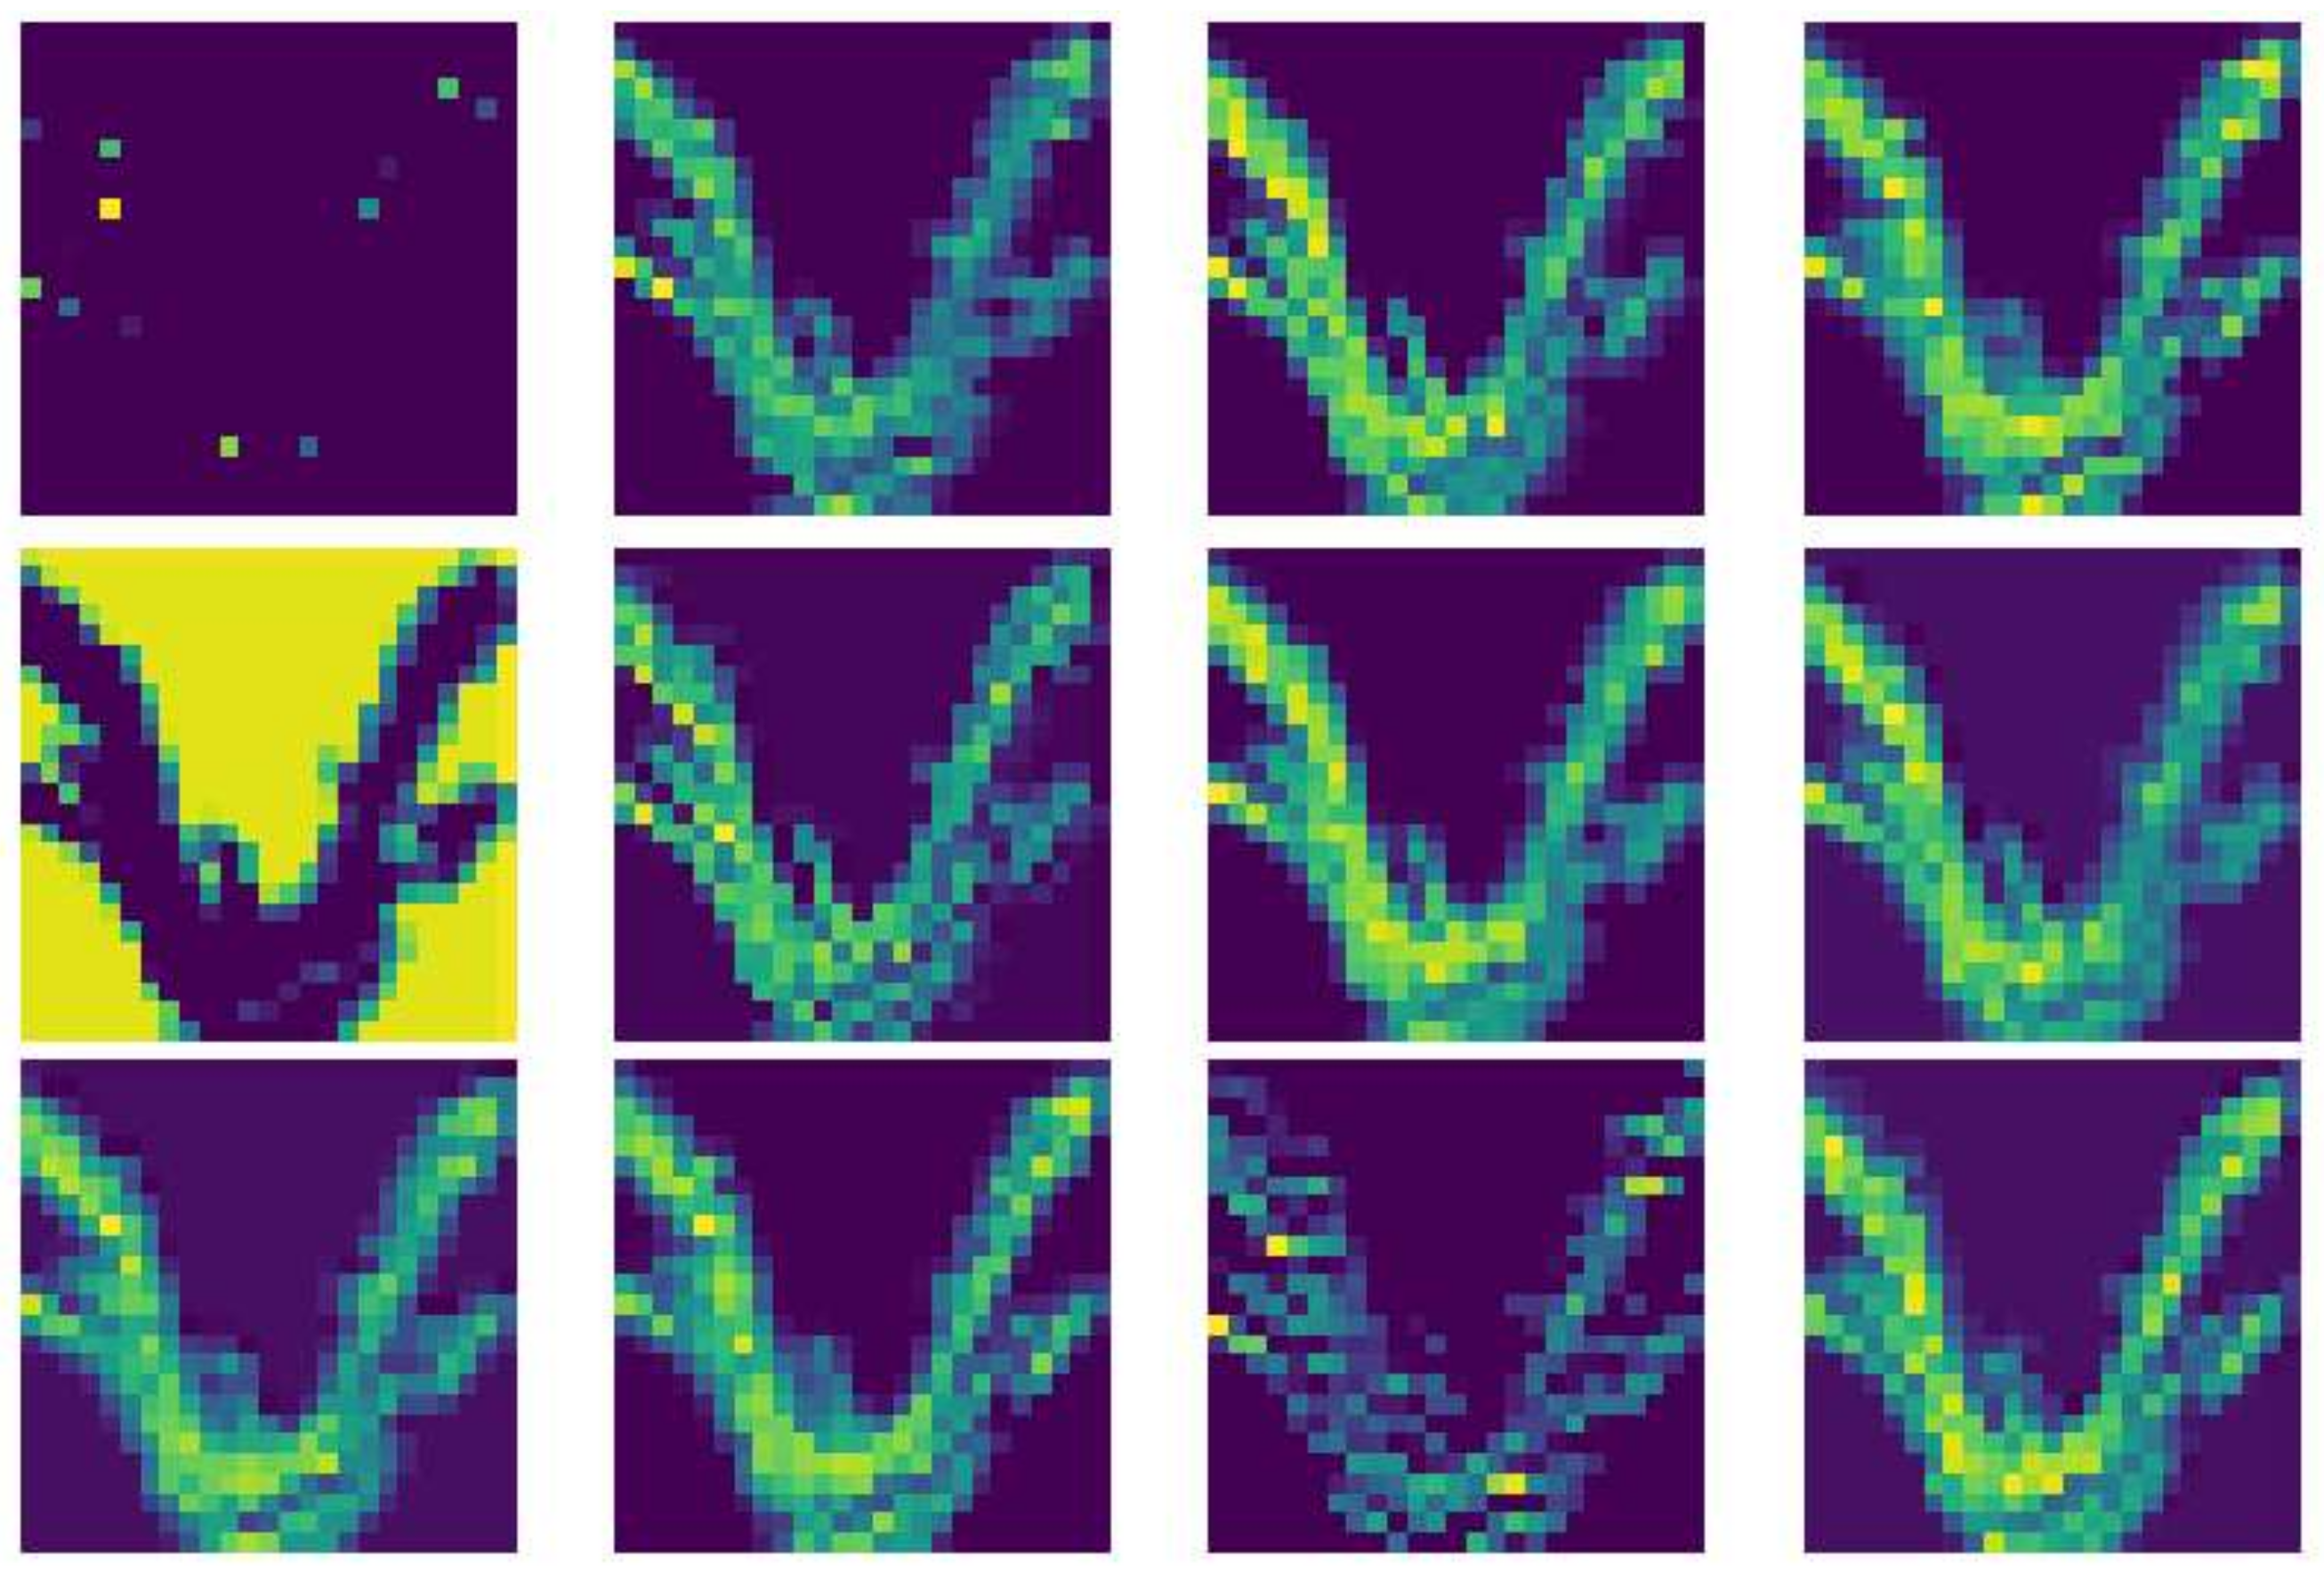
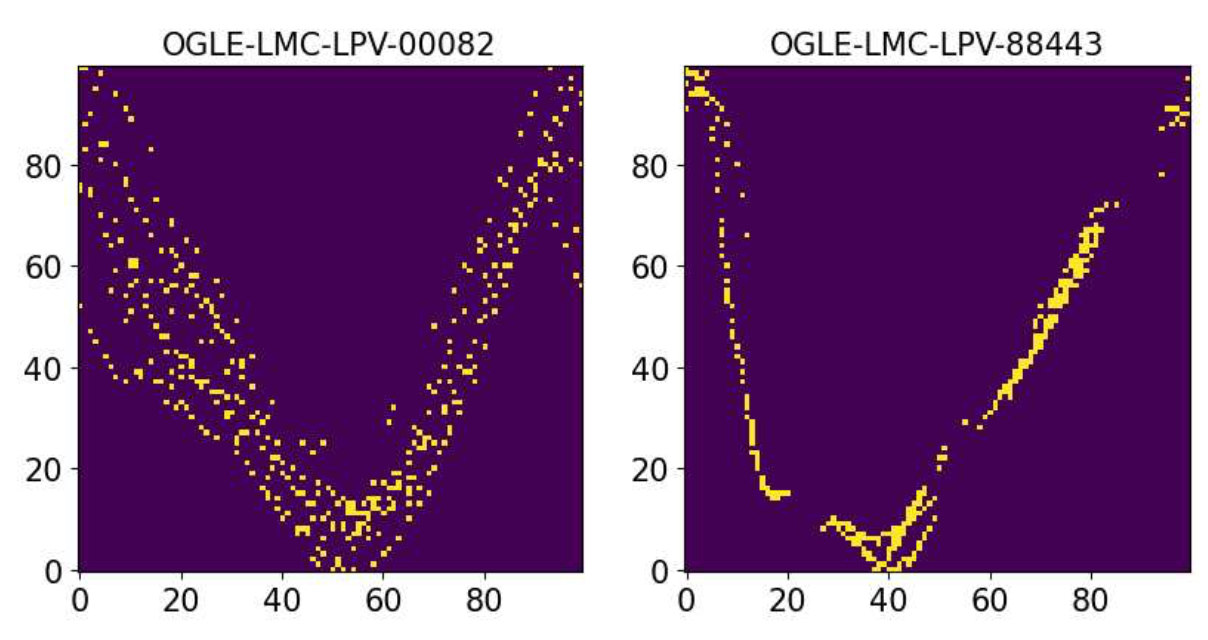
A supervised learning approach may efficiently classify O-/C-rich Miras using only single-band photometry. We test this with I−band light curves of Magellanic Clouds Miras observed by OGLE-III (Soszyński et al., 2009).

TP-AGB

• H- and He-burning shells

• Unstable He-burning shell: thermal pulses (TP)

• TPs can trigger dredge-up convective mixing events

• Surface composition enriched in carbon = altered photometric and spectroscopic features

• Photometric distinction of O-rich vs. C-rich AGBs requires 2 optical + 2 NIR filters (Fig. 1, see Lebzelter et al., 2018), with limited applicability

• Spectroscopic classification not always available, only bright sources

Fig. 1 - A suitable combination of optical and NIR photometry allows for convenient distinction between O- and C-rich AGB stars, but this is only possible under specific conditions.

Methods

• We implement a convolutional neural network (CNN) applied to the folded Mira light curve in the I-band to classify C-rich and O-rich types.

• To serve as CNN input the Mira light curves are converted into a 100×100 2-bit image, where each pixel is set to 1 if at least one data point falls into the bin, and 0 otherwise (Fig. 2).

• For comparison purposes, we tested alternative classifiers (Random Forest, XGBoost, and Support Vector Machine) applied to summary static of the light curves associated with their Fourier decomposition (e.g. periods, amplitude).

Results & Conclusions

• The CNN classification outperforms all other tested algorithms both in terms of accuracy and recall (>90% for the LMC test set, >90% for the SMC), especially in generalization to unseen data (e.g. trained on LMC and tested on SMC), where other methods perform no better than random classifiers.

• This higher generalization suggests that the CNN has learned actual patterns in the light curves rather than overfitting training data. For example, it is the only method able to correctly classify C-rich Miras with long periods and small amplitudes (Fig. 3).

• The presence of additional information in the light curves was not expected. Through interpretability analysis (Fig. 4), we aim to identify which features of the light curve encode this information and link them to physical properties.

This analysis shows how deep neural networks not only improve classification in astrophysical datasets but, despite being often considered black boxes, can also guide us toward additional physical insights and potentially lead to new discoveries.

Fig. 3 - Period-Amplitude plane for the Miras in the Large (top) and Small (bottom) Magellanic Clouds. The blue and red dots show the stars correctly classified as O-rich or C-rich by the CNN. The green and and yellow circles highlight the misclassified O-rich and C-rich, respectively.

Fig. 4 - Example of a folded Mira light curve color-coded by the neural activations in the third convolutional layer of the CNN. Each panel shows the output of a different filter.

Heading…

Fig. 2 - Examples of three folded Mira light curves converted to 2d bit images.