.png)
Generally, energy equipartition refers to the exchange of energy due to gravitational encounters that bring more massive stars to a lower speed, while less massive ones result faster. Thus, the equipartition concerns the kinetic energy and is associated with the efficiency of the relaxation process. As a consequence, it depends on the radial position thus must be considered as local rather than global.
Thanks to N-body simulations, we have several indications on the efficiency of such a process and its relation with structural and internal properties (Trenti & van der Marel 2013; Webb & Vesperini 2017; Pavlík & Vesperini 2021, 2022). One of the most important results is the Bianchini et al. (2016) fitting function for the velocity dispersion dependence on stellar mass \(\boldsymbol{\sigma(m)}\), obtained in the inner regions of simulated clusters. The relation measures the degree of kinetic energy equipartition through the equipartition mass \(\mathbf{m_\mathrm{eq}}\), showing that more massive stars are closer to equipartition and only those with \(m > m_\mathrm{eq}\) reached the complete equipartition limit \(\sigma(m) \propto m^{-1/2}\).
Dynamical model
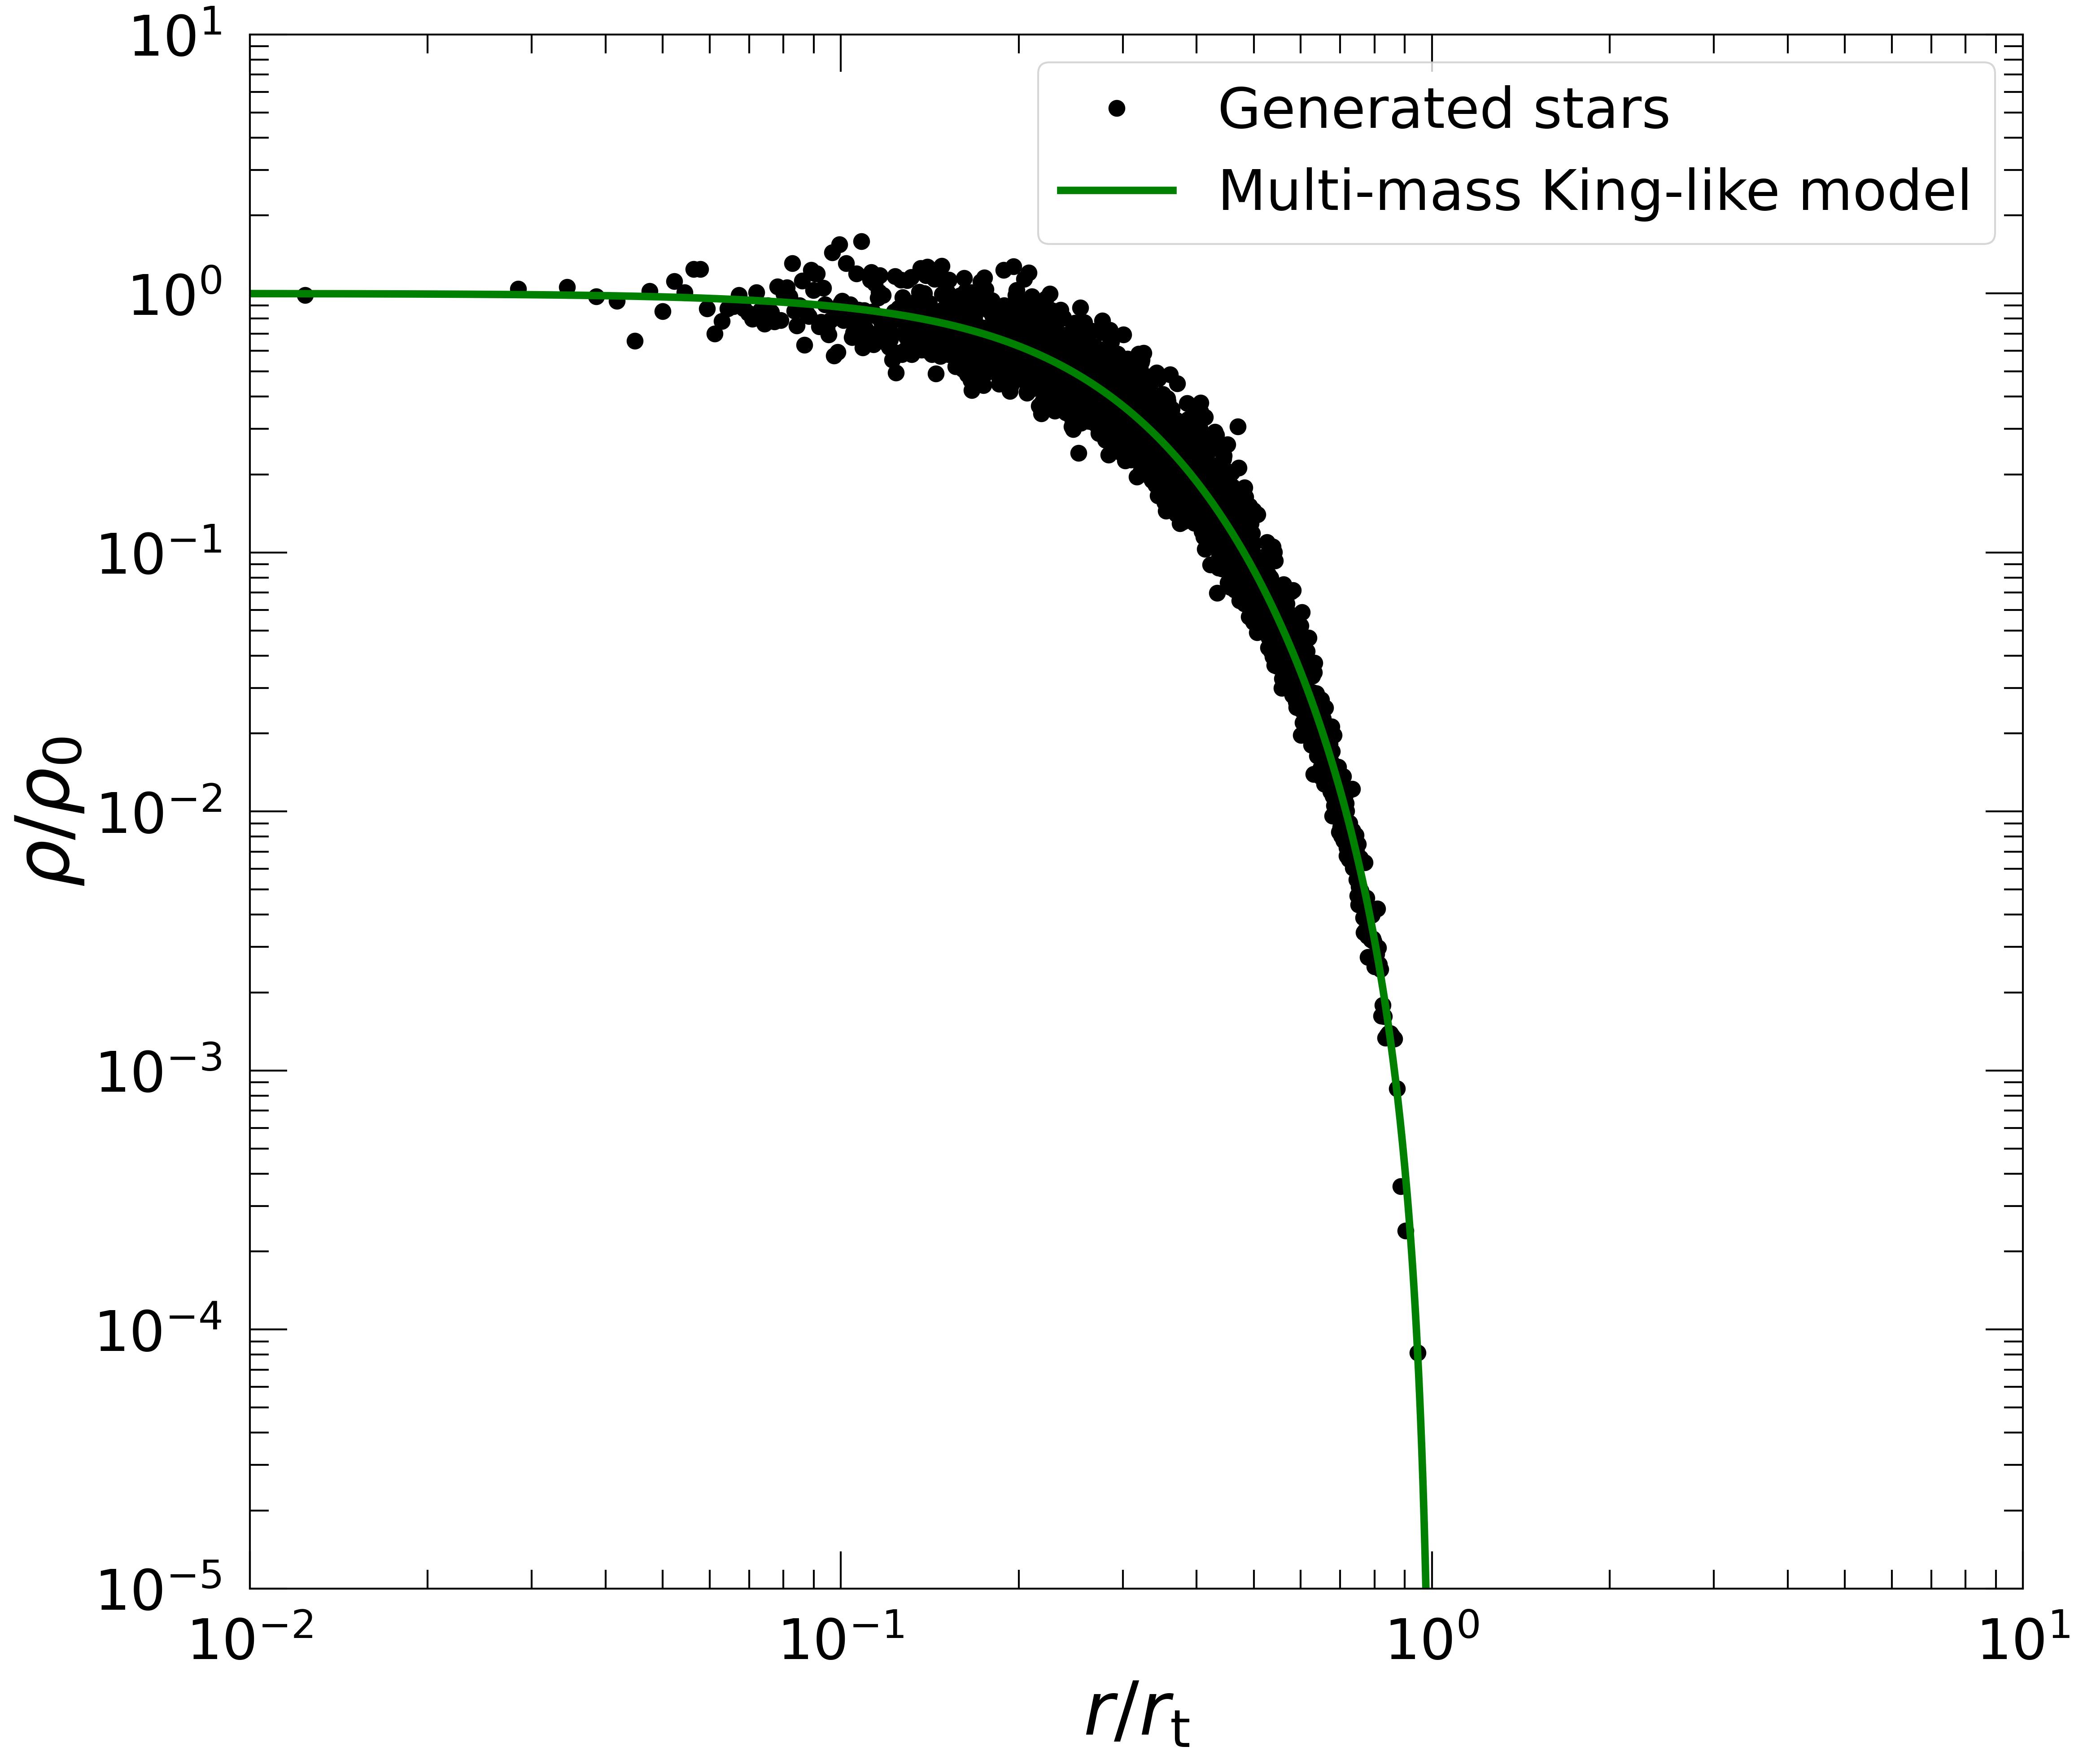
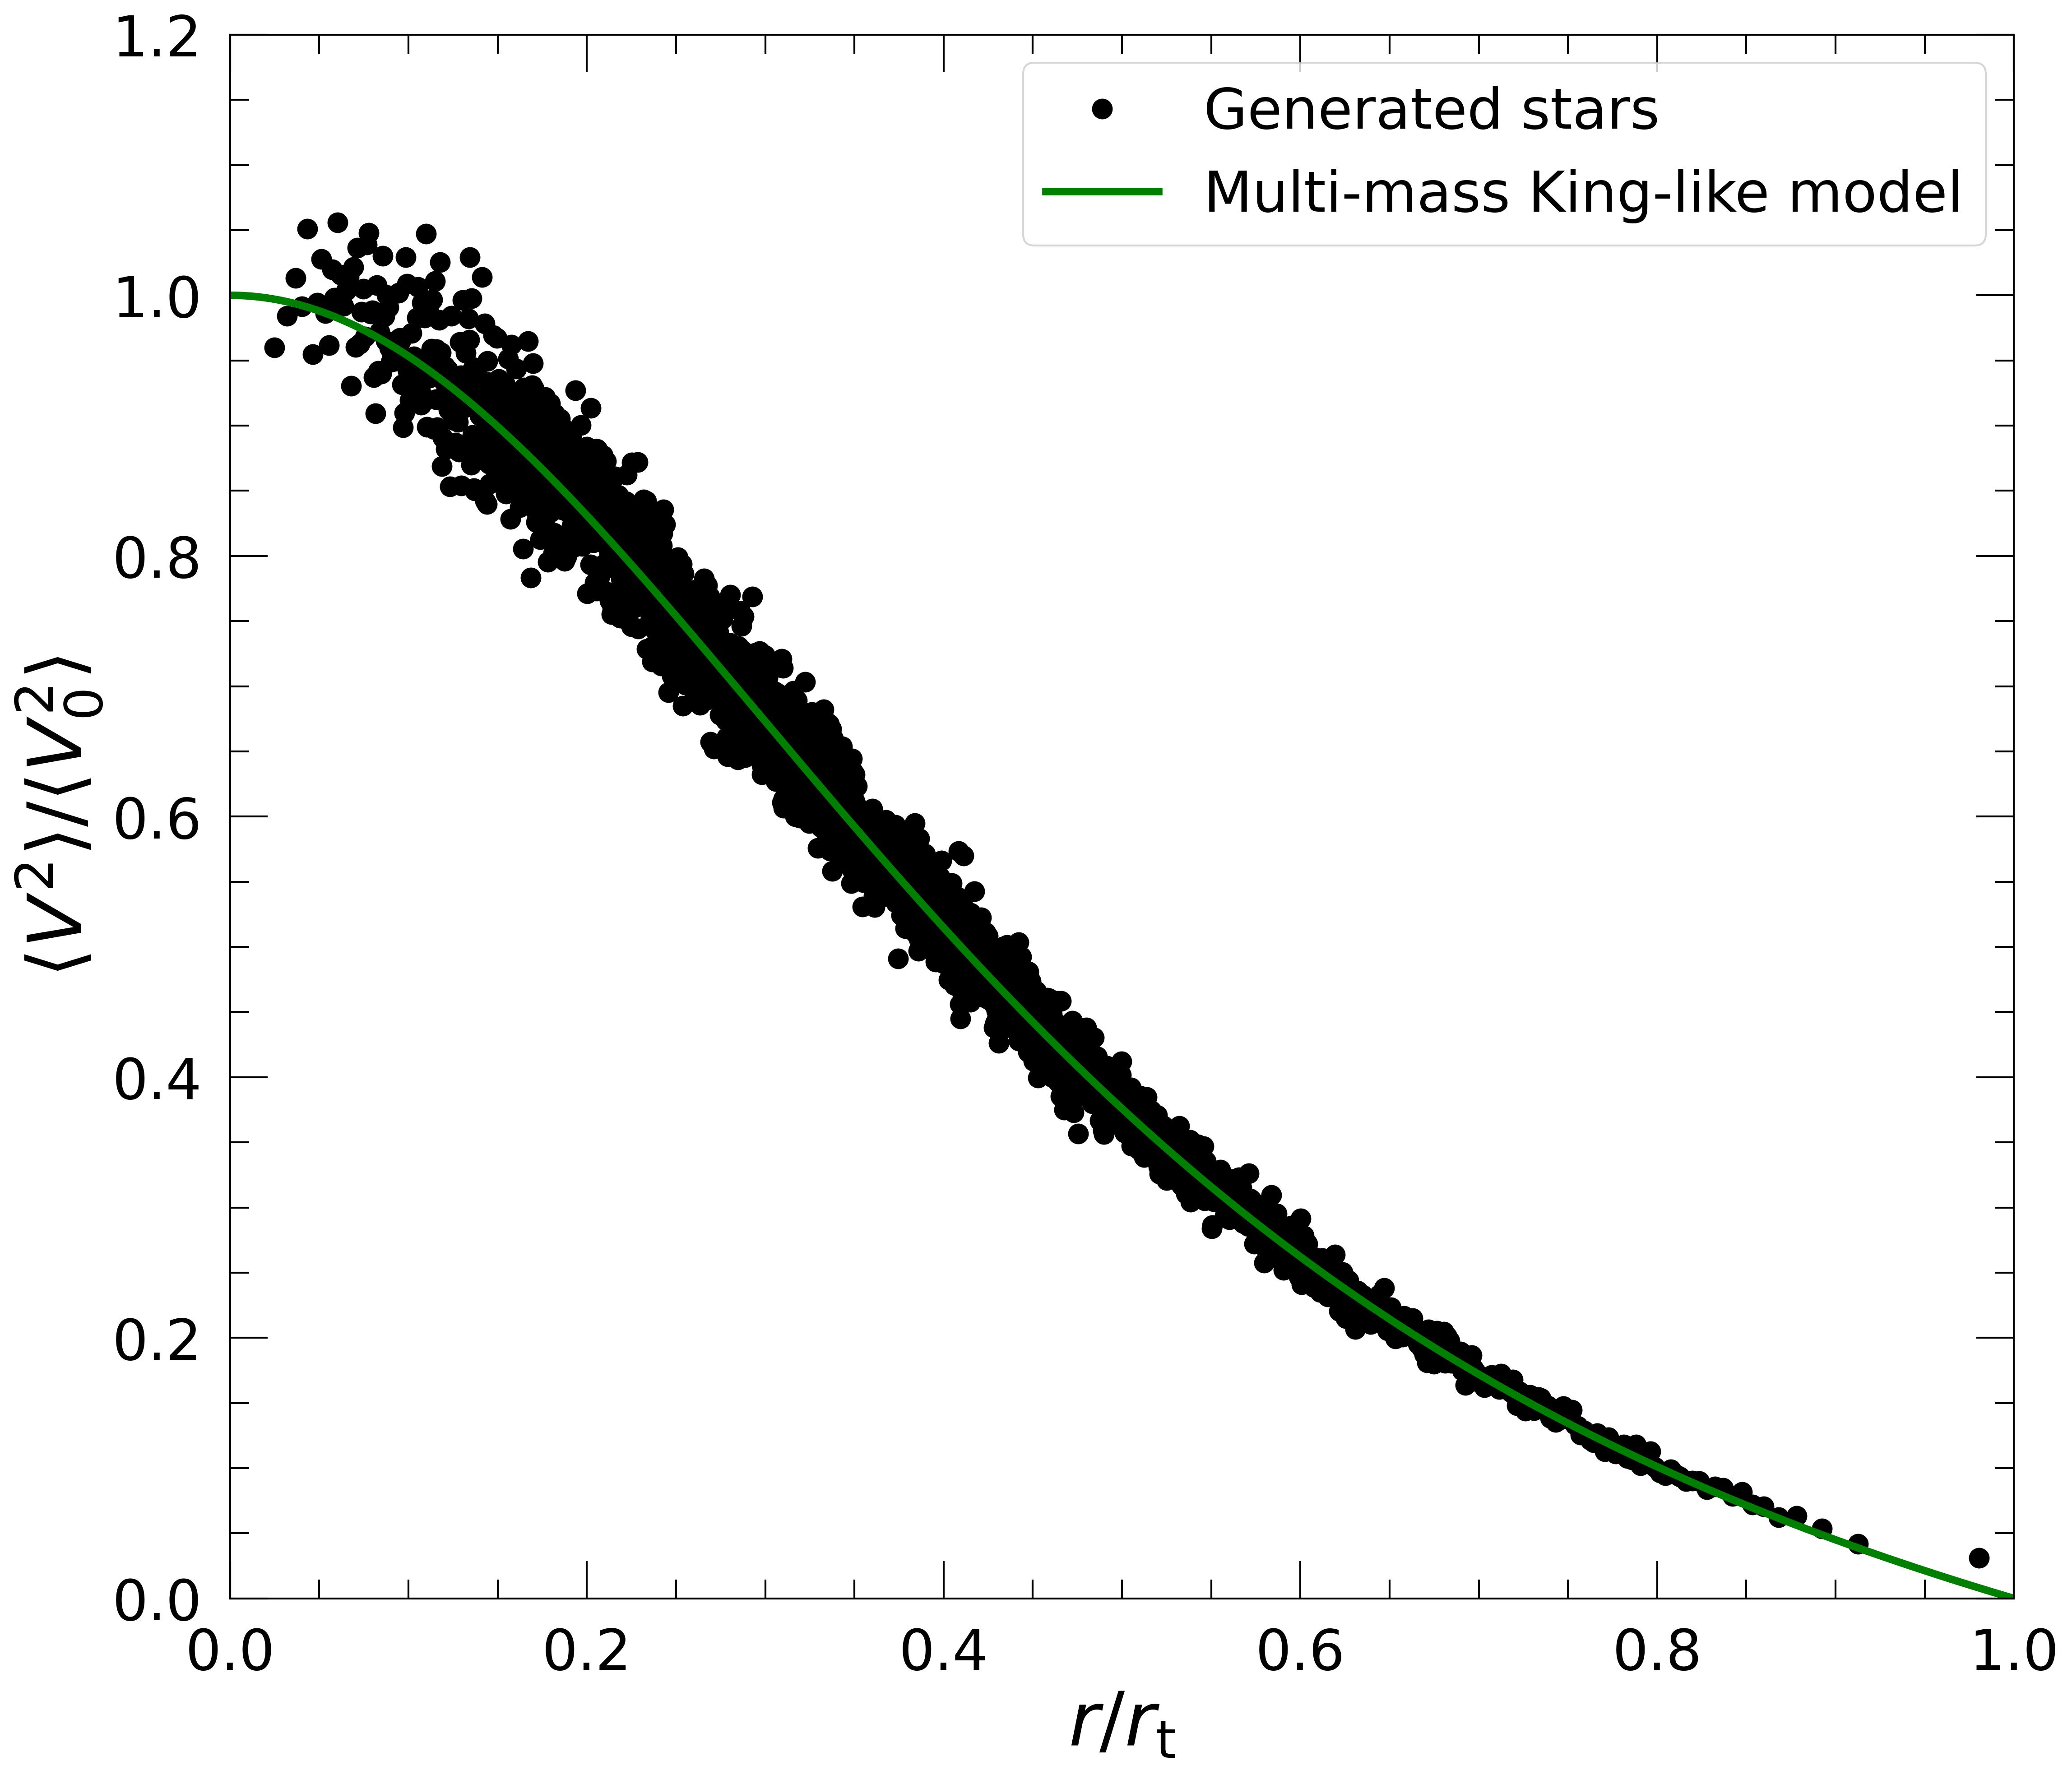
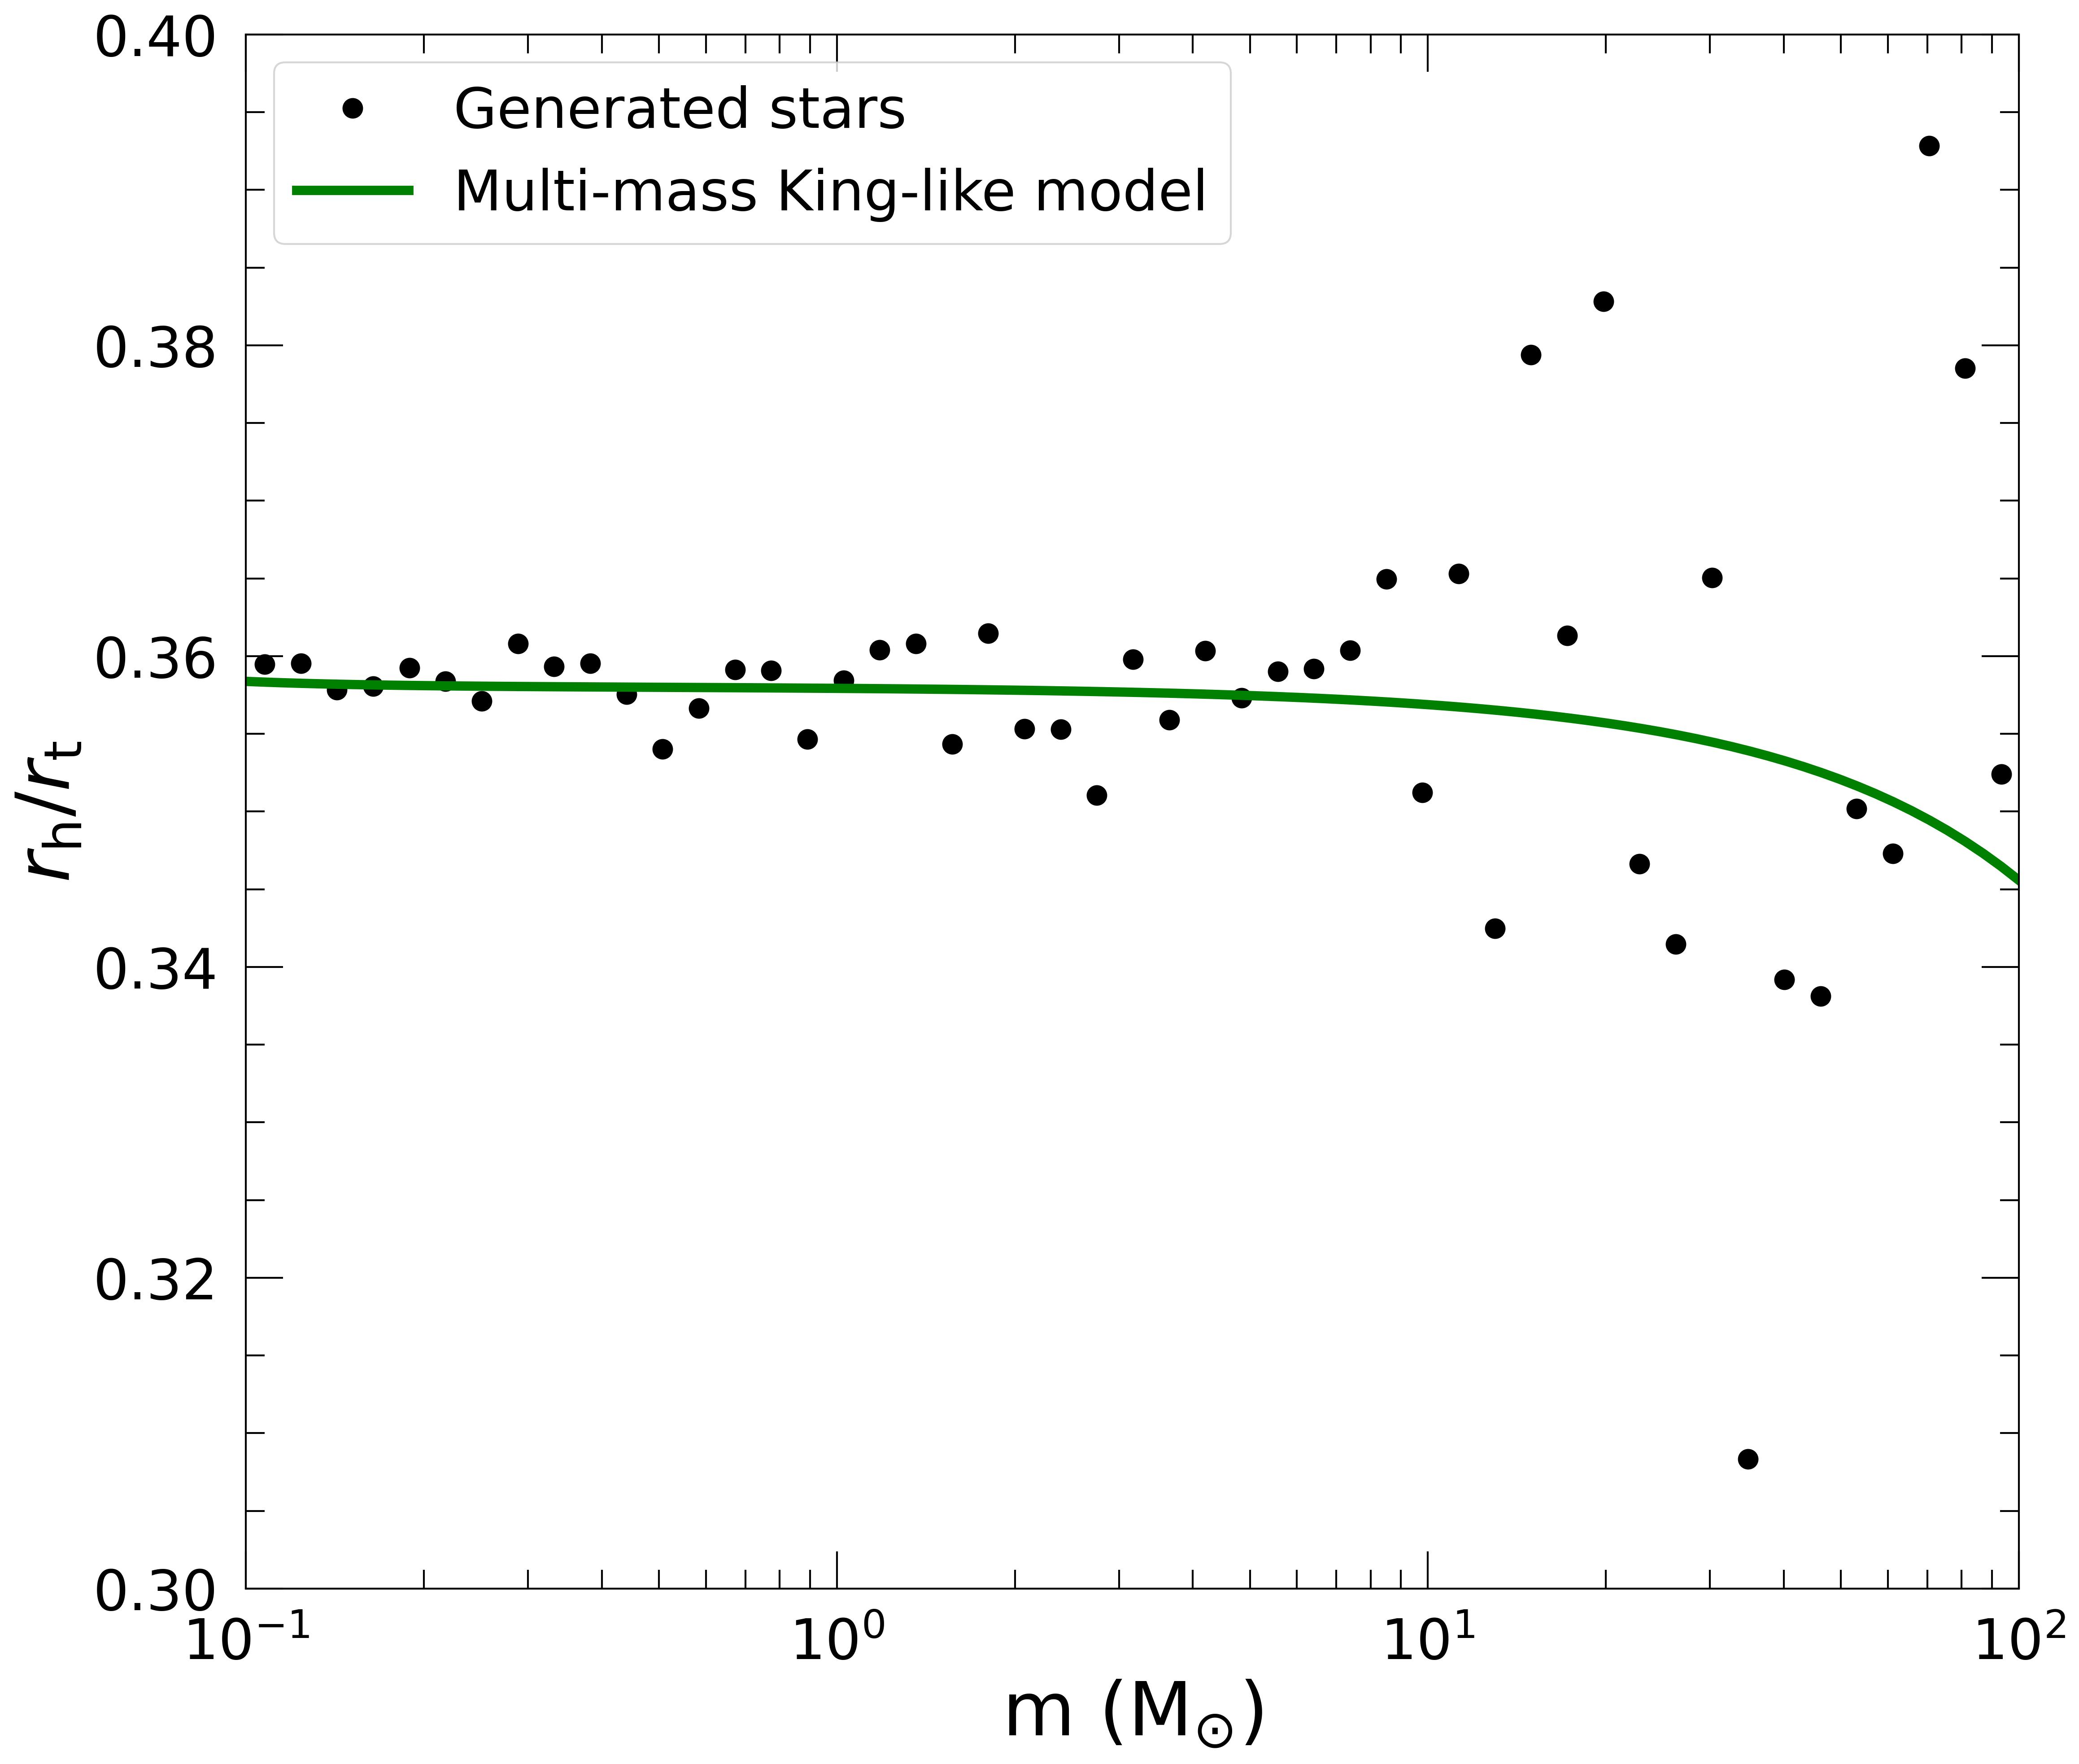
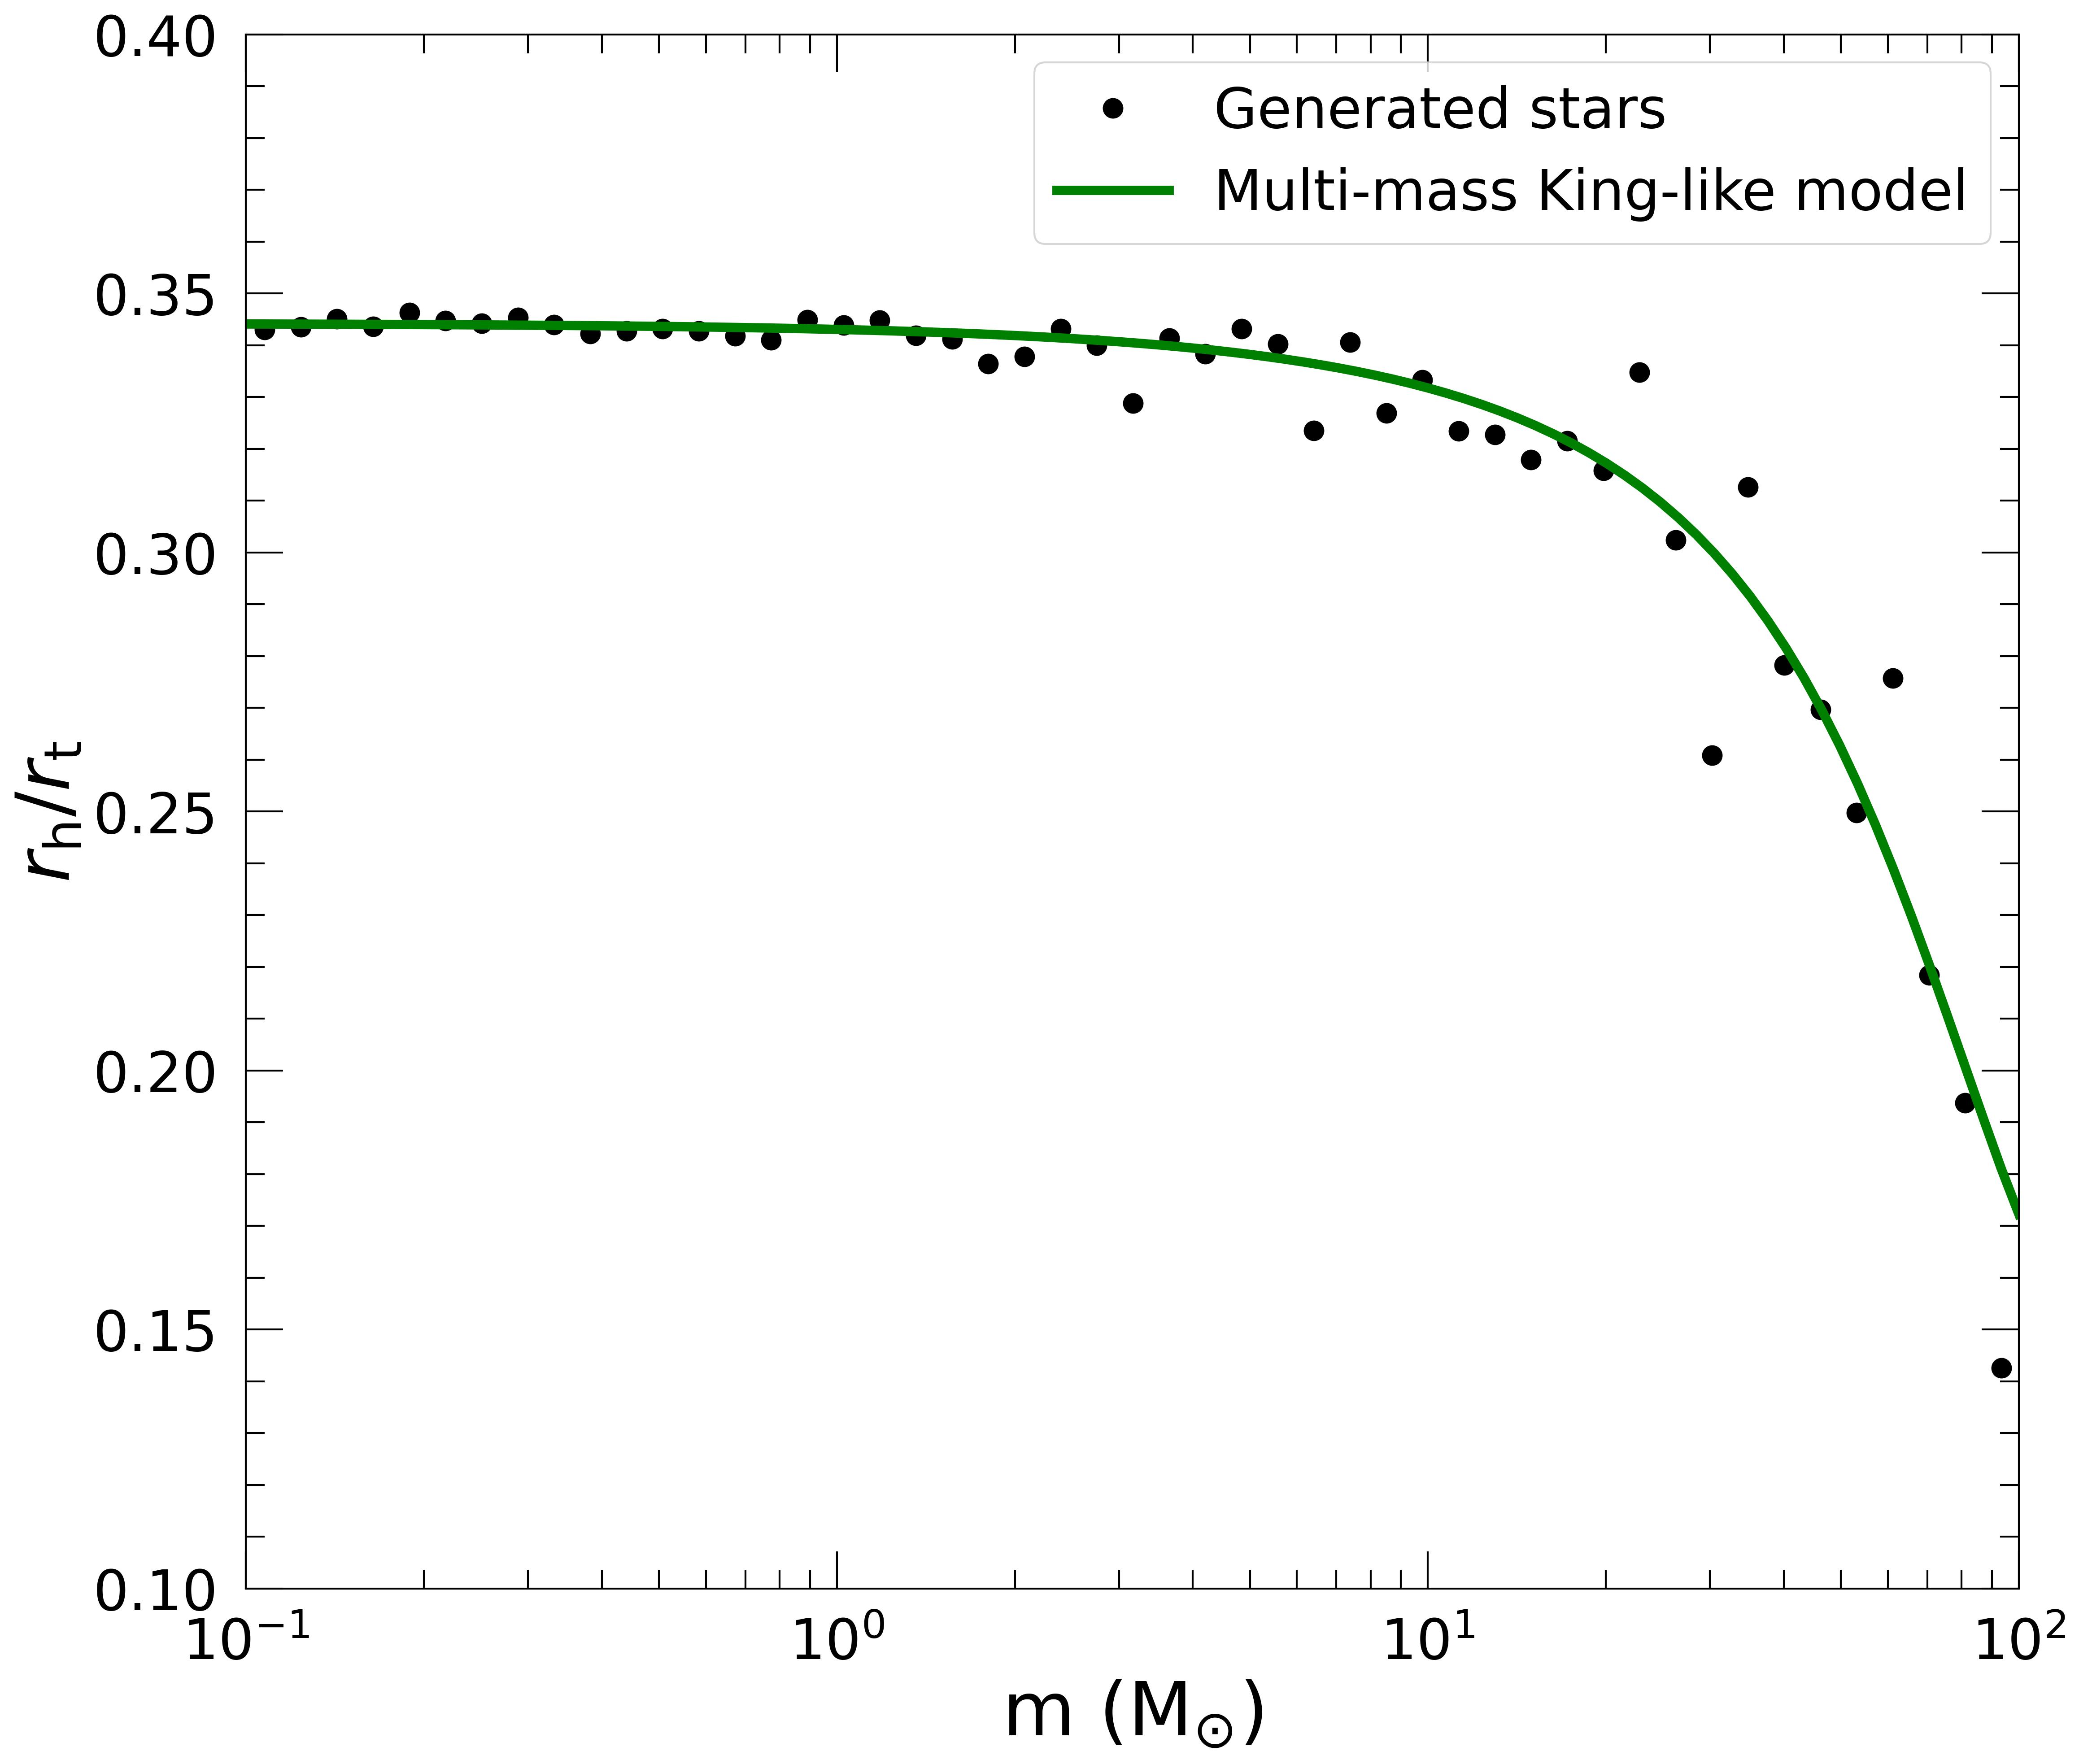
Our dynamical model is a continuous formulation of a multi-mass King-like model (Teodori, Straniero and Merafina 2024) as an extension of the Da Costa & Freeman (1976) model and recovering the King (1966) formalism. The distribution function (DF) is obtained as an approximated solution of a generalized expression of the Fokker-Planck equation, valid for collisional systems with a mass distribution. The DF describes the distribution in positions, velocities, and masses. Its expression reads
\(g(r,v,m) = k(m)\,\mathrm{e}^{-m[\varphi(r)-\varphi_\mathrm{0}]/(k_\mathrm{B} \theta)}\left[\mathrm{e}^{-\varepsilon(v,m)/(k_\mathrm{B}\theta)}- \mathrm{e}^{-\varepsilon_\mathrm{c}(r,m)/(k_\mathrm{B}\theta)}\right],\)
where \(\varepsilon=mv^2/2\) and \(\varepsilon_\mathrm{c}=mv_\mathrm{e}^2/2\) are the kinetic and cut-off energy of a star with mass \(m\), with \(v_\mathrm{e}\) the escape velocity. Here \(\varphi(r)\) is the gravitational potential (with \(\varphi_\mathrm{0}\) its value in the cluster center), and \(r\) is the radial coordinate. The variable \(\theta\) is the thermodynamic temperature (Merafina 2017, 2018, 2019), and \(k_\mathrm{B}\) is the Boltzmann constant. The multiplying factor \(k(m)\) weights the DF of each mass \(m\) (as for the Da Costa & Freeman 1976 model). The mass density is obtained by integrating \(g(r,v,m)\) over velocities and masses, and the equilibrium configuration is given by solving the Poisson equation. The inputs of the model are \(\boldsymbol{\Phi_0 = (\varphi_R - \varphi_0)/k\theta }\) and the mass function, in terms of a single power law with slope \(\boldsymbol{\alpha}\) and the minimum and maximum mass \(\mathbf{m_\mathrm{min}}\) and \(\mathbf{m_\mathrm{max}}\), respectively.
Velocity dispersion - mass relationship
We fit the velocity dispersion dependence on stellar mass \(\boldsymbol{\sigma(m)}\) by Watkins et al. 2022 (HST proper motion) through the Bianchini function and the model prediction. To obtain the velocity dispersion relation with mass for the model, we first need the \(\sigma(r,m)\) profile. This quantity is first projected in 2D and then averaged in the radial shell covered by data (see Watkins et al. 2022, Table 2).
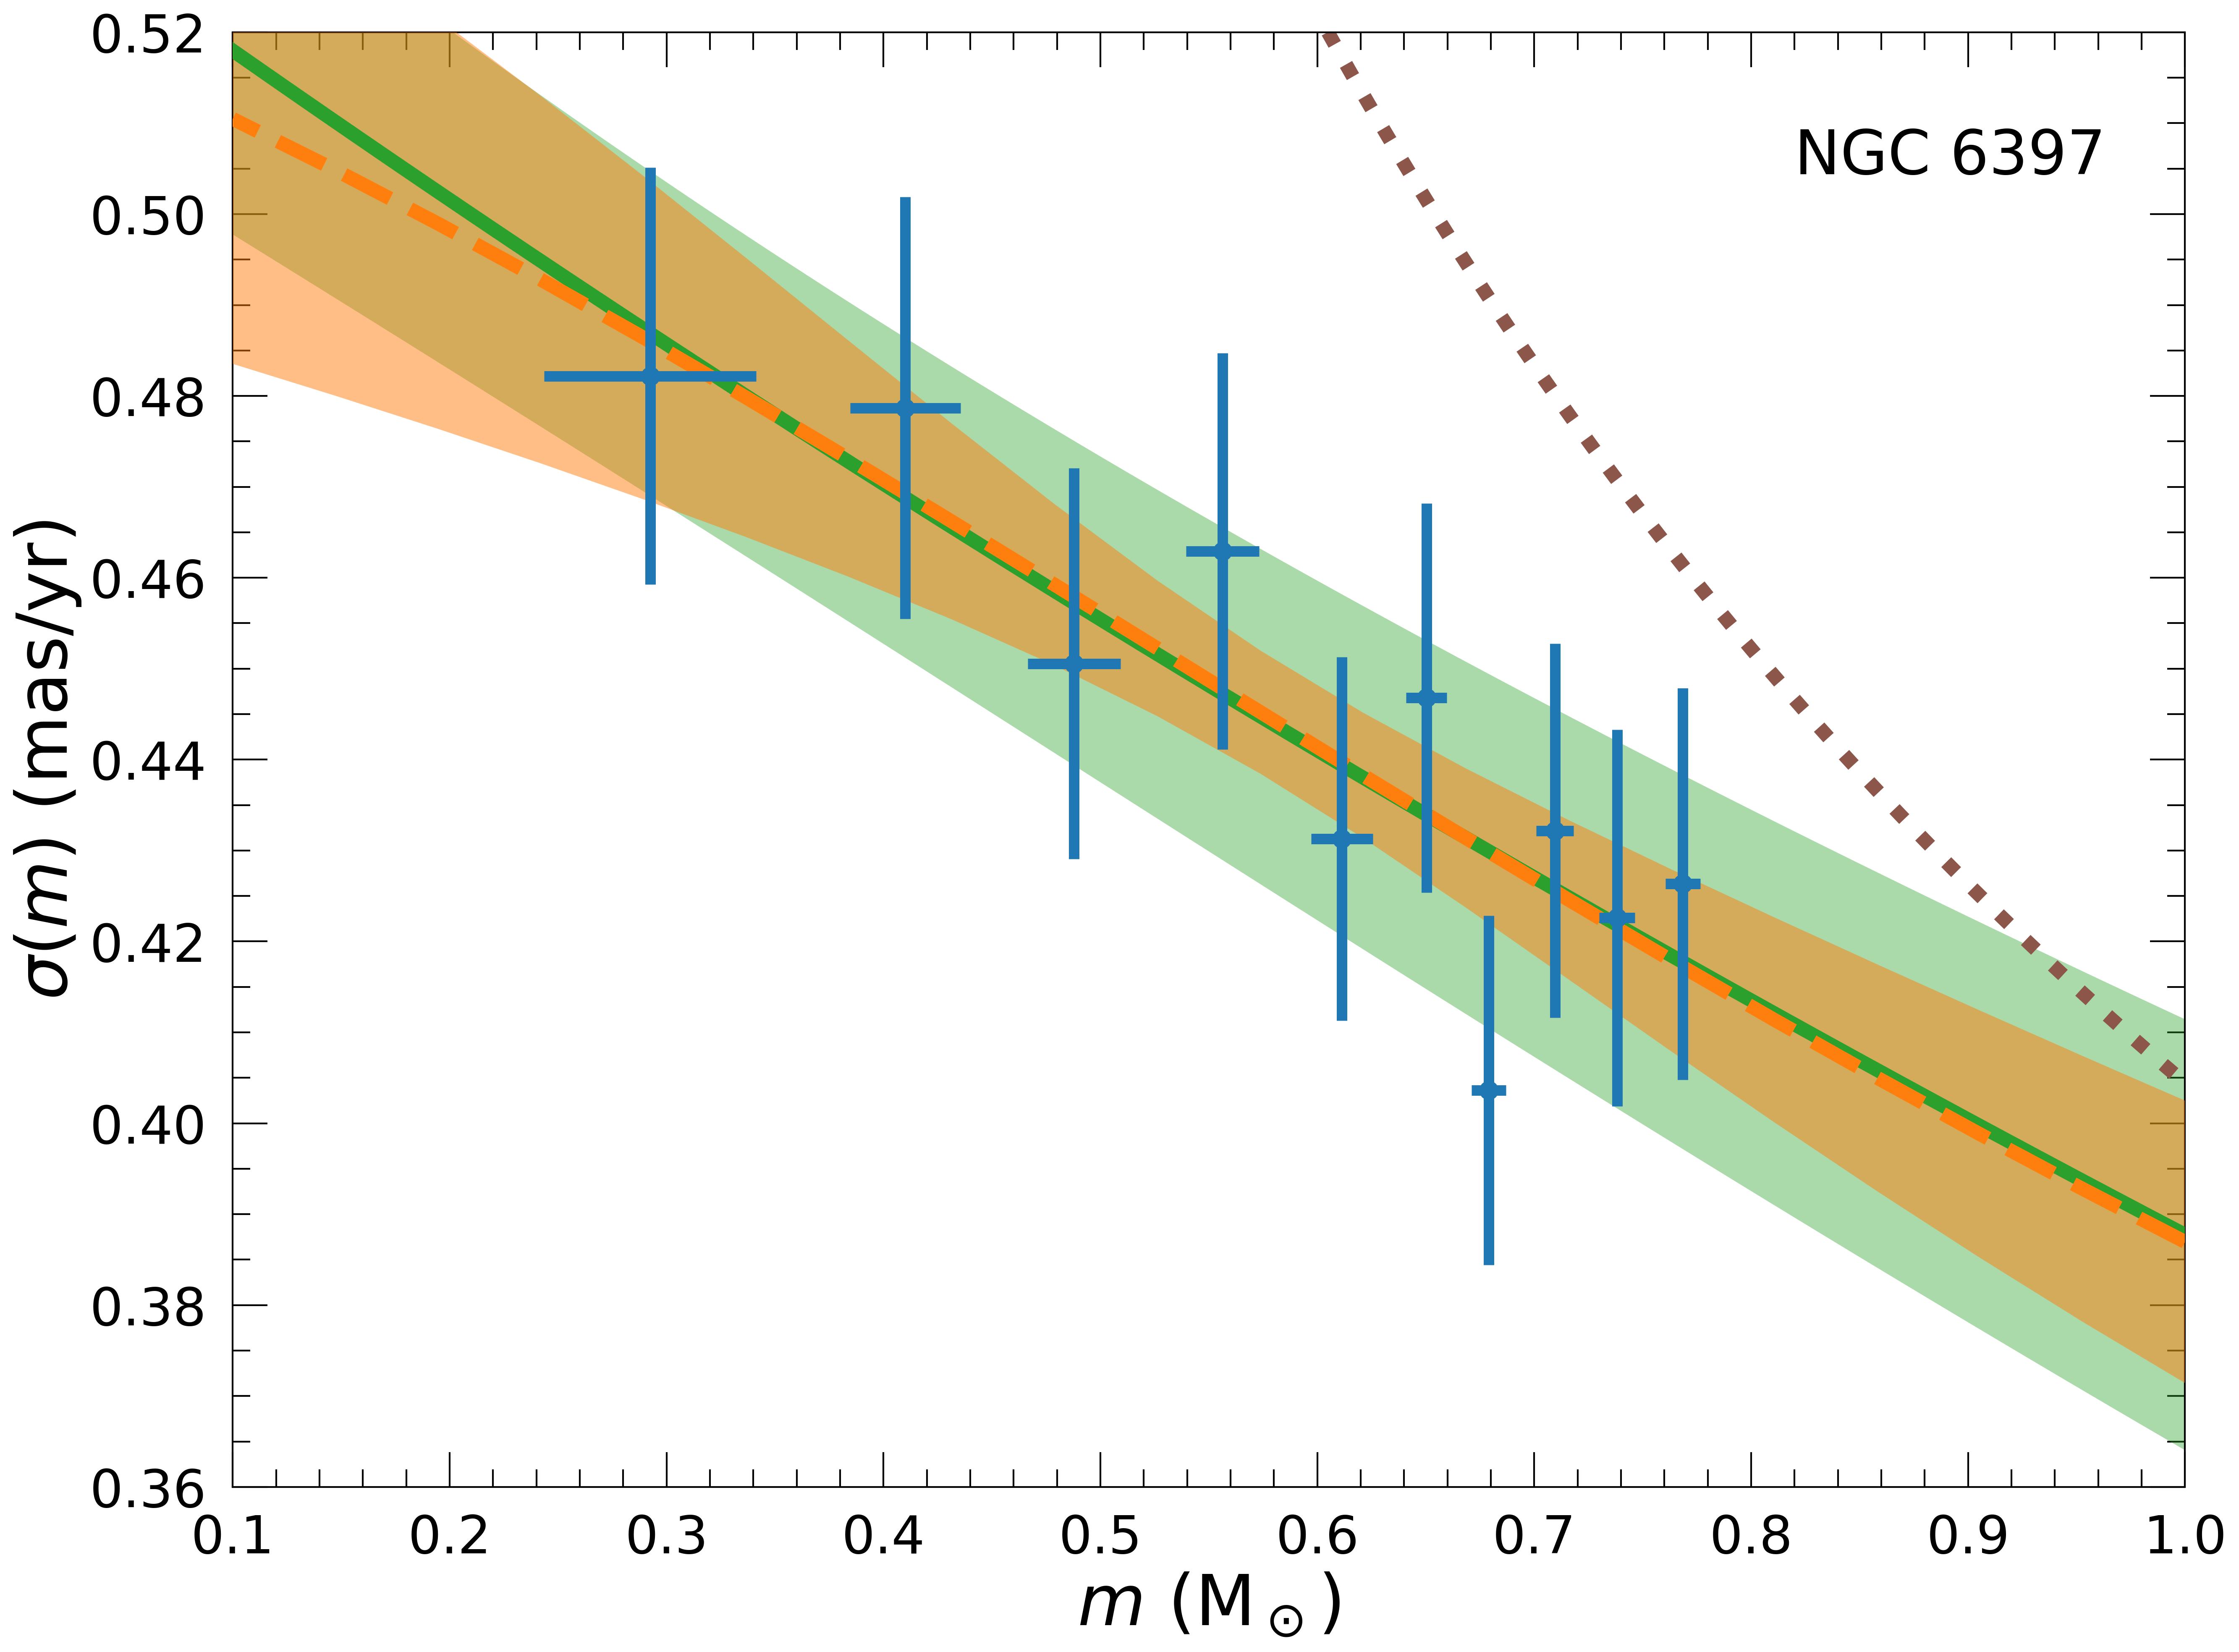
Figure 1. Projected velocity dispersion as a function of stellar mass for NGC 6397. The error bars are the data from Watkins et al. (2022), the continuous green line is our best fit with the Bianchini et al. (2016) fitting function with its error band, the dotted brown line is the complete equipartition limit \(\sigma\propto m^{-1/2}\), and the dashed orange line is our model best-fit with its 68% confidence band.
We obtain a good agreement between predictions and observables as well as a large compatibility between the model and the Bianchini function (Figure 1 for NGC 6397). We expect a relation between the main model parameter \(\boldsymbol{\Phi_0}\) and \(\mathbf{m_\mathrm{eq}}\), both quantifying the degree of energy equipartition (Figure 3), as we obtain. However, we must consider shell selection and projection effects for \(m_\mathrm{eq},\) that alter its prediction.
By fitting the theoretical \(\sigma(r,m)\) radial profile with the Bianchini function as well as its projection, we can build radial profiles for \(m_\mathrm{eq}\), revealing the effect of project and radial selection effects, both reducing the predicted equipartition degree. We notice that the 3D value of \(m_\mathrm{eq}\) is more stable within the core, where the maximum degree of equipartition is reached. Furthermore, we obtain that the mass function slope \(\boldsymbol{\alpha}\) can become important at large radii (Figure 2).
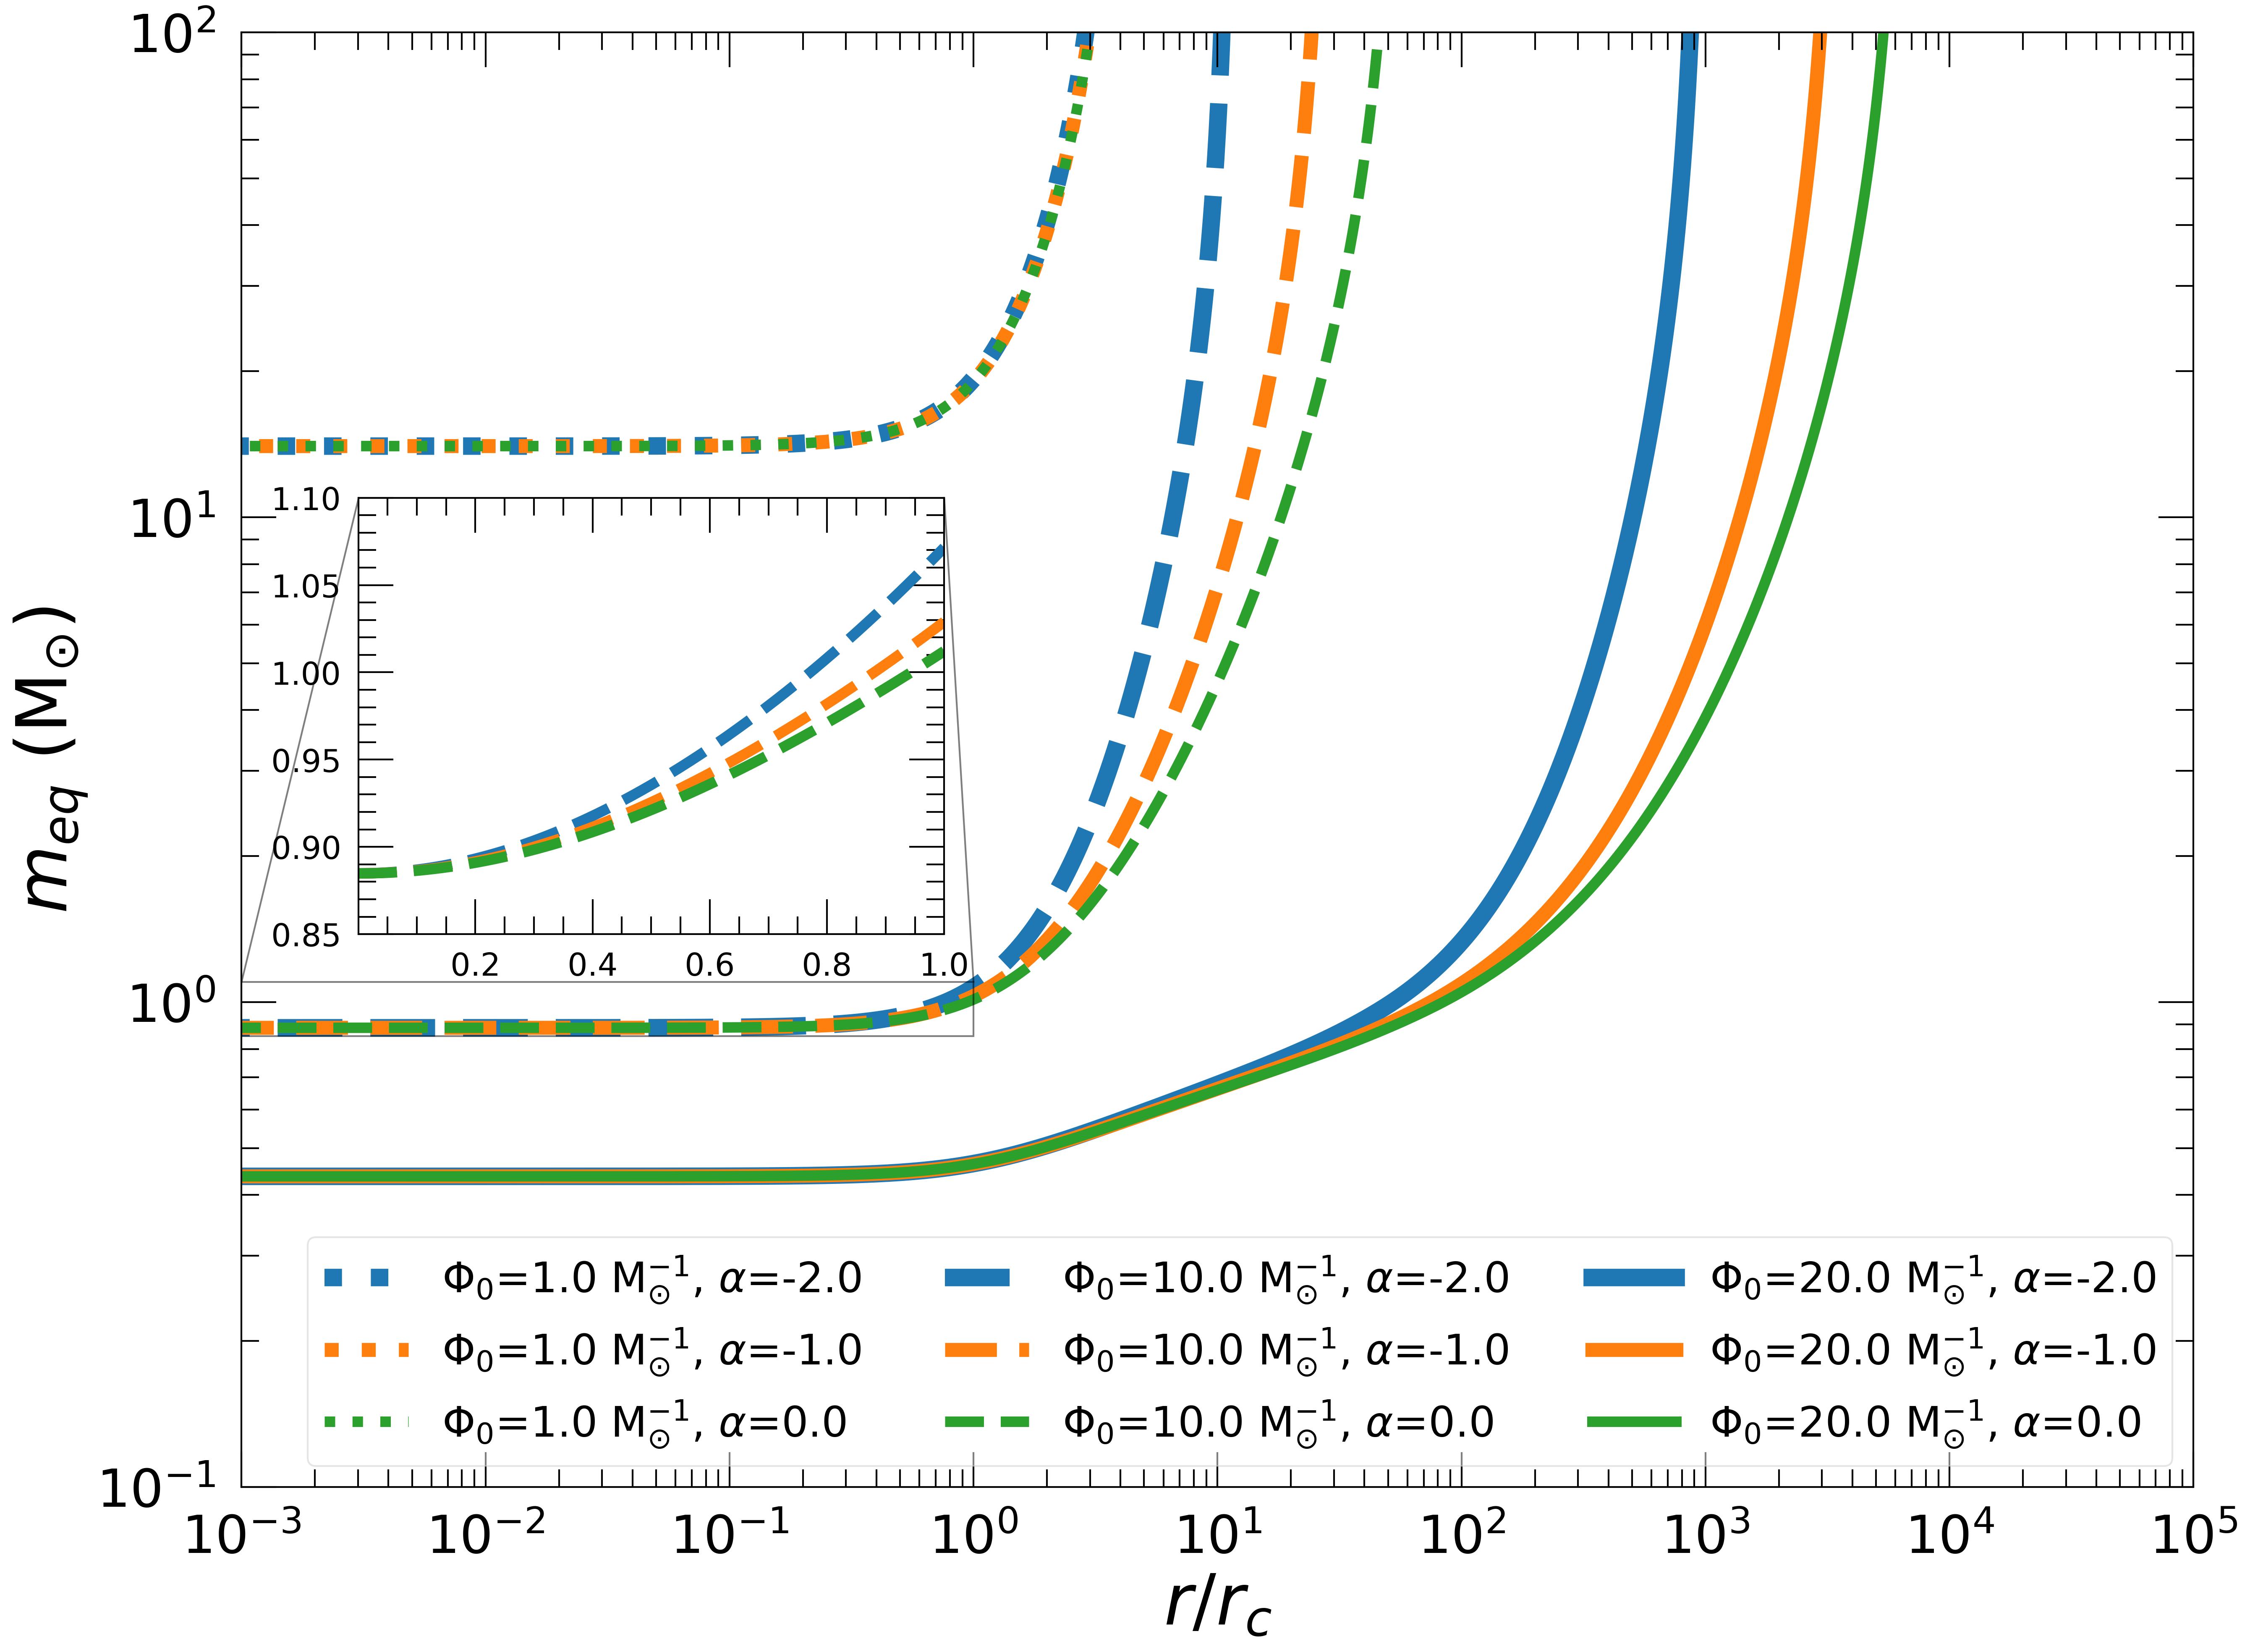
Figure 2. Theoretical radial profile of the equipartition mass obtained for different values of the model parameters \(\Phi_0\) (same line style) and \(\alpha\) (same colors and line width). The panel zooms onto the core region \(r ≤ r_\mathrm{c}\) .

Figure 3. Relation between \(\Phi_0\) and meq (Watkins et al. 2022). The \(\chi^2\) test value is given by the color of the data point according to the color bar to the right. The blue continuous line and the orange dashed line are the 3D and 2D theoretical predictions for \(m_\mathrm{eq}\) in the core, respectively.
Relation with structural properties and dynamical age
Dynamically old clusters have experienced several relaxation times, the timescale for the relaxation process, during their life. The equipartition mass is known to relate with the number of core relaxation times \(N_\mathrm{core}\) as well as other structural properties like the concentration.
Here, we explore the relation between the dynamical model's main parameter \(\boldsymbol{\Phi_0}\) and the concentration \(\mathbf{c}\) as predicted by the model and from the literature (Figure 4).
We also present in Figures 5 and 6 the relation with \(\mathbf{N_\mathrm{core}}\) as well as the \(\mathbf{A^{+}}\) parameter that tracks the segregation of Blue Straggler Stars with respect to other stars (Ferraro et al. 2012, 2020; Alessandrini et al. 2016; Lanzoni et al. 2016). All these quantities increase with the dynamical age, as we expect and find for \(\Phi_0\). On the contrary, the core radius is smaller for dynamically older clusters, as we obtain in Figure 7.
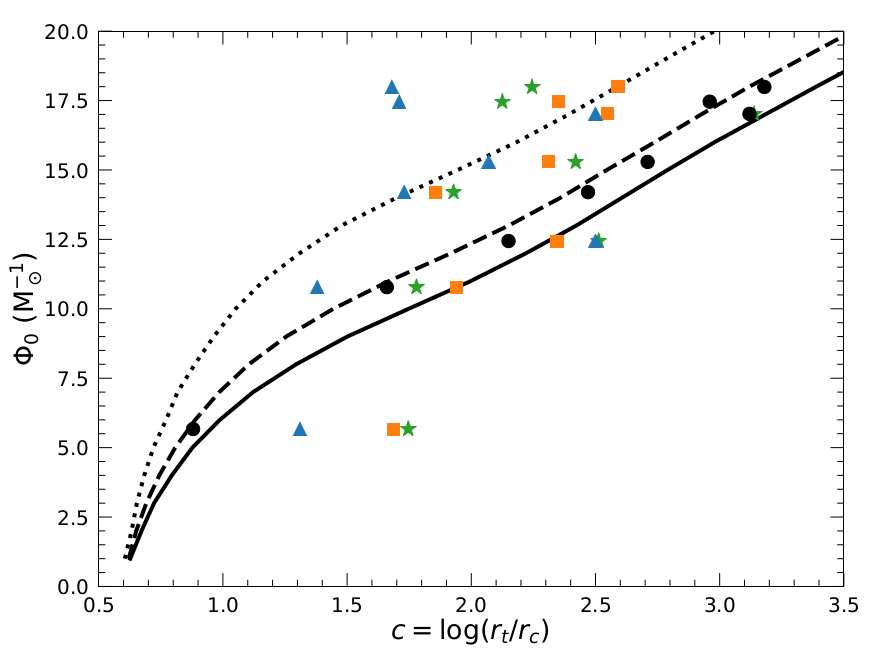
Figure 4. Relation between \(\Phi_0\) and the concentration \(c=\log{(r_\mathrm{t}/r_\mathrm{c})}\). The continuous, dashed, and dotted lines represent, respectively, the theoretical prediction with a mass function slope \(\alpha = 0.0\), \(\alpha =-1.0\), and \(\alpha=-2.0\), while the black circles show the constrained values of \(\Phi_0\) and \(c\) for the analyzed clusters. The blue triangles show the King concentration from the Harris (1996) catalog (2010 edition), while the orange squares and green stars are computed using the core radius from the Harris (1996) and Baumgardt (2018-2023) catalogs respectively, and the tidal radius from Webb et al. 2013.
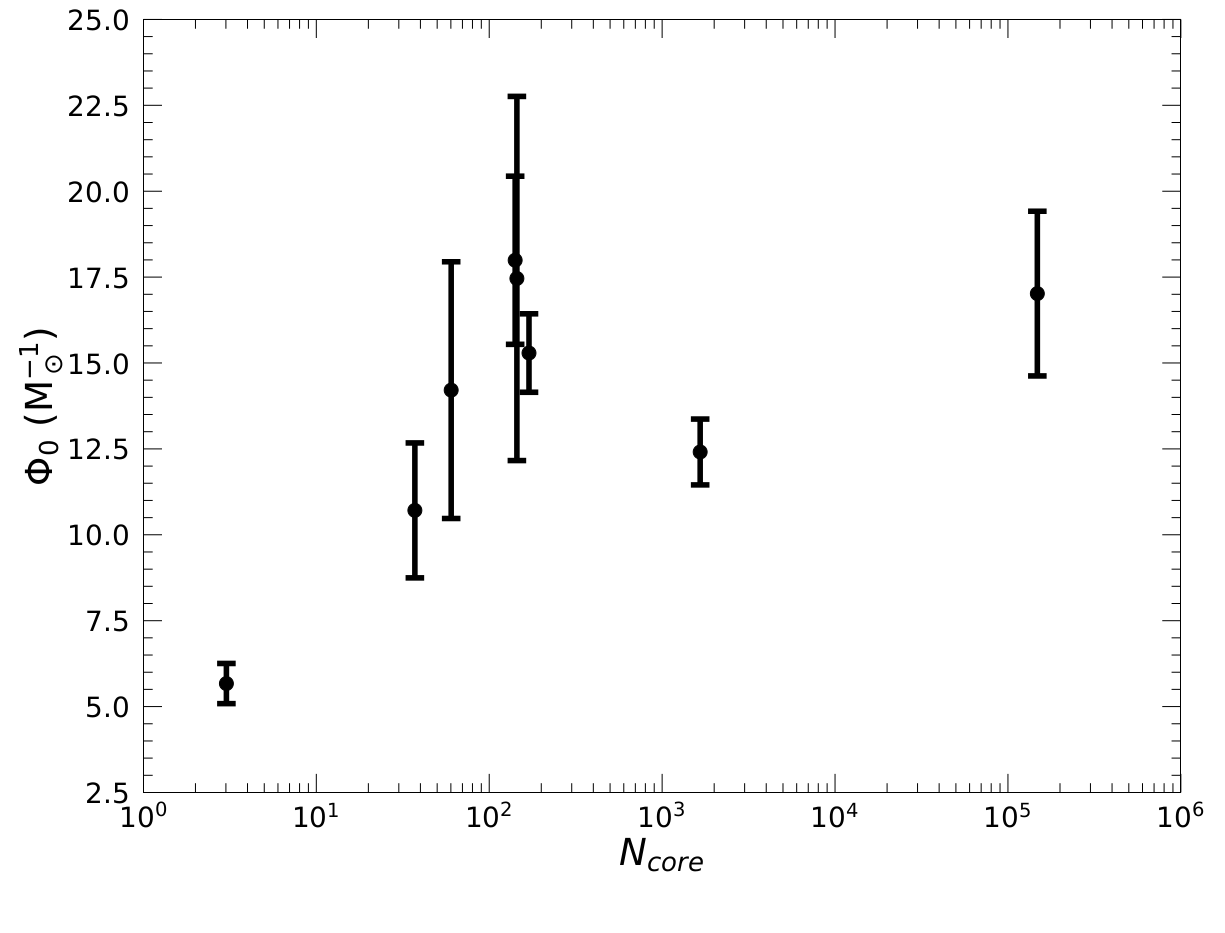
Figure 5. Obtained values of \(\Phi_0\) against the number of core relaxation timescales \(N_\mathrm{core}\) from Watkins et al. 2022.
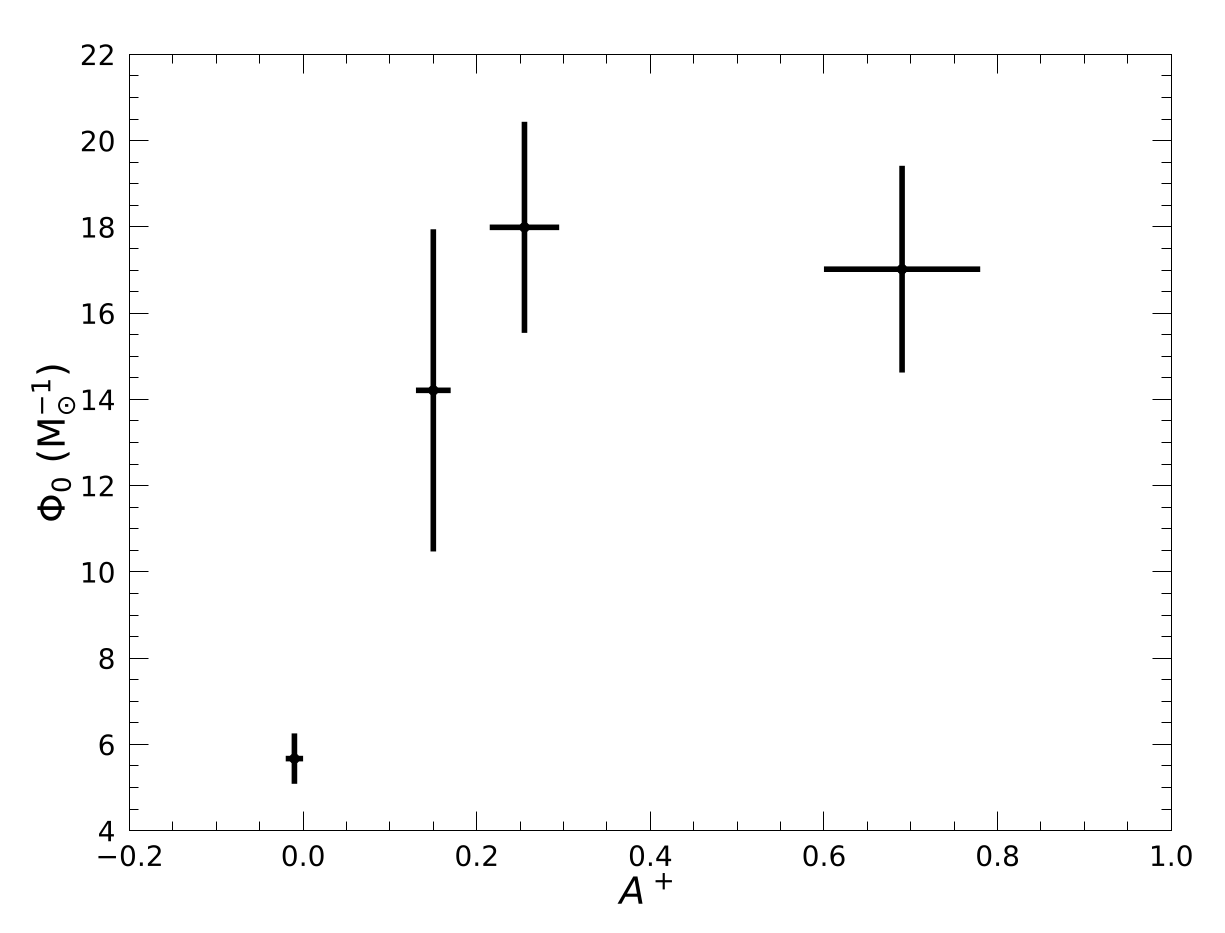
Figure 6. Relation between \(\Phi_0\) and the area \(A^+\) between the cumulative distribution of blue straggler stars and the reference stars (Ferraro et al. 2012, 2020; Alessandrini et al. 2016; Lanzoni et al. 2016).
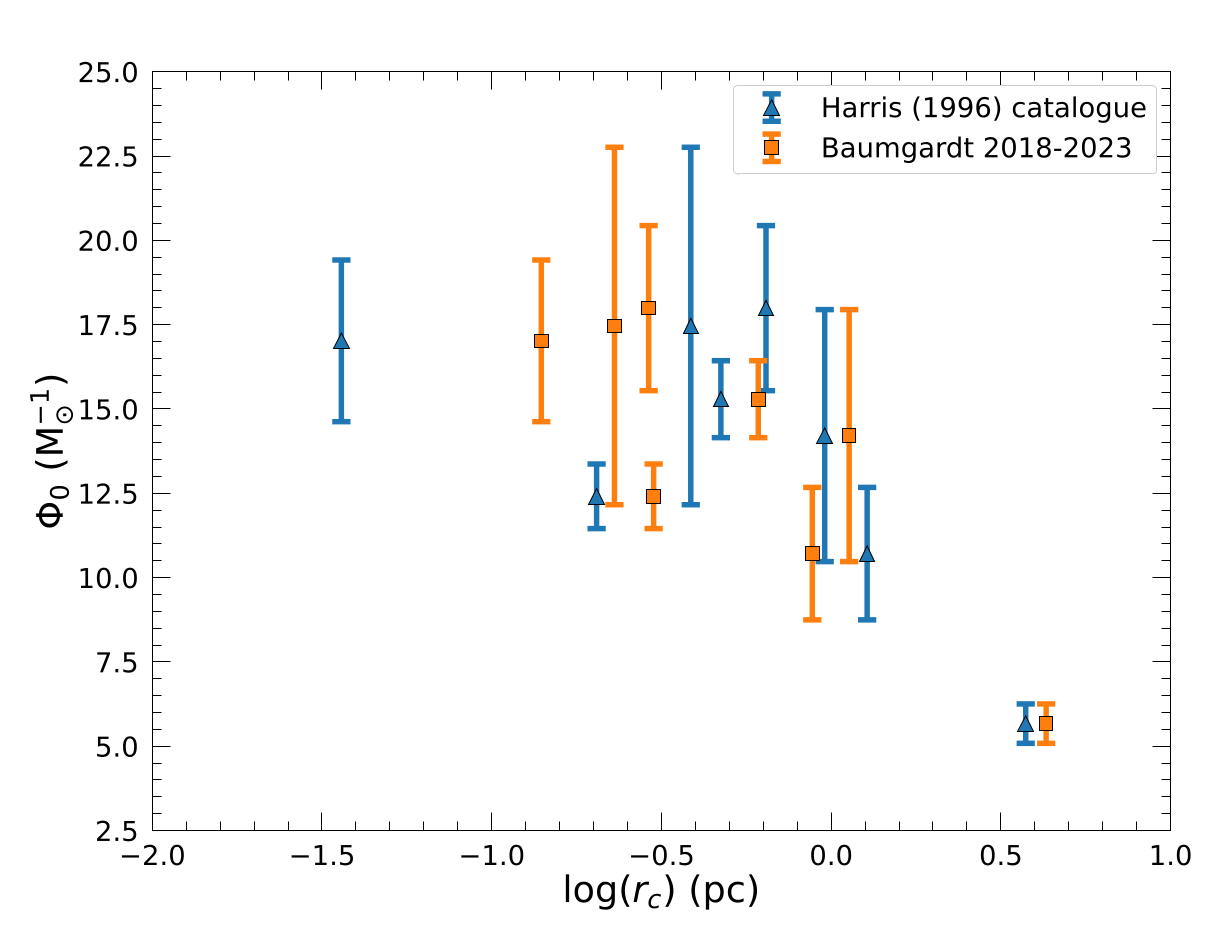
Figure 7. \(\Phi_0\) relation with the core radius, using values from the Harris (1996) catalog (blue triangles) and the Baumgardt (2018-2023) online catalog (orange squares).
An independent estimate: Surface Brightness Profiles
We get an independent estimate of the parameter \(\boldsymbol{\Phi_0}\) by fitting Surface Brightness Profiles (SBPs) by Trager et al. 1995 with the prediction of the dynamical model. The analysis and fits were done by following a procedure similar to that described by McLaughlin & van der Marel (2005) and Zocchi et al. (2012), applied to single-mass models. We remove the constant mass-to-light ratio assumption and build the prediction by adopting a theoretical mass-magnitude relation. We use BaSTI isochrones (Hidalgo et al. 2018; Pietrinferni et al. 2021, 2024; Salaris et al. 2022) for an age of 13 Gyrs, with \([\alpha/\text{Fe}]=+0.4\), \(Y = 0.247\), and a different metallicity \([\text{Fe}/\text{H}]\) for each cluster, taken from the Harris catalog, as a reference case.
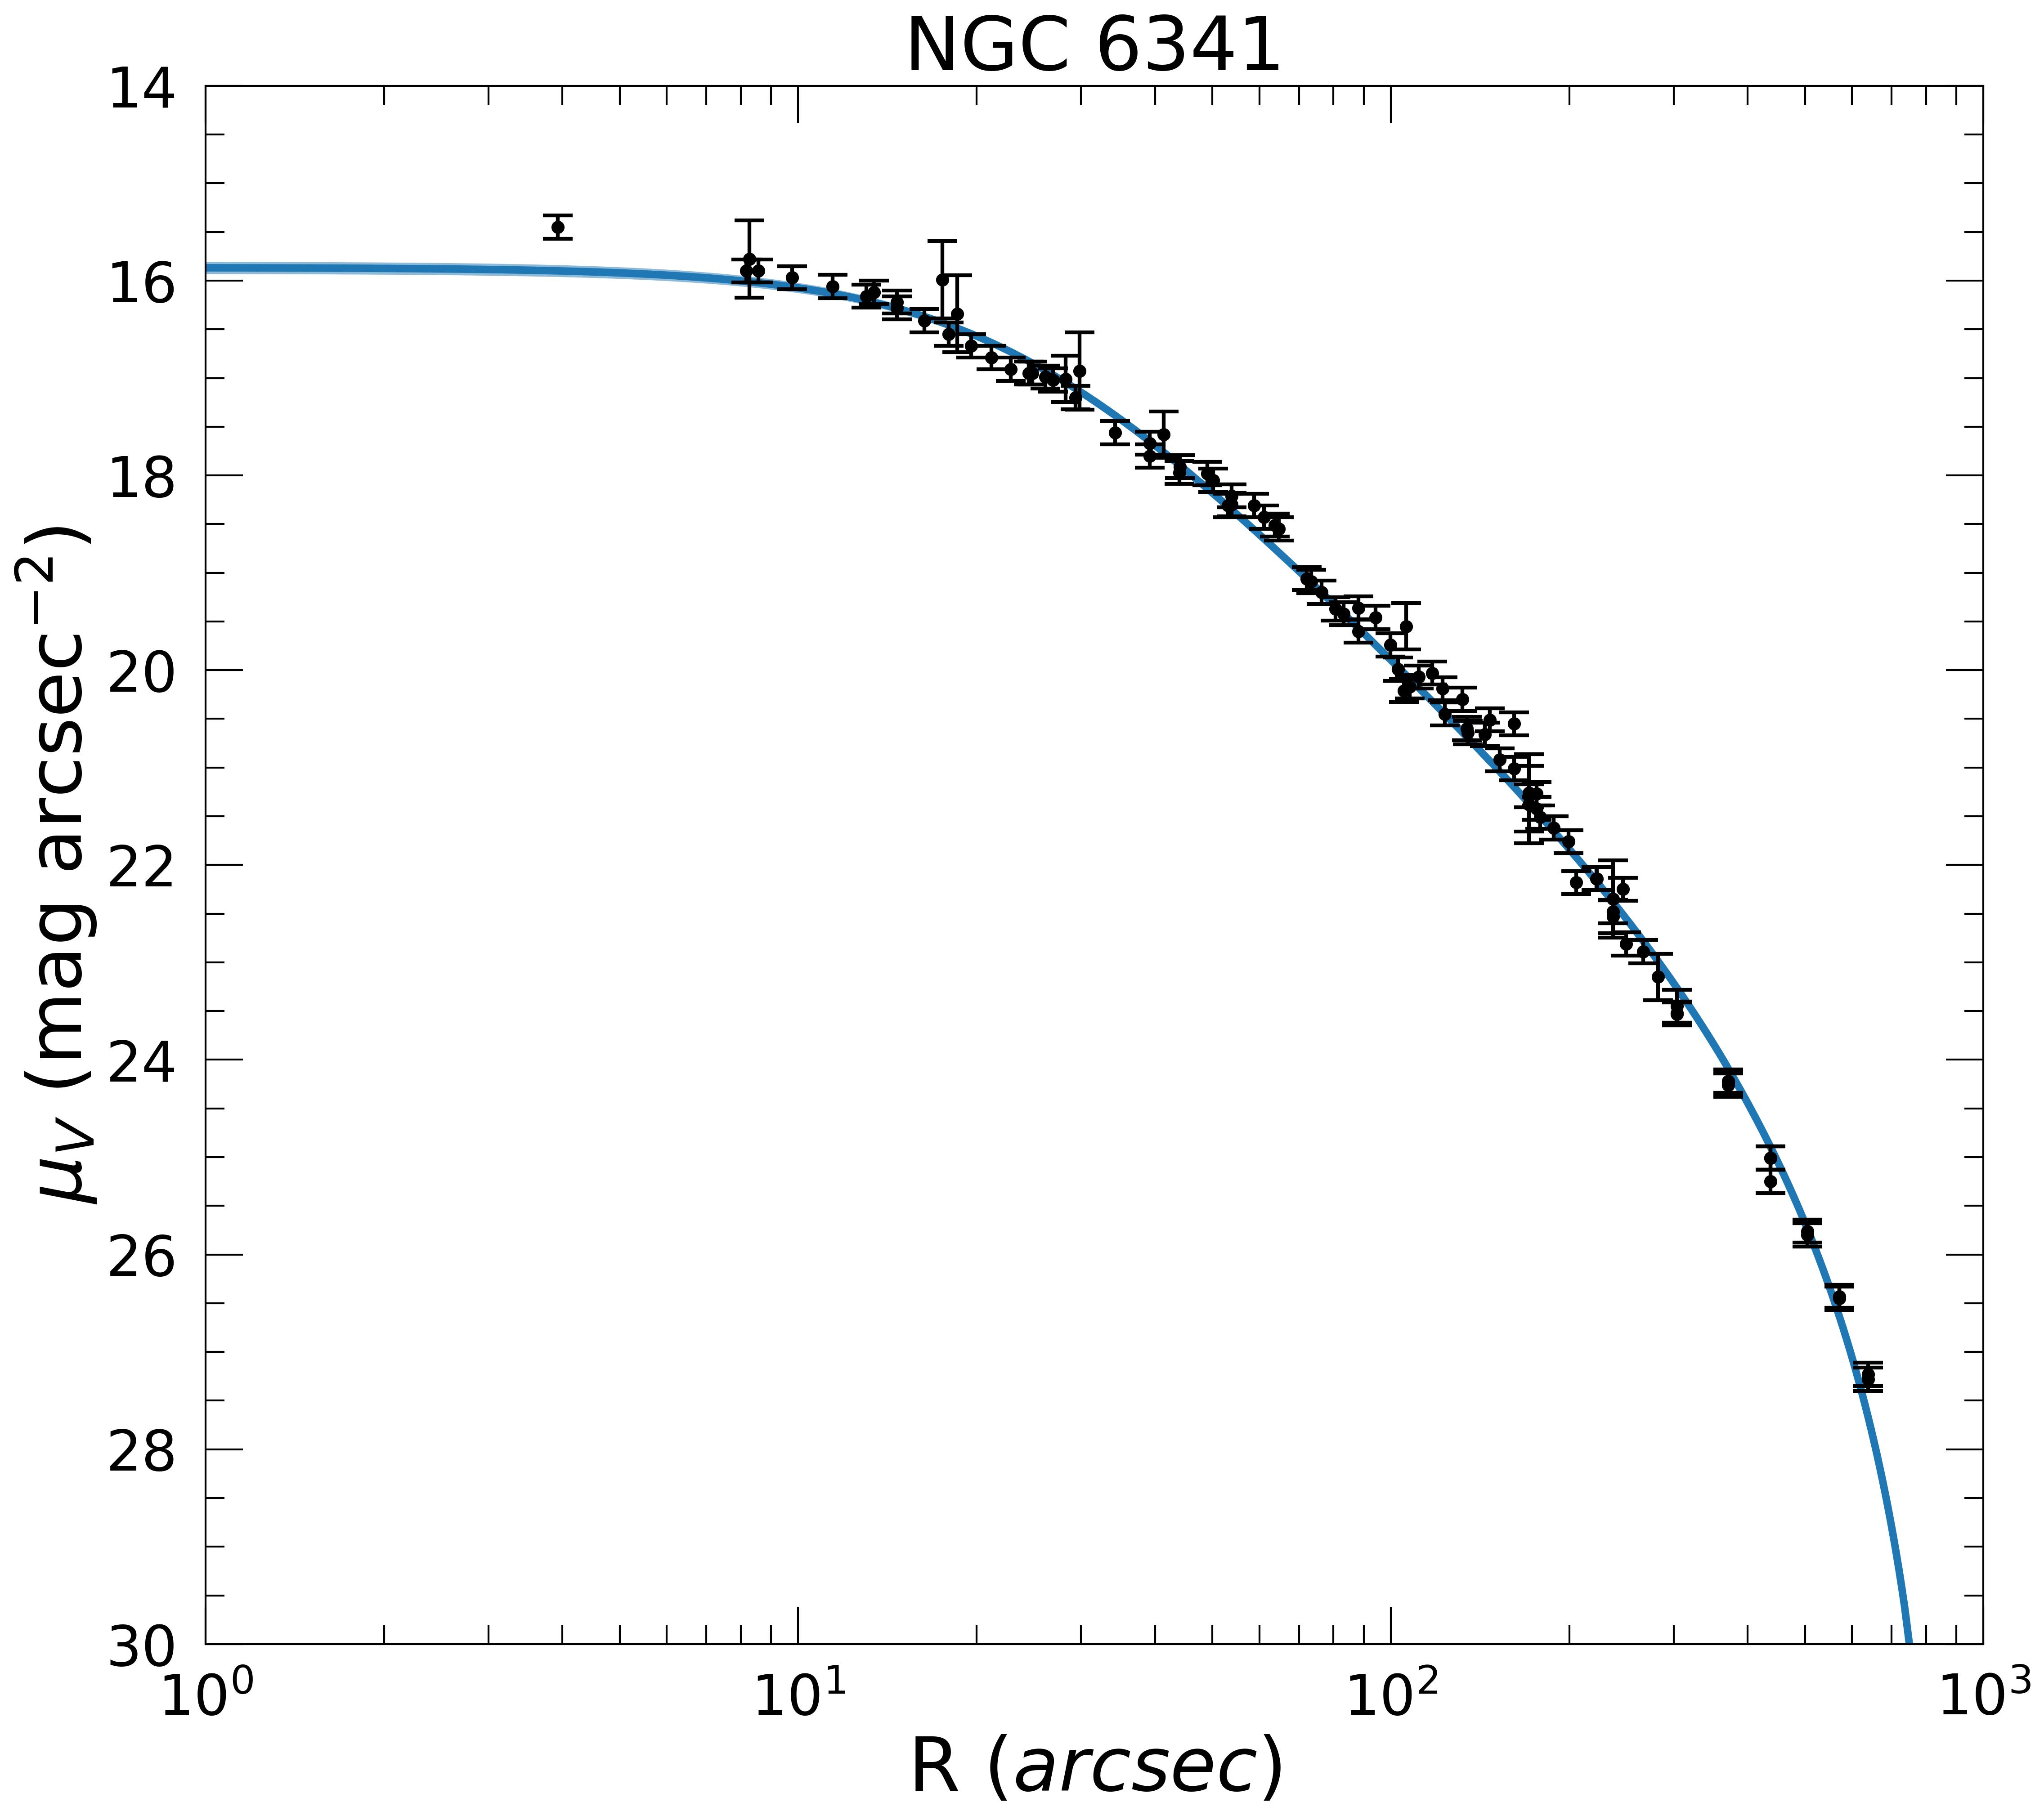
Figure 8. Surface brightness profile forNGC 6341. The black circles with error bars are the data from Trager et al. (1995) analyzed following the work by McLauglin & van der Marel (2005) and Zocchi et al. (2012). The continuous blue line is our model best fit with its confidence band, which is obtained by assuming the Baumgardt et al. (2023) mass function slope and adopting the BaSTI isochrones (Hidalgo et al. 2018; Pietrinferni et al. 2021, 2024; Salaris et al. 2022) with 13 Gyr, \([\alpha/\text{Fe}]=+0.4\), \(Y = 0.247,\) and metallicity \([\text{Fe}/\text{H}]=-2.31\), taken from the Harris (1996) catalog (2010 edition).
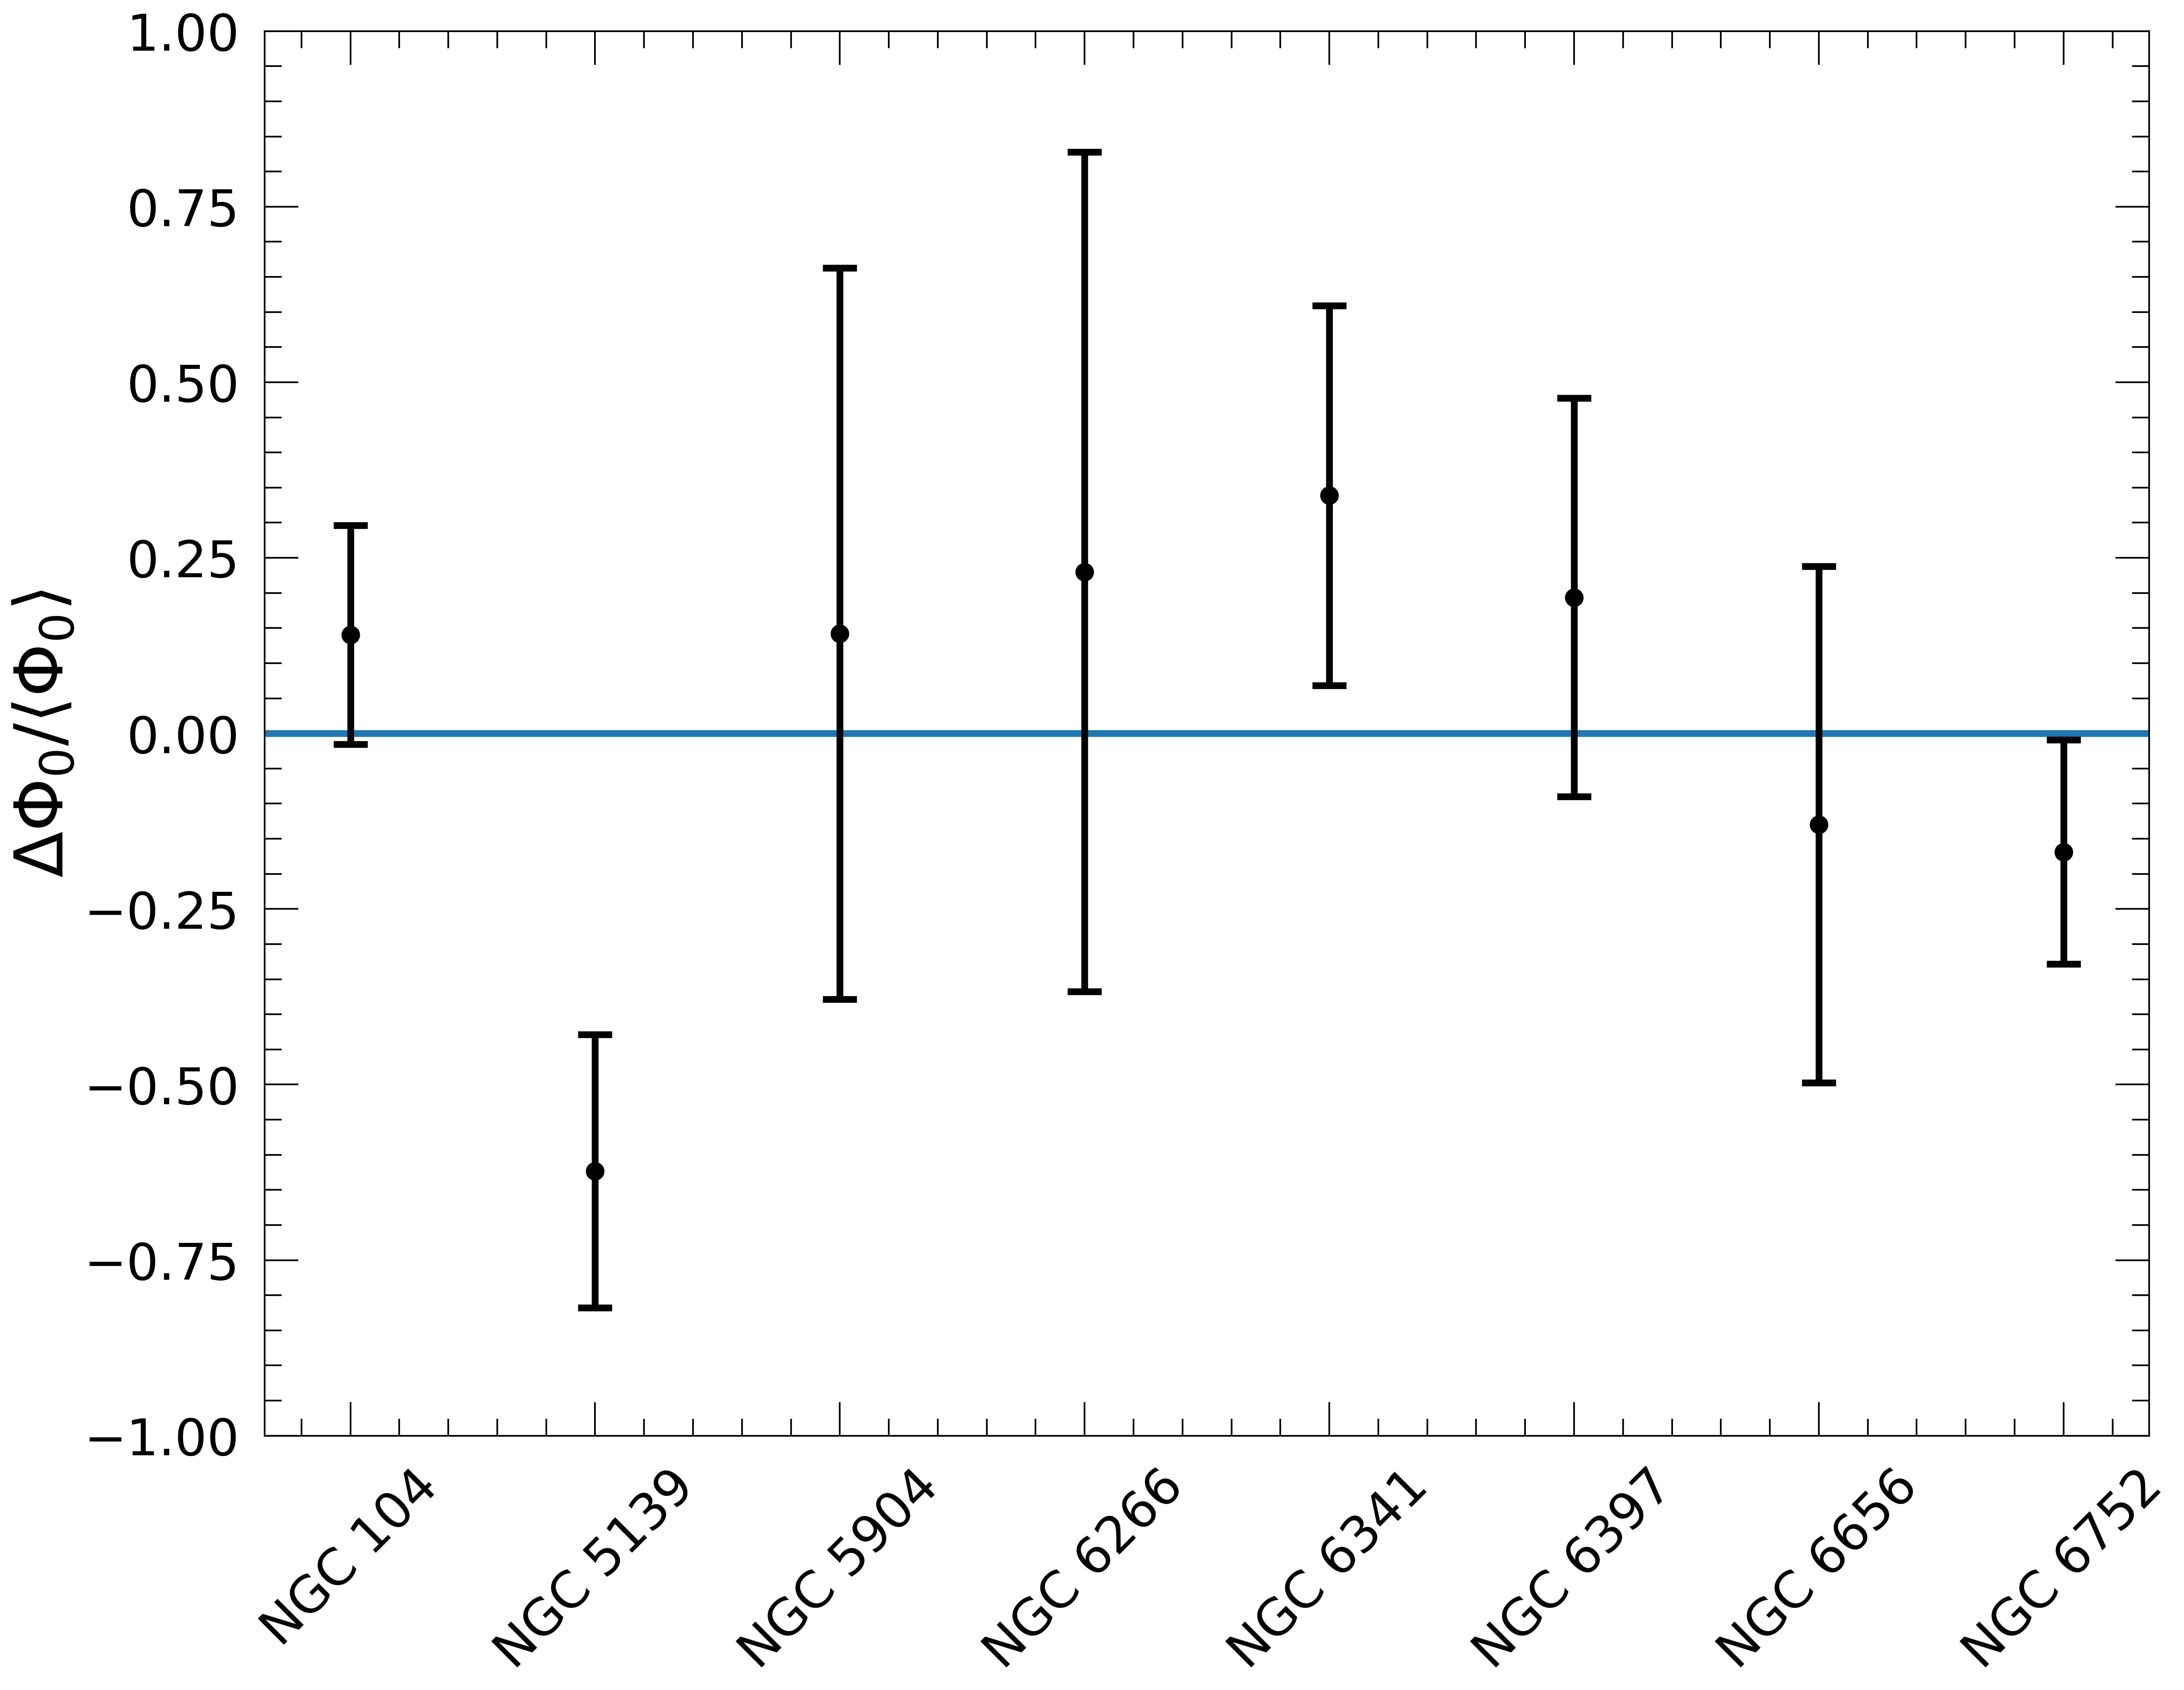
Figure 9. Relative variation in the estimates of the \(\Phi_0\) parameter for each of the analyzed clusters, obtained by fitting the velocity dispersion dependence on stellar mass and the surface brightness profiles. The error bars are the \(2\sigma\) level uncertainties.
Summary
We summarize here our main findings.
- Our multi-mass King-like dynamical model predicts and quantifies the energy equipartition degree in GCs. It well fits internal kinematics observations (HST proper motion by Watkins et al. 2022) and shows a similar confidence with Bianchini et al. 2016 fitting function.
- The parameter \(\boldsymbol{\Phi_0}\) mainly determines the energy equipartition degree and shows a relation with the equipartition mass \(\mathbf{m_\mathrm{eq}}\). Larger equipartition comes with larger \(\Phi_0\) values and lower \(m_\mathrm{eq}\). However, complete equipartition is never reached in the analyzed clusters. In addition, \(\mathbf{m_\mathrm{eq}}\) suffers shell selection and projection effects, underestimating the equipartition degree. On the contrary, \(\Phi_0\) uniquely determines the radial and project quantities of the system without any loss of information.
- As expected, the equilibrium parameter \(\boldsymbol{\Phi_0}\) tracks the dynamical state of GCs, further supported by its relation with structural properties like concentration \(\mathbf{c}\), \(\mathbf{N_\mathrm{core}}\), \(\mathbf{A^+}\), and core radius \(\mathbf{r_\mathrm{c}}\).
- The dynamical model can successfully fit the observed SBPs (Trager et al. 1995) upon the adoption of an appropriate theoretical mass-magnitude relation. This provides an independent estimate of \(\boldsymbol{\Phi_0}\) as well as other structural properties (such as central surface brightness, core, and tidal radius).
The obtained \(\Phi_0\) values are compared with the ones computed by fitting \(\sigma(m)\) and result compatible at the \(\boldsymbol{2\sigma}\) level for almost all analyzed clusters.
Additional material
Additional results for the analyzed clusters, such as the full list of obtained parameters, can be found in the original paper Teodori, Straniero, Merafina 2024, while additional plots, including the fits of \(\sigma(m)\) and the SBPs, are on Zenodo.