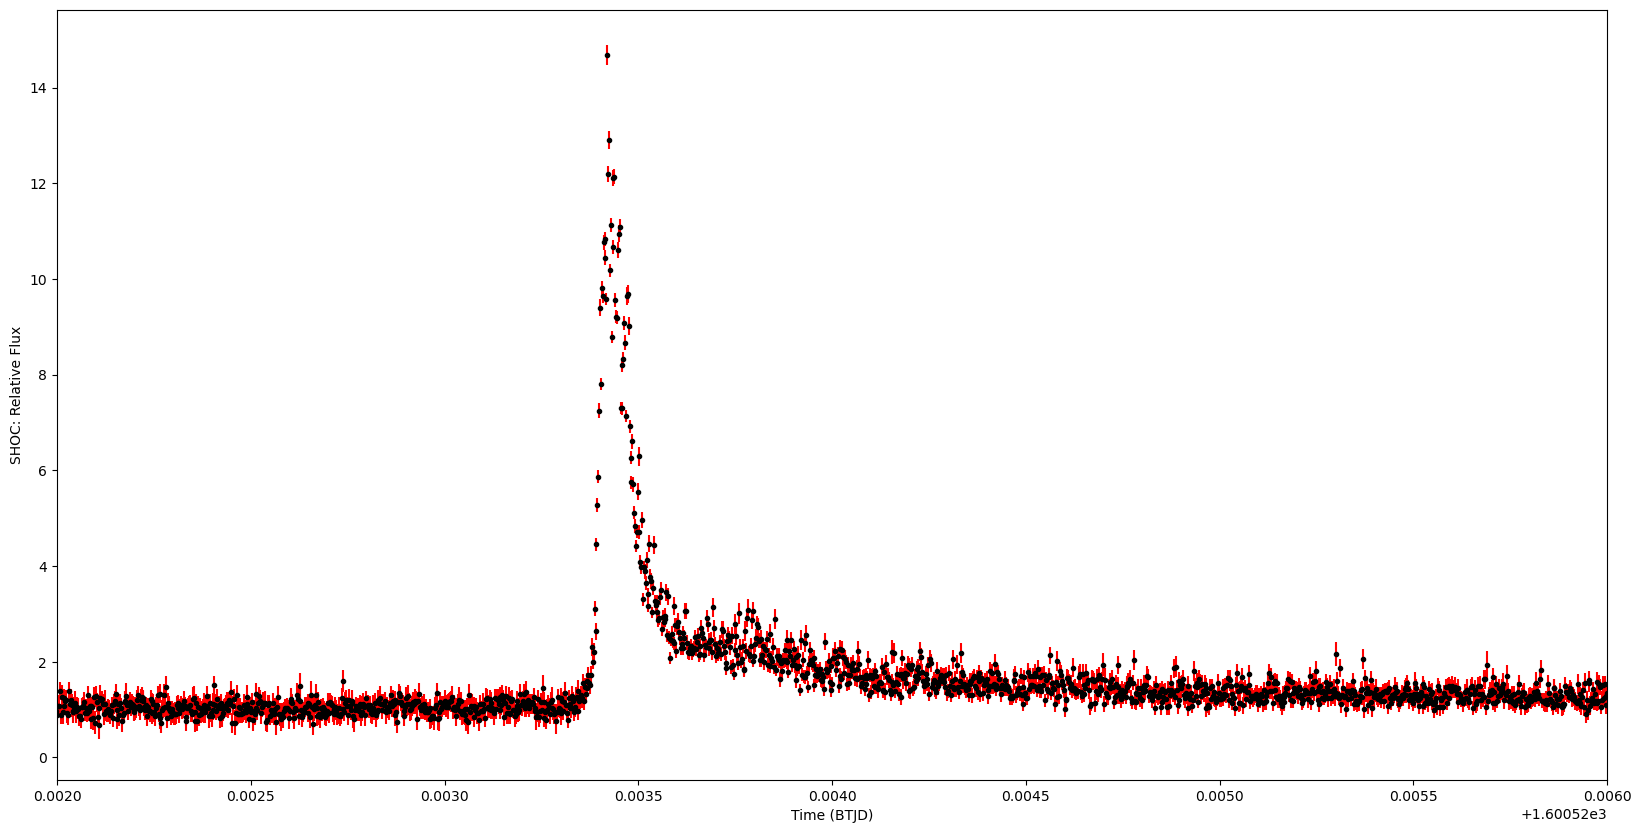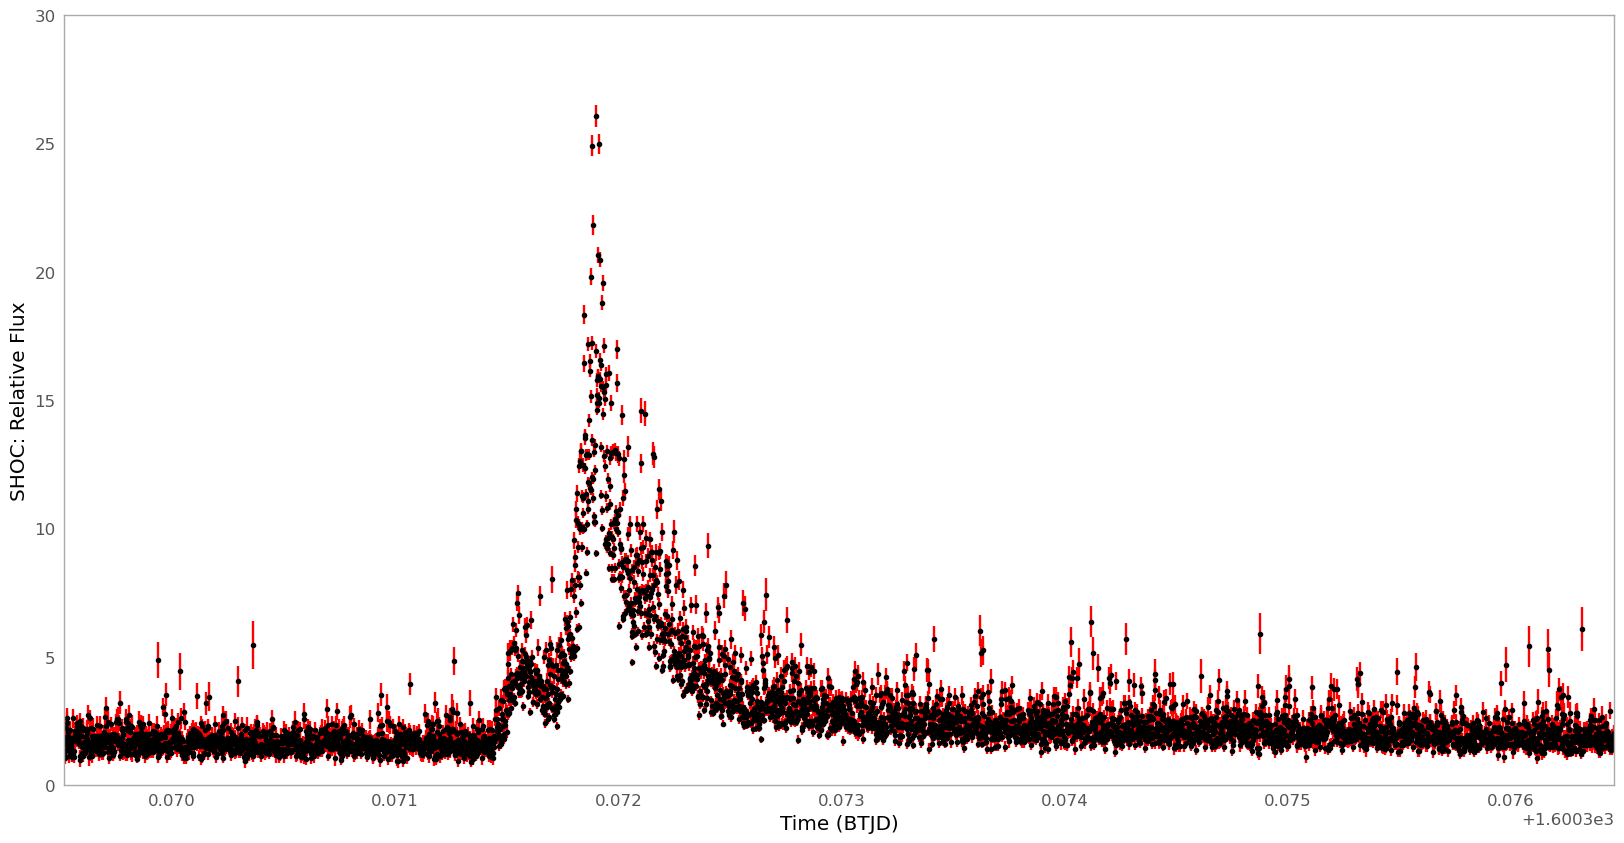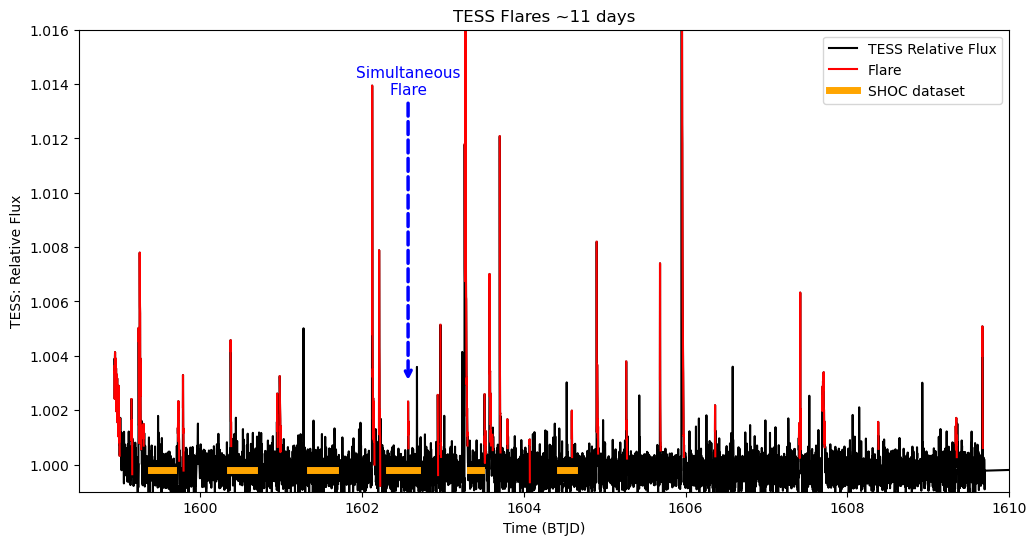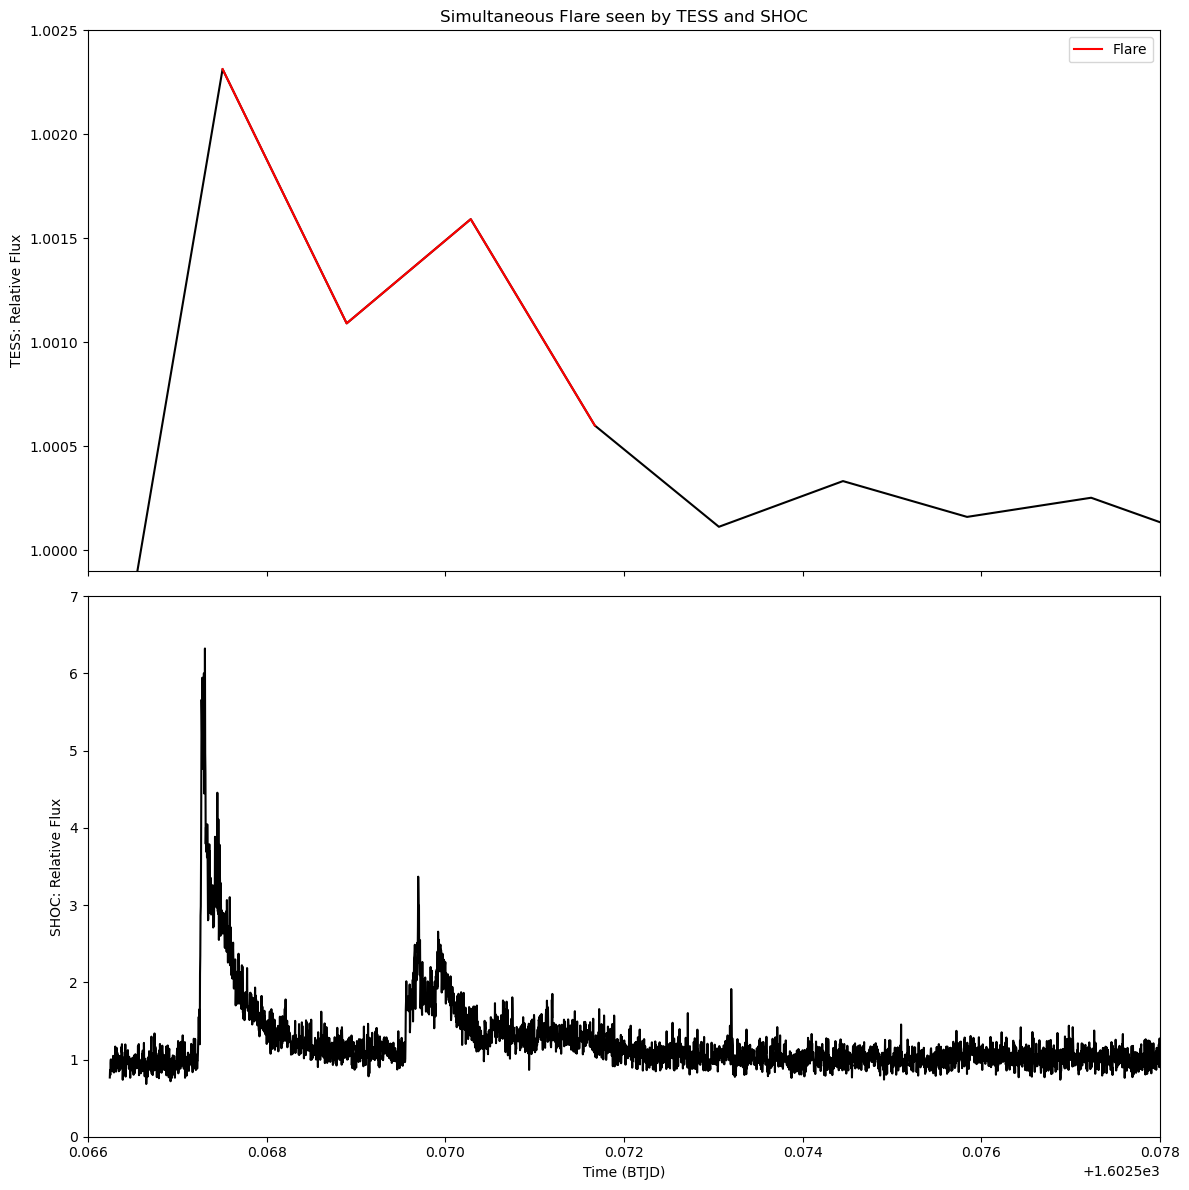
Proxima Centauri, the nearest stellar neighbour to Earth beyond the Sun, at a distance of 1.3pc, is an active M5.5 dwarf star with one confirmed and two candidate exoplanets. We observed Proxima Centauri for 7 nights in April 2019 using the Sutherland High Speed Optical Camera (SHOC, Figure 1) on the 1.9m telescope at the South African Astronomical Observatory (SAAO). The Transiting Exoplanet Survey Satellite (TESS, Figure 2) also observed Proxima Centauri in two sectors (Sector 11 and 12) in 2019. This provided nearly 2 months of observations at 120 second cadence. The SHOC observations were taken in the U-band filter and with a cadence of between 0.1 and 3 seconds. Our SHOC observations were coincident with some of the TESS observations.
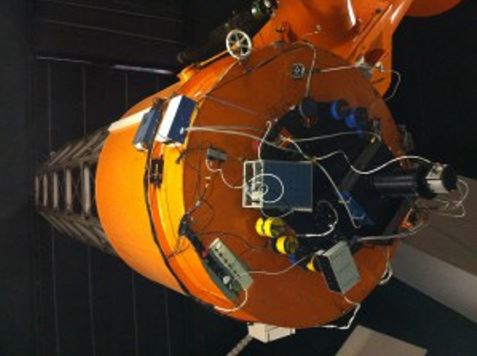
Figure 1: SHOC on the 1.9m Telescope at SAAO.
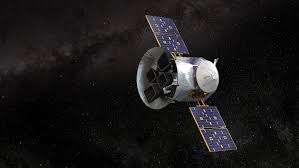
Figure 2: TESS space telescope.