Dynamics of massive galaxy disks at z=4-5 from the TRICEPS survey

Lingrui Lin 1,2 , Federico Lelli 2

  • 1 School of Astronomy and Space Science, Nanjing University, Nanjing
  • 2 INAF - Arcetri Astrophysical Observatory, Florence

Abstract

In this talk, I will present the dynamical analysis of the TRICEPS survey, which is a multi-facility effort to study 15 massive galaxies – log(Mstar/Msun)~10.5-11.5 – at z=4-5. TRICEPS exploits ALMA [CII] observations providing the cold gas distribution and kinematics, JWST NIRCam/MIRI imaging providing the stellar mass distribution, and VLA CO(1-0) observations providing the molecular gas mass. The ALMA data reaches superb spatial resolutions of 0.05"-0.20" (0.4-1.3 kpc), covering the [CII] emission with tens of resolution elements. We find the following results: (1) most galaxies possess a rotation-supported [CII] disk, indicating that regular rotation is ubiquitous in massive galaxies at z=4-5. (2) The [CII] disks rotate fast (300-600 km/s); roughly half of them are consistent with being the progenitors of the most massive spiral galaxies at z=0, while the other half must be the progenitors of local massive ellipticals. (3) In most cases, the circular velocity curves rise steeply at small radii, pointing to a large central mass, possibly due to a stellar bulge and/or a supermassive black hole. The combination of [CII], CO, and JWST data allows the construction of detailed mass models, revealing the nature of the mass concentration at small radii and probing the dark matter halo at large radii. (4) The average [CII] velocity dispersions are in between those inferred from CO and Ha data in galaxies at lower z; the scatters among galaxies are probably due to differences in the galaxy properties (stellar masses and star-formation rates) but no differences are found between galaxies with or without an AGN. In general, our results indicate that massive rotating disks are in place and well-developed when the Universe was less than 1.5 Gyr old.

Our sample

Location of TRICEPS galaxies (red stars) on the M*-SFR plane. Blue circles show galaxies from the ALMA CRISTAL survey (Herrera-Camus et al. 2025). TRICEPS galaxies lie at the top-end of the main sequence, so they are representative of the most massive star-forming galaxies at this cosmic epoch.

Science questions

What are the roles of rotation and turbulence in counterbalancing the disk gravity?

All TRICEPS targets are dynamically cold with Vp2 /Vc2 < 0.2.

Relation between Vp2 /Vc2 and Vrotv (Vp: asymmetric drift correction velocity; Vc: circular velocity; Vrot: rotation velocity; σv: velocity dispersion). Vp2 /Vc2 is the true fraction of pressure support against the gravity, while Vrotv is an empirical approximation common in the literature. The pink regions show Vrotv < 3 — an approximate criterion in the literature for defining a dynamically hot disk, and Vp2 /Vc2 > 0.5 — where the pressure support dominates the role of support against the disk gravity.

Galaxy evolution

When do galaxies assemble most of their mass?

The TRICEPS galaxies are likely progenitors of low-z massive spirals or ellipticals given the deep gravitational potential.

Comparison of the Vc curves of the TRICEPS galaxies with rotation curves of low-z spiral galaxies (gray lines, Lelli et al. 2016b; Di Teodoro et al. 2021, 2023). The right panel shows a zoom-in view around the TRICEPS sample. The pink band represents the range of Vc (Davis et al. 2016) of the most massive population of local ellipticals.

Science questions

How do the galaxy kinematic parameter evolve across cosmic time?

The TRICEPS targets are in between the redshift evolutionary trends followed by previous ionized gas and molecular gas tracer observations.

Variations of σv (left) and Vrotv (right) with redshift. The AGN and non-AGN galaxies in the TRICEPS sample are shown as stars and circles, respectively. The non-paired and the paired galaxies are shown in blue and red, respectively. Galaxies compiled in Rizzo et al. (2024) are shown as the gray dots. The red solid lines show the best-fit relations from Rizzo et al. (2024; fit using cold gas tracers), with the best-fit intrinsic scatters. The black dashed lines show the predictions of the DI model from Wisnioski et al. (2015; followed by ionized gas tracers), with gray shadows representing Q ∈ [0.67, 2]. The inset plots are the zoom-in views around the median values of the TRICEPS galaxies.

[CII] data

ALMA [CII] data at 0.4-1.3 kpc and 30 km s-1 resolutions. We use 3DBarolo to analysis the gas kinematics.

Channel maps (a), moment maps (b), position-velocity diagrams (c), and parameter radial profiles (d) of all TRICEPS targets. Please refer to Lin, Lelli et al. for details.

Contact us

Lingrui Lin: lingruiphd@smail.nju.edu.cn


Federico Lelli: federico.lelli@inaf.it

Heading…

What drives the gas turbulence in high-z galaxy disks?

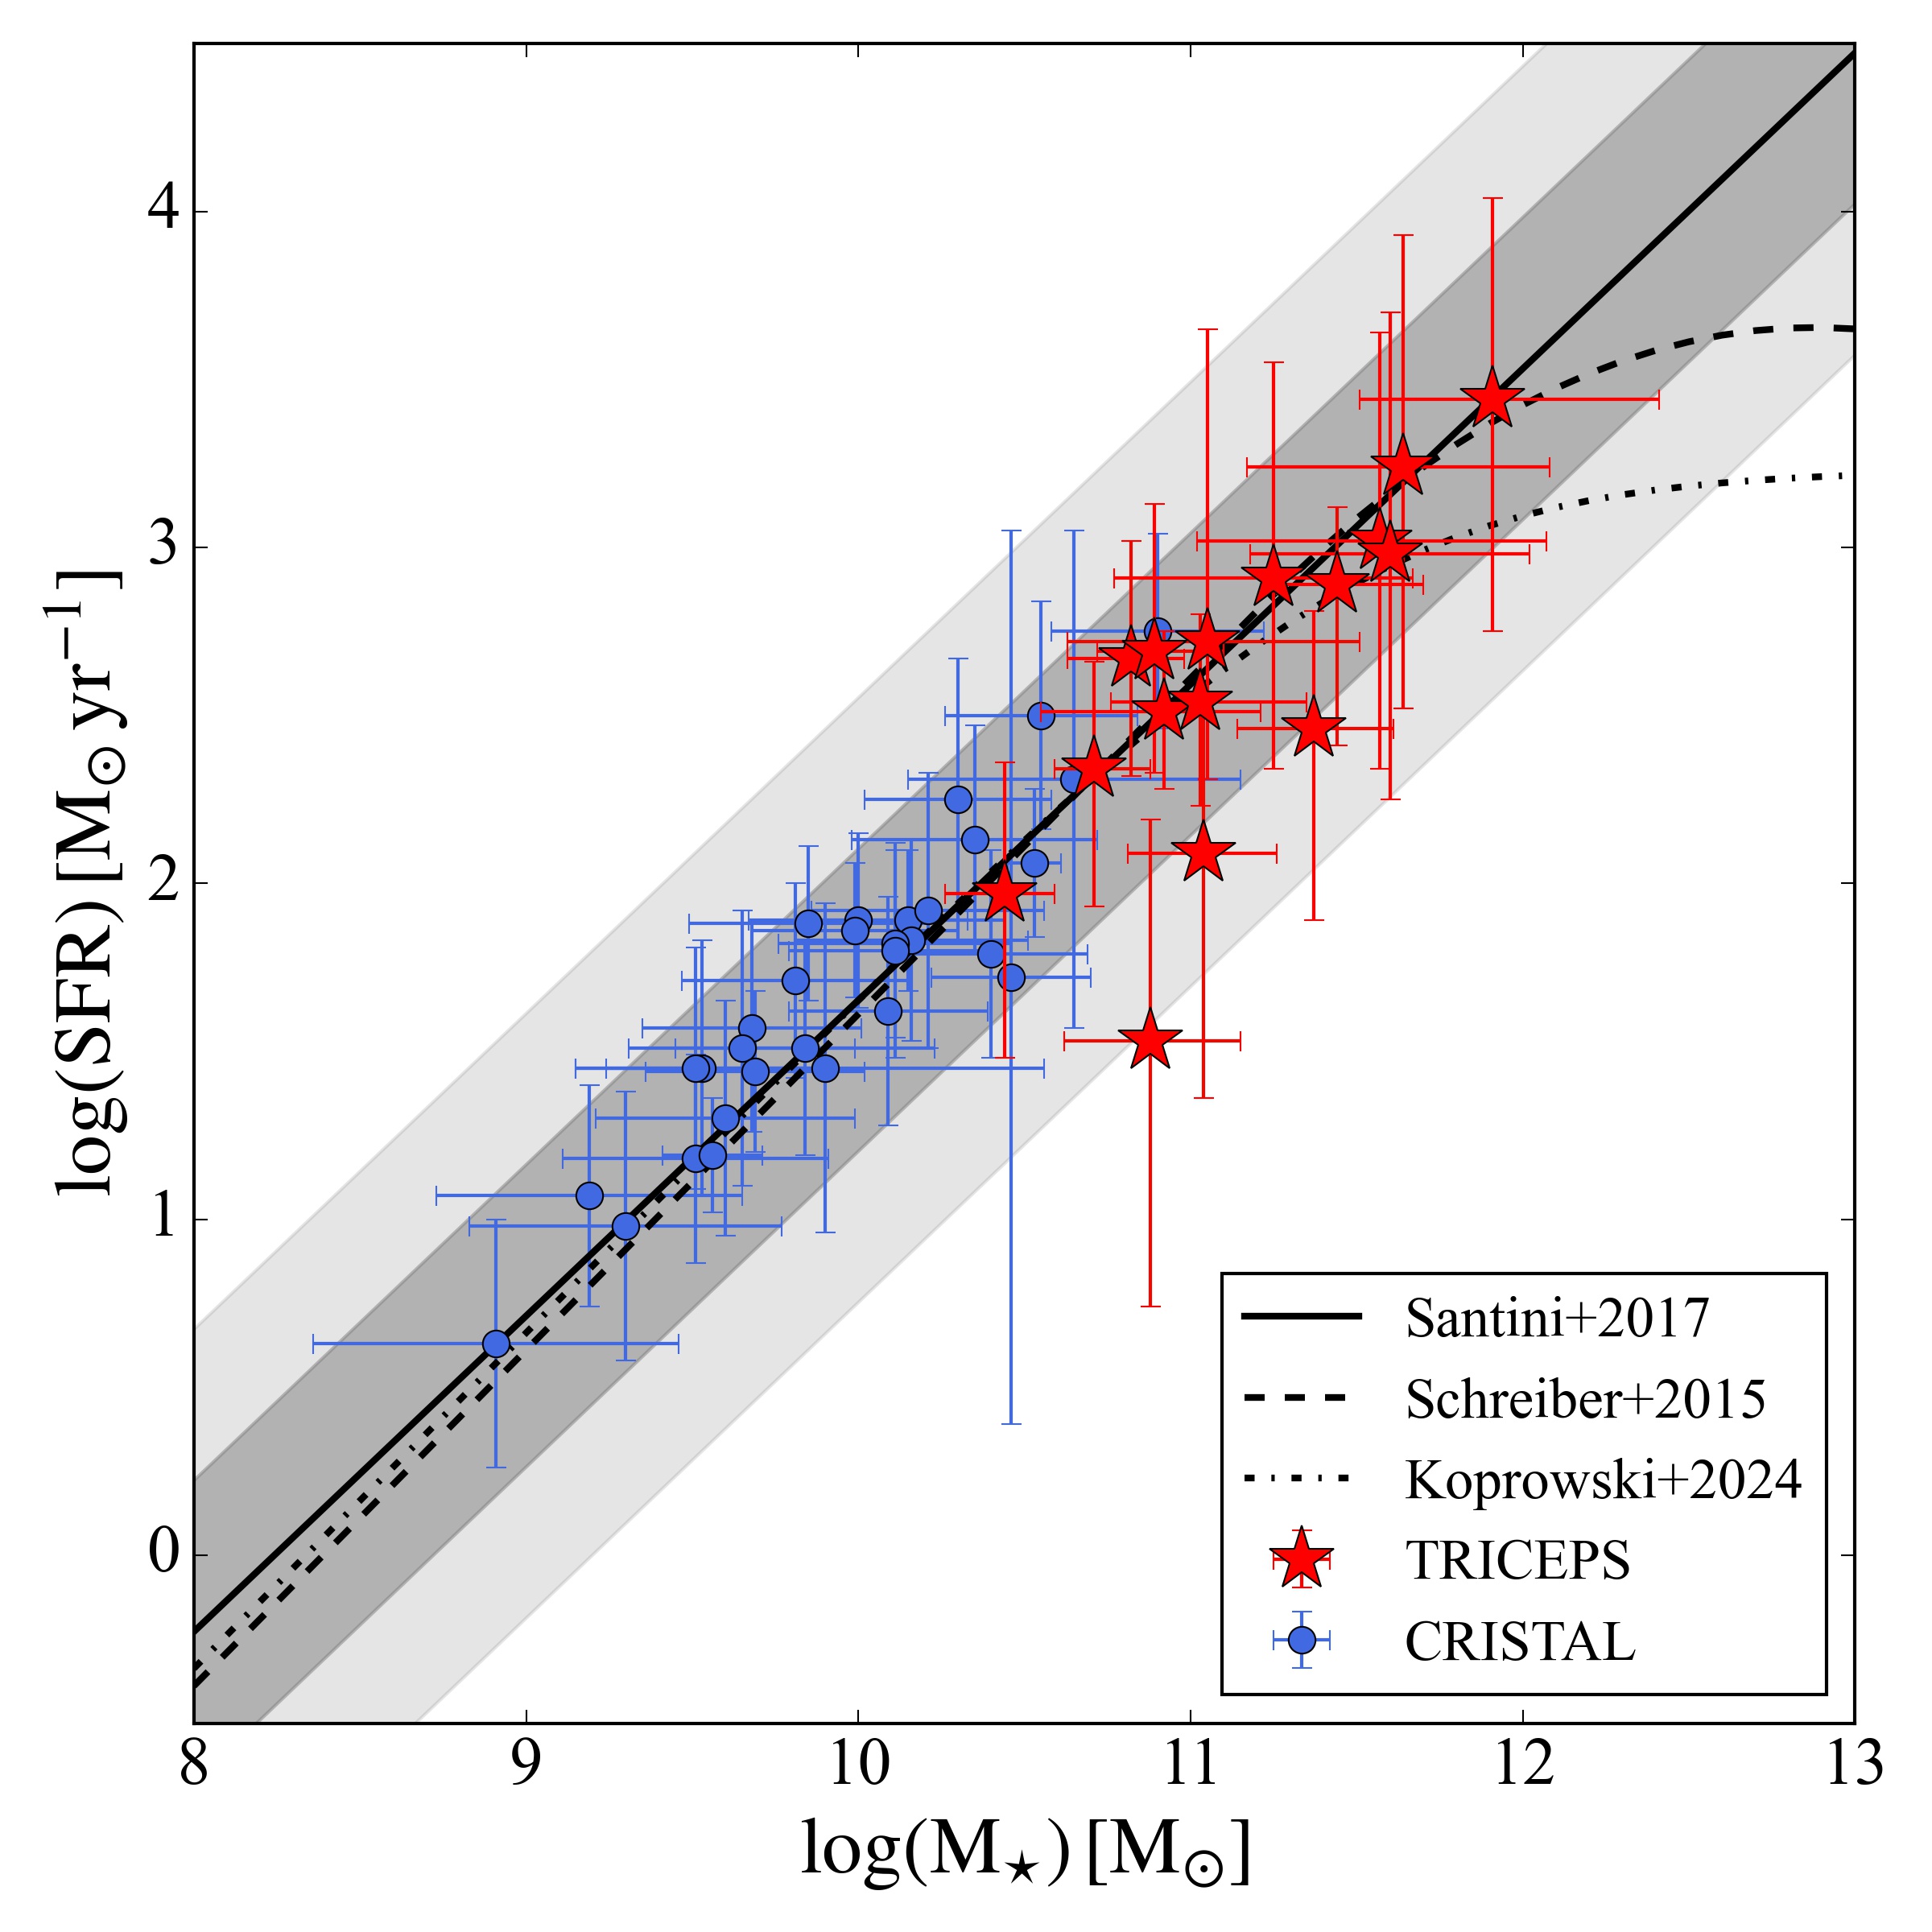
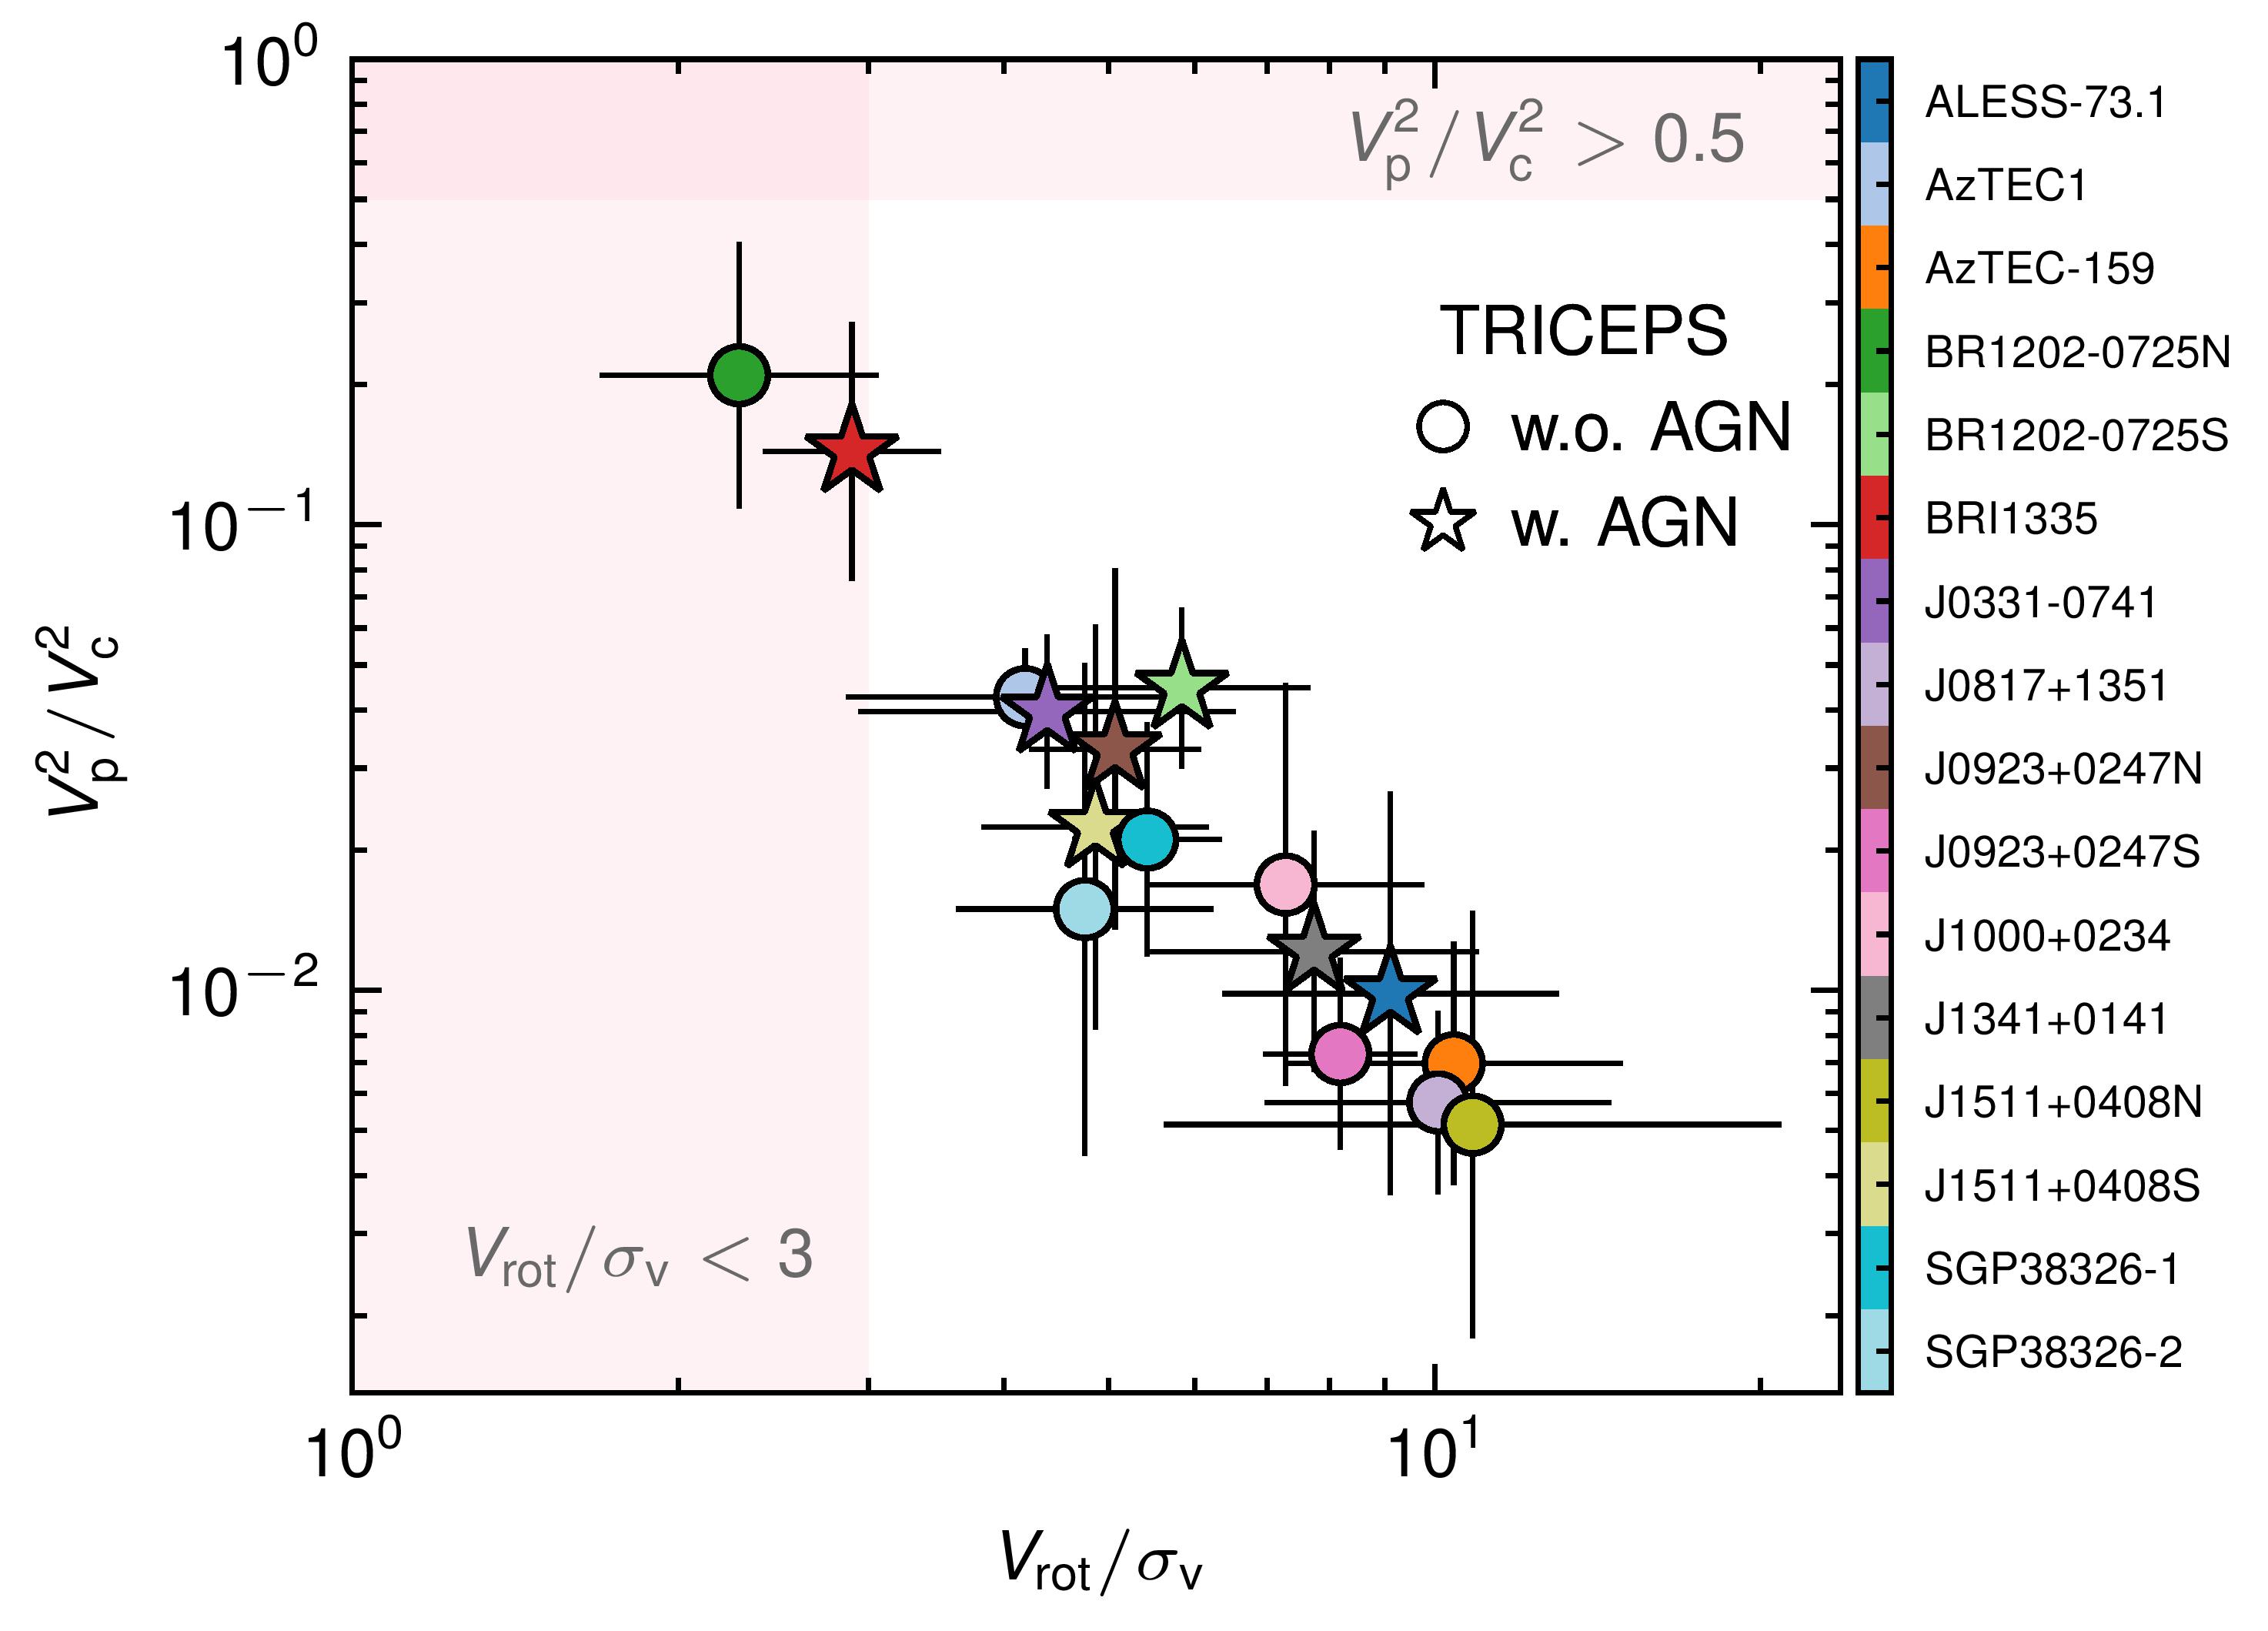
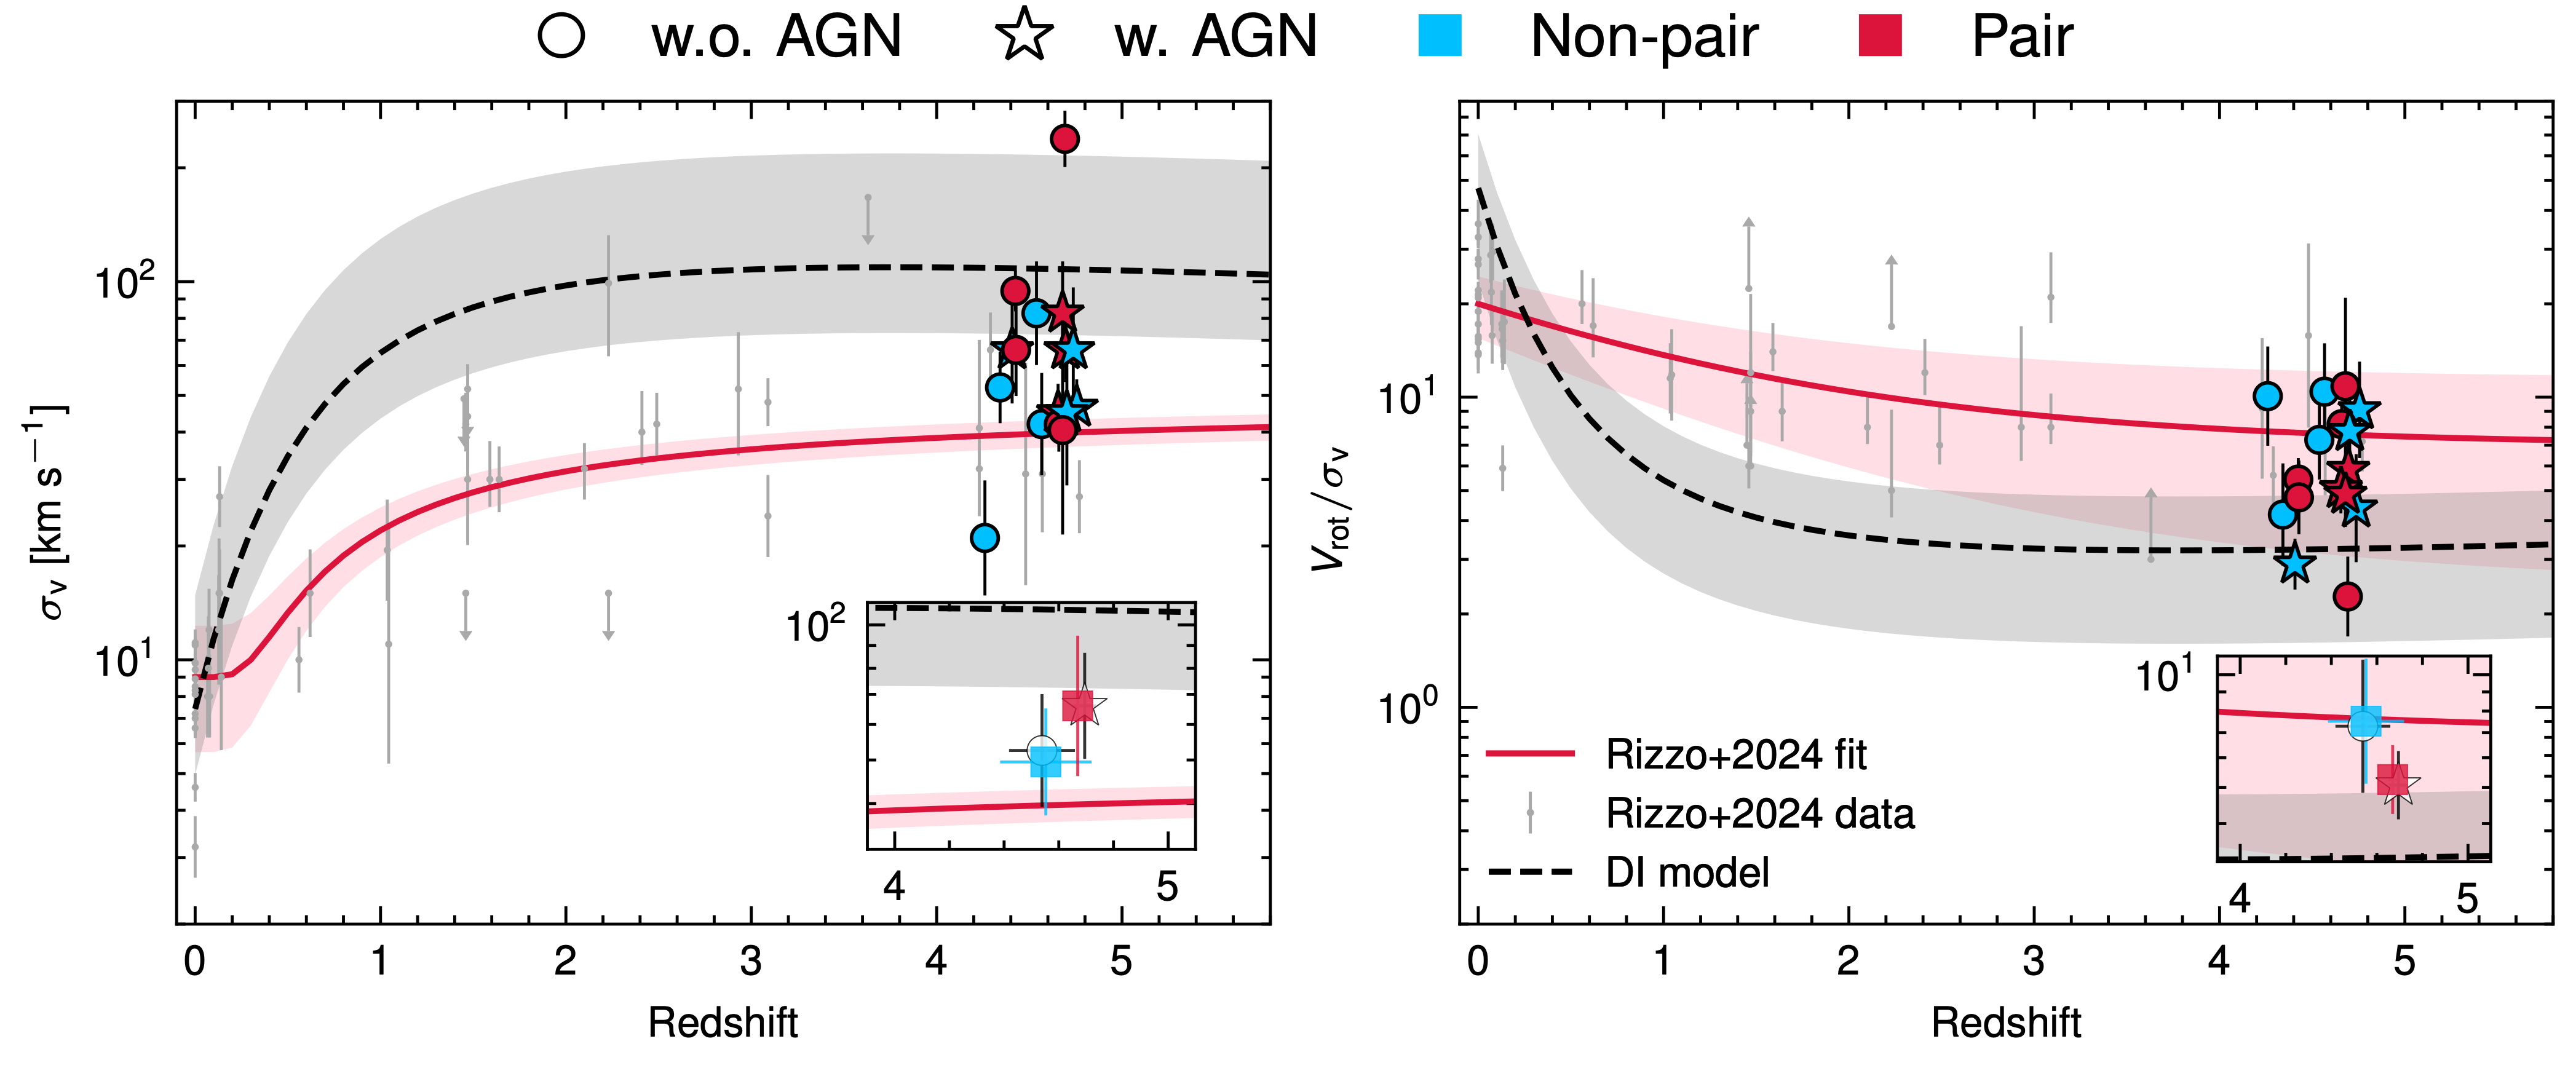
The TRICEPS targets follow turbulence-driving models involving only stellar feedback. No clear cuts are found between AGN and non-AGN hosts, and between paired and non-paired galaxies.

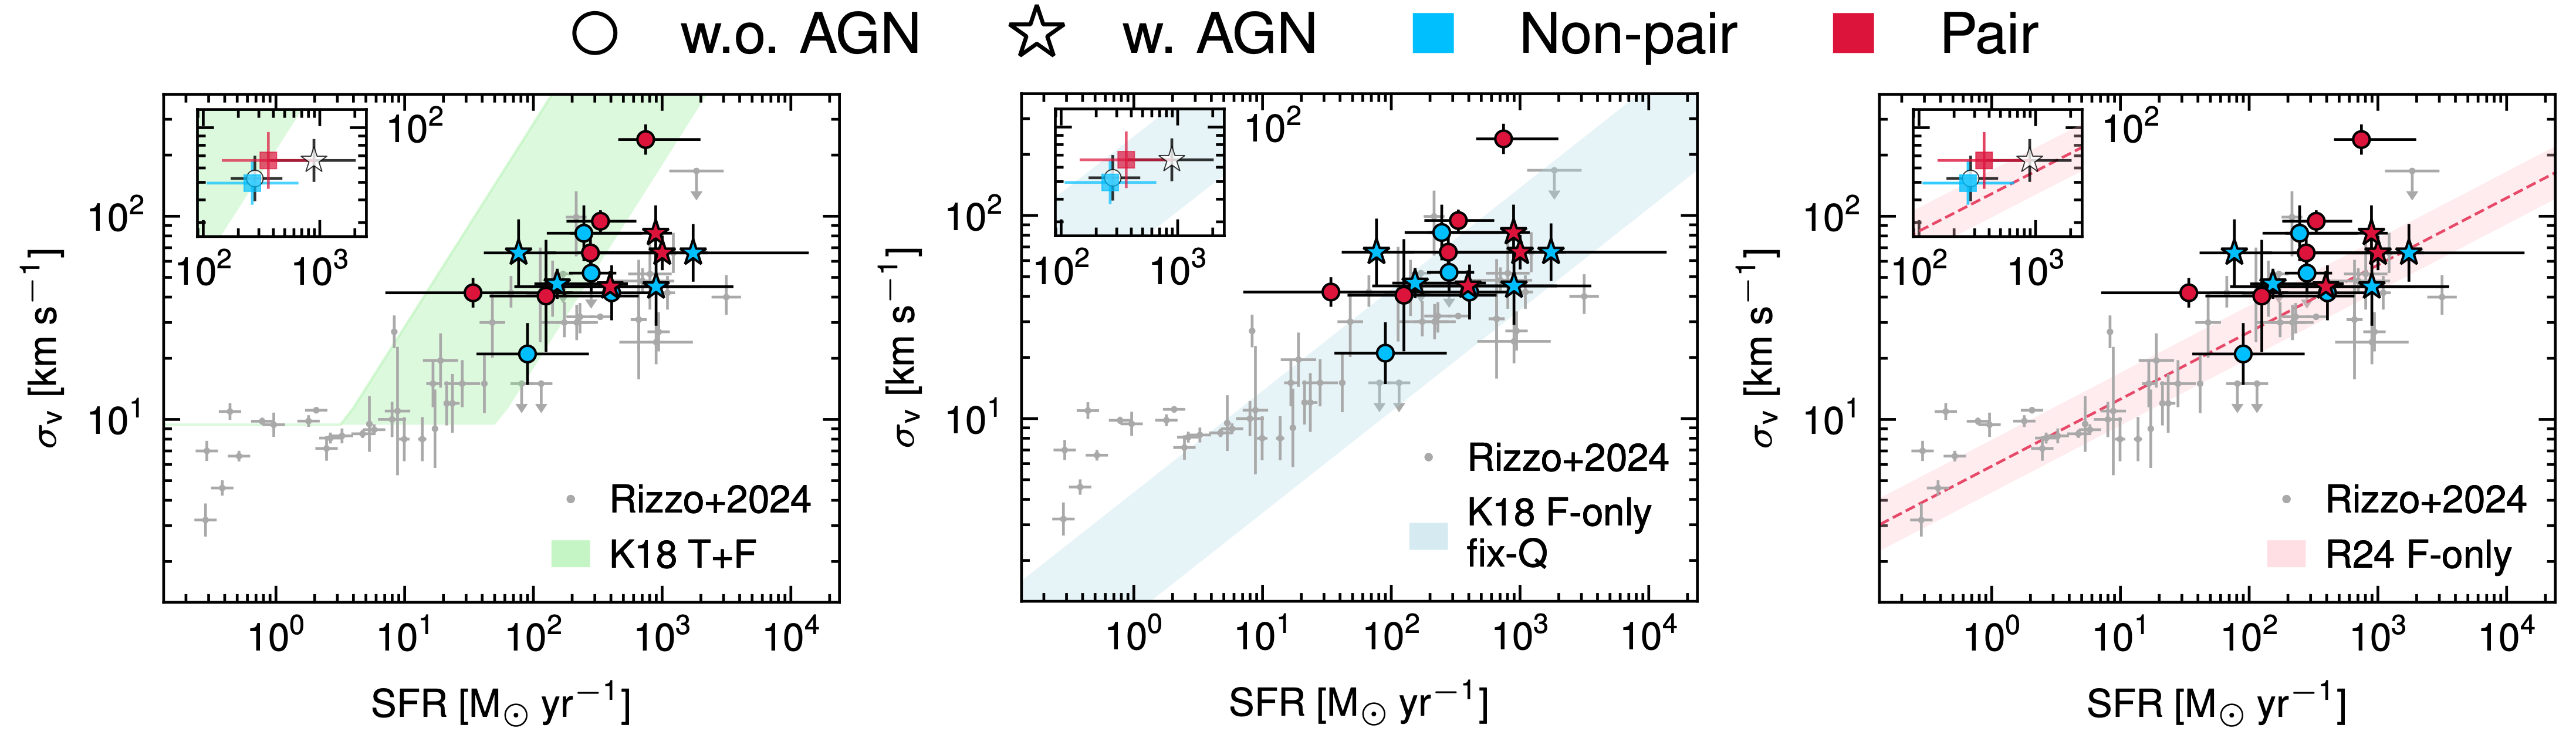
Comparison of the TRICEPS galaxies with the σv-SFR relations predicted by three different turbulence-driving models. The σv-SFR relations predicted by the K18 transport+feedback (T+F) model (left, green shaded region, Krumholz et al. 2018), the K18 feedback-only (F-only) fixed-Q model (middle, blue shaded region, Krumholz et al. 2018), and the R24 F-only model (right, red line and shaded region, Rizzo et al. 2024) are overlaid. The shaded regions for the K18 models represent the range expected for the TRICEPS sample (see the main paper), while the shaded region for the R24 model is the best-fit intrinsic scatter.