Edge-on galaxies are the only objects outside of our Galaxy where it is possible to study the vertical distribution of matter in the disks directly. It allows us to study the three-dimensional distribution of matter in galaxies. Among this class of objects, super-thin galaxies with an axis ratio of a/b>10 deserve special attention. The existence of a large population of pure disk super-thin galaxies is difficult to explain in the framework of the modern hierarchical model of galaxy formation, since the constant processes of merging and absorption should lead to “heating” of the galaxy disk. It is believed that the existence of super-thin galaxies with a ratio of the visible axes a/b>10 is possible only if there is a massive dark gala around them (Zasov et al. 1991, Sov. Astron. Lett., 17, 374; Sotnikova et al. 2006, Astron. Lett., 32, 649; Khoperskov et al., 2010, Astron. Nachr., 331, 731) Therefore, the study of super-thin disks is extremely important for understanding the physical processes of the formation and evolution of galaxies in the Universe.
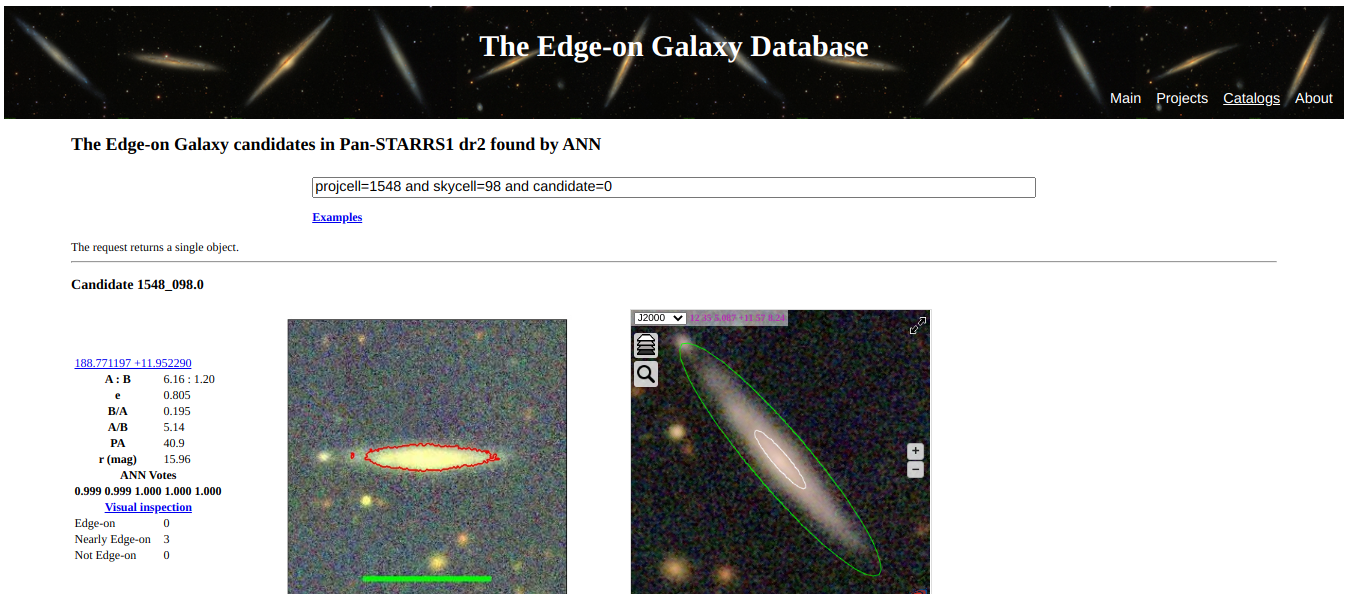
Our sample includes galaxies with the axis ratio (a/b)O > 10 on blue POSS plates and (a/b)E >= 8.5 on the red ones. We selected only galaxies with declination > -25 degree and the major axis a<4 arcmin. We excluded from the sample any galaxy with known measurements on its internal kinematics (rotation curves or HI-line width) except some cases for understanding the sistematics and cross-correlations. The observations are carrying out using 6-meter telescope with the focal image reducer SCORPIO. The grating VPH 1800 allows us to measure the redshift of emission lines with precision of 5-10 km/s. Our galaxy sample is based on a catalog of flat galaxies (RFGC, Karachentsev et al. 1999, Bull. Spec. Astrophys. Obs., 47, 5).
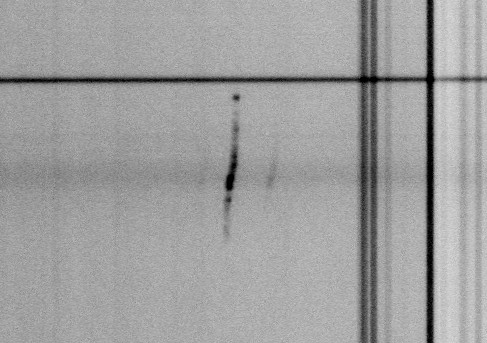
Spectrum of the galaxy RFGC3563 after performing the procedures of primary reduction and linearization.
Spectral data reduction was performed in a standard way using the ESO MIDAS procedures. It includes the bias subtraction, the correction for small-scale sensitivity variations of the CCD matrix, the cosmic rays removal, and the lianerization of spectra.
The galaxies' rotation curves are constructed measuring H-α line velocities along the slit. We fit the rotation curves with the polyex - function (M. Persic, P. Salucci and F. Stel, Mon. Not. Roy. Astron. Soc. 281, 27 (1996)) to determine the parameters of the rotation curve.
The original polyex function is applied only to already folded rotation curves. We are upgrading this feature. Our polyex function is symmetrical and takes into account the effect of line broadening due to the cosmological redshift.
cz = cz0 - (1+cz/c)*V0*(1-exp(-abs(R)/Rpe))*(1+alpha*abs(R)/Rpe)*sign(R) ,
where
cz - the observed redshift multiplied by the speed of light.
cz0 - cz of the center of the galaxy.
V0 - the characteristic velocity of the rotation curve in the polyex model.
Rpe - the dynamic radius of the galaxy in the polyex model.
alpha - the slope of the outer part of the rotation curve.
R = (r-R0) - the distance from the center of the galaxy along the gap.
r - coordinate of this point along the slit
R0 - the position of the center of the galaxy.
To take into account the symmetry of the rotation curve function along the gap relative to the center of the galaxy, a sign (R) function was added - which returns "-1" for R <0 and "+1" for R> 0. This equation is valid for the rotation curve growing along the slit. If the speed of the galaxy decreases along the gap, then the formula is corrected by an additional constant.
As a first approximation, to determine the center and amplitude of the rotation curve, we used the fitting of the observed rotation curve with its centrally symmetric copy. For this we used a cubic spline.
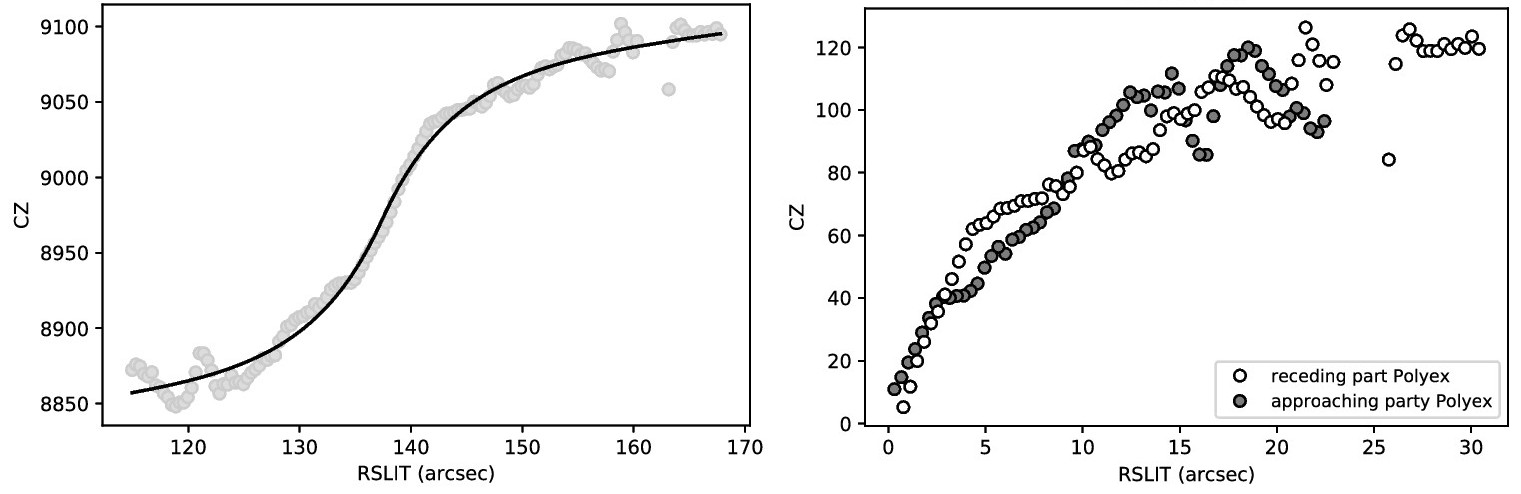
The left panel shows the observed rotation curve of the RFGC3563 galaxy (gray circles) and its approximation by the polyex function (black solid line). The right panel shows the same rotation curve, but folded relative to its center, found using the polyex function. White circles are the moving part of the rotation curve, Gray circles are the moving part of the rotation curve.
Using the polyex function for the galaxy RFGC3563, we determined the following parameters:
cz0 = 8971.62 ± 1.15
V0 = 93.72 ± 9.69
R0=137.39 ± 0.18
Rpe=5.88 ± 0.87
alpha=0.06 ± 0.02
We obtained the same processing and parameters for 90 galaxies from our sample. We compare the galaxy speeds we received with the radio data:
<x> = -5.5 + -2.9 Sigma = 19.8 N (measurements) = 46 N (unique galaxies) = 23
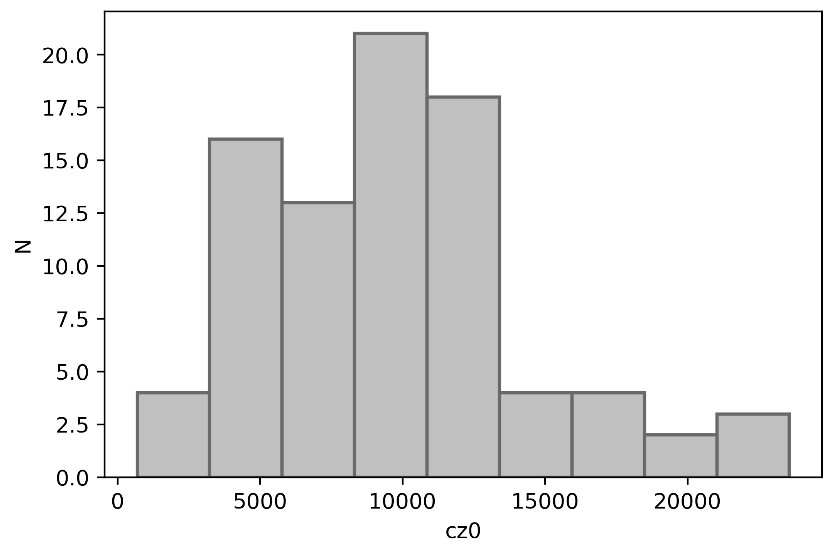
The distribution of the sample galaxies by the heliocentric radial velocity (cz0). N is the number of galaxies in the range cz0. Median redshift of the galaxies in our sample is 8979 km/s that roughly corresponds to 120 Mpc.
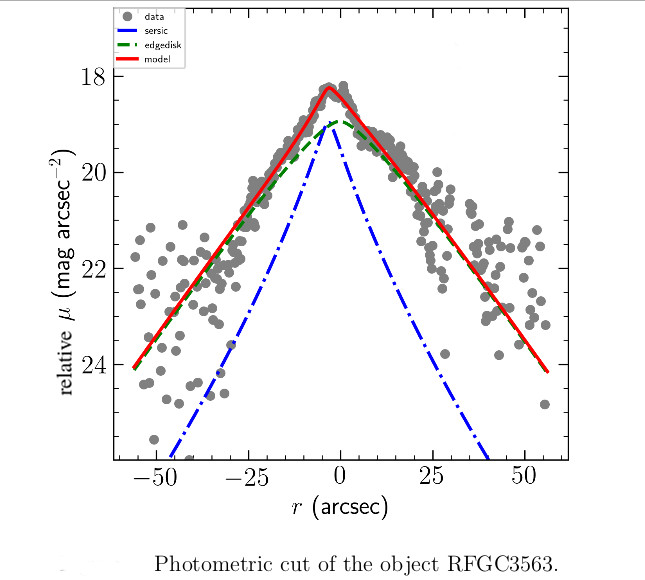
Modern mass surveys of the sky, for example, Pan-STARRS, allow extensive research into a large number of galaxies. Photometry of flat galaxies is a non-trivial task due to the specific shape and distribution of light in edge - on galaxies. Photometry of edge - on galaxies requires a separate approach, taking into account the specifics of these objects.
We decompose the galaxy sample described above using the Pan-starrs sky survey.
The decomposition of galaxies was carried out by a program written by Aleksander Mosenkov (mosenkovAV@gmail.com), based on the software package Galfit (Peng, C. Y., Ho, L. C., Impey, C. D., & Rix, H.-W. 2002, AJ, 124, 266) and IMFIT (Erwin P., 2015, ApJ, 799, 226). In simplest use, Galfit allows one to fit an ellipsoid model to light profiles in an image. For more complicated situations, it can model highly detailed shapes that are curved, irregular, lopsided, ringed, truncated, or have spiral arms. One can mix and match these features within a single component model, or can add them to other components to create complex shapes. IMFIT provides an ability specify a set of one or more 2D image functions (e.g., elliptical exponential, elliptical Sérsic, circular Gaussian) which are added together to generate a model image. This model image is then matched to the input image by adjusting the 2D function parameters via nonlinear minimization of the total χ2.
Fitting the image with a 2D model using program of Aleksander Mosenkov will allow you to evaluate the exponential radial and vertical scale of the disc, its model integral magnitude, the contribution of the bulge, thin and thick discs.
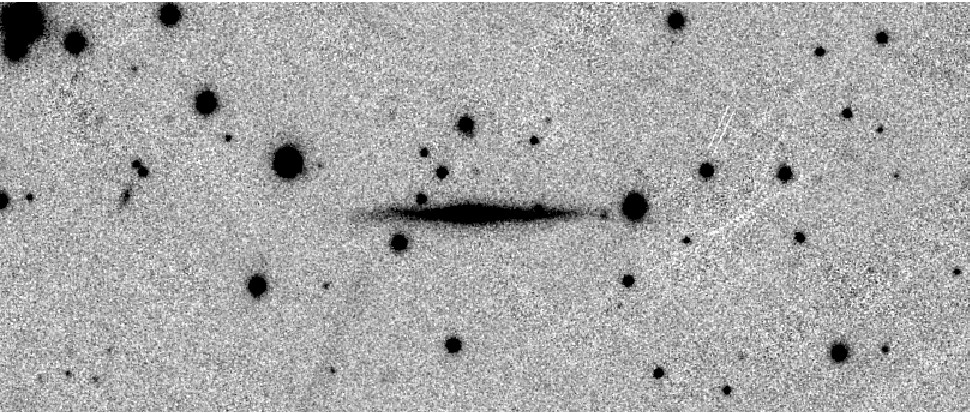
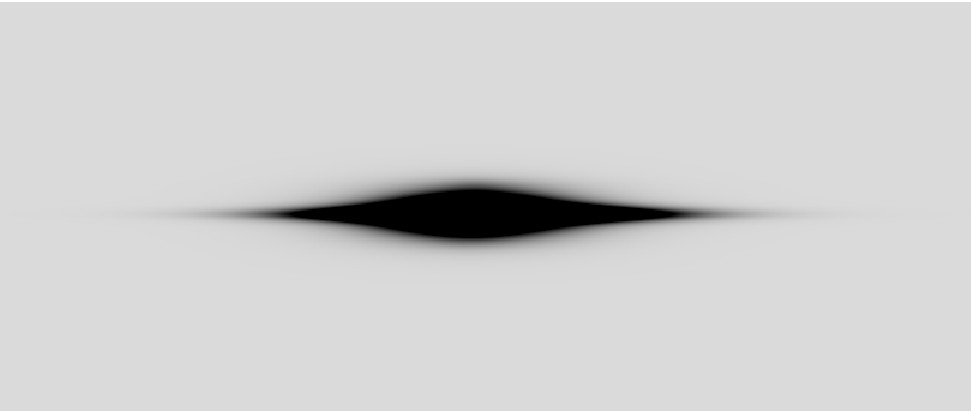
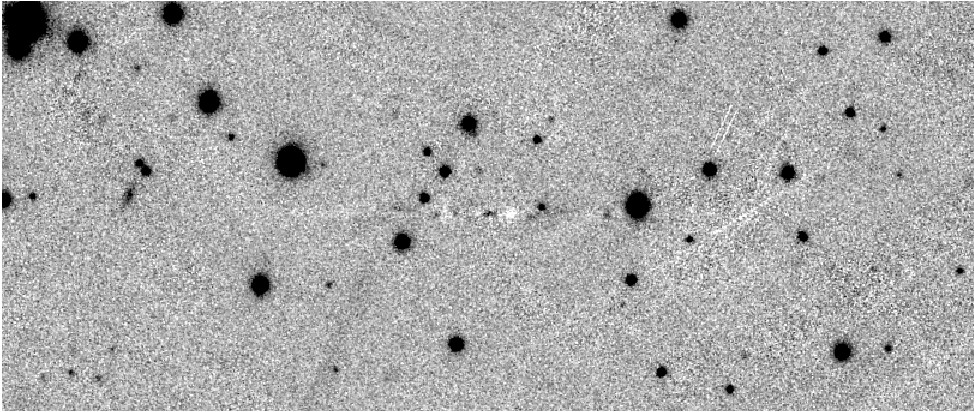
We show the approximation with a two-component model (“edgedisk” + “sersic” model, see work Peng, CY, Ho, LC, Impey, CD, & Rix, H.-W. 2002, AJ, 124, 266) of a galaxy profile by the example of RFGC3563. Bright star formation regions and background stars and galaxies were masked when approximating. The upper-left panel shows the galaxy region from Pan-starrs in the filter g. The approximating model is represented on the upper right tab of the panel, and the result of subtracting the model from the original frame.