Evolution of the Galaxy Populations in Clusters

Oğuzhan Çakır 1 , Sinan Aliş 1 , F. Korhan Yelkenci 1 , Süleyman Fişek 1 , E. Kaan Ülgen 1,2

  • 1 Istanbul University, Istanbul, Turkey
  • 2 Istinye University, Istanbul, Turkey

Abstract

In this study, we present our preliminary results on the evolution of galaxy populations in galaxy clusters detected in the CFHTLS-W1. Our sample consists of 3284 galaxy clusters between 0.1 < z < 1 with a median of zmed ~ 0.5. We investigated the evolution of the fraction of early and late-type galaxies. Cluster galaxies (i.e. members) were selected based on a probability derived from their photometric redshifts and they were classified as early (Ell and S0) and late-type (Sbc, Scd, Irr, SB) by their spectral types given by the SED-fitting algorithm.

Article 1

Introduction

Galaxy clusters are the largest known gravitationally bound structures in the universe. They include hundreds, and even thousands of galaxies. Besides their cosmological importance (Voit, 2005; Allen, Evrard, Mantz, 2011) they are ideal laboratories for studying galaxy evolution. Galaxies can be divided into different categories such as red/blue, early/late-type based on their colors and/or morphological features. Early-type galaxies usually are redder than late-type galaxies which implies that star formation is not ongoing in these galaxies. Thus, they are mostly called as "red-and-dead" galaxies. However, there are also passive late-type galaxies (Masters, K.L., 2010; Mahajan, S., 2020) which have undergone severe ram-pressure stripping in dense environments (Boselli et al., 2016). A regular galaxy cluster is dominated by mainly early-type galaxies with a ratio of (E+S0)/(Sp) ~ 4-5 (Bahcall, 1999). However, Butcher and Oemler (1978, 1984) showed that clusters at intermediate redshift have higher blue (late-type) galaxy fraction with respect to clusters at lower redshifts (i.e. Butcher - Oemler effect).

Cluster Catalog

We use a sample of 3284 galaxy clusters from the CFHTLS-W1 region that detected by the WaZP cluster-finder algorithm (Benoist, C., 2019) which is also described in Dietrich et al. (2014). Our cluster catalog ranges between 0.1 < z < 1. WaZP finds clusters based on their position in the sky and photometric redshifts (e.g. 2+1 dimensions). Galaxy densities are characterized with wavelets and then cylinder which contains the structure is analyzed in different redshift slices. Final detections are ranked by their signal-to-noise ratio. In this study, we keep clusters with a  S / N > 3.

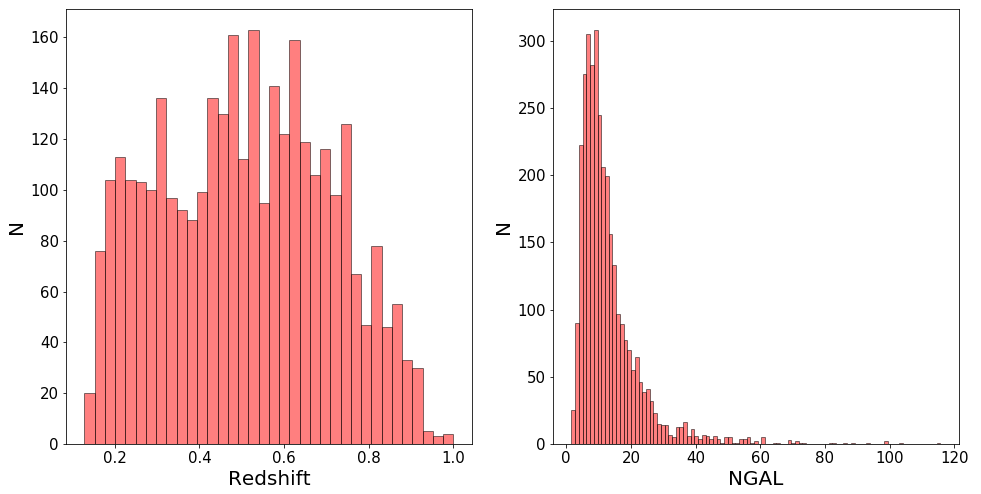
Figure 1: On the left: Redshift distribution of the 3284 clusters. On the right: Richness distribution of the same sample.

Heading…

Galaxy Populations in Clusters

In order to investigate fractions of different populations one needs to determine likely member galaxies around clusters. Our membership list was constructed with the approach described in Castignani & Benoist (2016). In this approach, photometric redshifts, magnitudes and cluster-centric radii of galaxies are used to determine the membership probabilities. Here, in this study we take these probabilities and for each cluster we use the total probabilities obtained from the likely member galaxies. Our final member galaxy catalog contains nearly 130.000 galaxies for the total cluster sample.

Once member galaxies are determined, we then divide them into early and late-type populations by using their SED template solution given by Le Phare (Arnouts et al., 1999; Ilbert et al., 2006). In CFHTLS, four spectral template from Coleman, Wu and Weedman (1980) were used with an additional template for starburst galaxies from Kinney et al. (1996). Therefore we have five different spectral types given by Le Phare. We group these spectral types as early-type (Ell), and late-type (Sbc, Scd, Irr, SB).

Fractions for early and late-type galaxies are computed as follows: 

\ \ \ \ \ \ \ \ f_{early} = \frac{(N_{Ell})}{NGAL}
\ \ \ \ \ \ \ \ f_{late} = \frac{(N_{Sp}+N_{Irr}+N_{SB})}{NGAL}

Figure 2:On the left panel:​ 2D histogram of redshift vs richness for early-type galaxies. On the right panel:​​ Same histogram for late-type galaxies. Color code indicates the fractions (the redder the color, the higher the fraction).

In Figure 2 we present the early and late-type fractions as a function of redshift and richness in 2D histograms where clusters are binned according the their redshifts.

It can be seen that the early-type fraction increases towards higher richnesses and lower redshifts as expected from the Morphology-Density Relation shown by Dressler (1980).

On the other hand, the early-type (late-type) fractions decrease (increase) towards higher redshifts which is consistent with the statement of Butcher-Oemler (1984).

Below, in addition, we investigate the fractions for three different cluster-centric radii and three richness cuts (see Fig. 3). Each row represents different richness cuts whereas each column represents different cluster-centric radius.

In Figure 3, from top to bottom, rows are for richness cuts NGAL<10, 10<NGAL<20, and 20<NGAL, respectively. Similary, from left to right columns are for cluster-centric radii of rcl<0.5 Mpc, 0.5<rcl<1 Mpc, and rcl<1 Mpc, respectively. With rcl<0.5 Mpc we aim to investigate the fractions in cluster cores, whereas within the region of 0.5<rcl<1 Mpc we investigate the fractions in the cluster outskirts.

For poor clusters (e.g. NGAL<10), dependence of the evolution of the fractions to cluster-centric radius is weak while for rich clusters (e.g. NGAL>20) the dependency to the radius is more prominent. In the case of cluster outskirts, this evolution seems to occur much slower. This could be associated with the morphology-density relation since the density is lower in the outskirts than in the cores.

Figure 3: ​ Early and late-type fractions as a function of redshift for different richness cuts and for different cluster-centric radii. Red and blue points and lines represent early and late-type galaxies, respectively. Error bars for each measurement denote standard deviation around the median of the corresponding fraction.

Heading…

Evolution of the Late-Type Fraction

Since the famous work of Butcher and Oemler (1984), evolution of the late-type galaxy fractions in clusters studied in many works (see for a list of papers in the caption of Fig. 5). 

We give our results about the late-type fraction in Figure 4. In order to characterize better the evolution we use redshift bins narrower than what has been used in Figure 3. Data points shown in Figure 4, obtained with binning clusters with a zbin=0.05 as our sampling is enough to do that. 

As it was shown by many studies before (see references in Fig. 5), fraction of late-type galaxies increases with redshift. This trend was already shown with larger redshift bins in Figure 3 for different richness cuts and cluster-centric radii. In order to reduce error bars on the fraction measurements, we apply a richness cut to the sample as being NGAL>10 and NGAL>20. The former cut contains 1708 galaxy clusters whereas the latter contains 510 clusters.

Power-law models were applied to the each panel in Figure 4 to characterize the trend. Following equations are obtained for each richness cut:

\ \ \ f_{late} = (0.34 \pm 0.02)(1+z)^{(0.90 \pm 0.10)} \ \ \ (NGAL>10)
\ \ \ f_{late} = (0.26 \pm 0.02)(1+z)^{(1.45 \pm 0.13)} \ \ \ (NGAL>20)

Figure 4: On the left: Blue/late fraction evolution for richness cut NGAL > 10. On the right: Same plot for richness cut NGAL > 20.

We compare our results with previous studies in Figure 5. In this plot, we keep late-type galaxy fractions with relative errors less than 30% of their fraction measurement. Abbreviated studies in the legend are listed in the caption. To be able to compare the environmental effects (e.g. richness of the cluster) we show our results for two richness cuts with fractions obtained from literature.

In this comparison we keep studies with measurements of fractions based on morphological types or galaxy colors, especially based on relative positions of cluster galaxies with respect to red-sequence in the color-magnitude diagrams (de Lucia et al., 2007; Lagana et al., 2009; Zenteno et al., 2011). 

Figure 5: Evolution of late-type galaxy fraction in galaxy clusters. Results obtained in this work are compared with previous studies. Two different richness cuts for this study are shown in the plot. (BO84: Butcher, H., & Oemler, A., 1984; Marg00: Margoniner, V. E., De Carvalho, R. R., 2000; Hai09: Haines, C. P., et al., 2009; Hai13: Haines, C.P., et al., 2013; A06: Andreon, S., et al., 2006; Urq10: Urquhart, S. A., et al., 2010; RS95: Rakos, K. D., Schombert, J. M., 1995; Fabri91: Fabricant, D. G., et al., 1991; Tran05: Tran, K. H., et al., 2005; vD00: van Dokkum, P. G., et al., 2000; Koda01: Kodama, T., Bower, R. G., 2001; Fair02: Fairley, B. W., et al., 2002).

Heading…

References

Allen, S. W., Evrard, A. E., Mantz, A. B. 2010, ARA&A, 49, 409

Andreon, S., Quintana, H., Tajer, M., Galaz, G., & Surdej, J. 2006, MNRAS, 365, 915

Arnouts, S., et al. 1999, MNRAS,  310, 540

Bahcall, N. A., Formation of Structure in the Universe. Edited by Avishai Dekel and Jeremiah P. Ostriker. Cambridge : Cambridge University Press, 1999., p.13

Benoist, C., Euclid Consortium 2019, A&A, 627, A23

Boselli A., et al., 2016, A&A, 596, A11

Butcher, H., & Oemler, A. 1978, ApJ, 219, 18

Butcher, H., & Oemler, A. 1984, ApJ, 285, 426

Castignani, G., & Benoist, C. 2016, A&A, 595, A111

Coleman, G. D., Wu, C., & Weedman, D. W. 1980, ApJS, 43, 393

De Lucia, G., et al. 2007, MNRAS, 374, 809

Dietrich J. P., et al. 2014, MNRAS, 443, 1713

Dressler, A. 1980, ApJ, 236, 351

Fabricant, D. G., McClintock, J. E., & Bautz, M. W. 1991, ApJ, 381, 33

Fairley, B. W., Jones, L. R., Wake, D. A., Collins, C. A., Burke, D. J., Nichol, R. C., & Romer, A. K. 2002, MNRAS, 330, 755

Haines, C. P., Smith, G. P., Egami, E., et al. 2009a, ApJ, 704, 126

Haines C. P., et al., 2013, ApJ, 775, 126

llbert, O., et al. 2006, A&A, 457, 841

Kinney, A. L., et al. 1996, ApJ, 467, 38

Kodama, T., & Bower, R. G. 2001, MNRAS, 321, 18

Lagana, T. F., et al. 2009, MNRAS, 394, 357

Mahajan, S., et al. 2020, MNRAS, 491, 398

Margoniner V. E., de Carvalho R. R., 2000, AJ, 119, 1562

Masters, K.L., et al. 2010, MNRAS, 405, 783

Nakata, F., et al. 2005, MNRAS, 357, 679

Rakos, K. D. & Schombert, J. M. 1995, ApJ, 439, 47

Rodriguez-Munos, L., et al. 2019, MNRAS, 485, 586

Tran, K., et al. 2005, ApJ, 619, 134

Urquhart, S. A., Willis, J. P., Hoekstra, H., & Pierre, M. 2010, MNRAS, 406, 368

van Dokkum, P. G., et al. 2000, ApJ, 541, 95

Voit, G. M. 2005, RvMP, 77, 207

Zenteno, A., et al. 2011, ApJ, 734, 3

Conclusions and Future Work

We investigate the early and late-type galaxy fractions in galaxy clusters detected in the CFHTLS-W1 region. A total of 3284 galaxy clusters are examined with a total of 130.000 member galaxies.

We also characterize the evolution of the late-type fraction with a power-law. In general, our fractions are in good agreement with previous studies. A clear trend of increasing late-type fraction with redshift is visible. Our cluster sample span a redshift range of 0.1 < z < 1.0 and in this range our sampling for each redshift bin is quite high. Thus we could obtain a continous and extensive evolution for the late-type galaxy fractions.

In this study, we grouped galaxies based on their SED fitting obtained spectral types. There are studies also investigate this fraction as the star-forming (active) and non-starforming (passive) galaxies (Nakata et al., 2005; Rodriguez-Munos et al., 2019). 

For future, we aim to explore the fractions obtained from the color-magnitude relations (Ulgen et al., in prep.) of the clusters as it was the classic definition of the Butcher and Oemler (1984) and it has been used in many studies.