The VLT-MUSE and ALMA view of the MACS 1931.8-2635 brightest cluster galaxy

Bianca-iulia Ciocan 1 , Bodo Ziegler 1 , Miguel Verdugo 1 , Kevin Fogarty 2,3

  • 1 University Of Vienna, Department Of Astrophysics, Vienna, Austria
  • 2 Division of Physics, Math, and Astronomy, California Institute of Technology, Pasadena, CA, USA, Pasadena, CA, USA
  • 3 Space Telescope Science Institute, Baltimore, MD, USA, Baltimore, MD, USA

Abstract

The centres of massive galaxy clusters are often dominated by brightest cluster galaxies (BGCs), suggesting a strong link between the formation and evolution of the BCG and that of the host cluster, with the environment distinguishing BCG evolution from that of massive ellipticals from the field. Many studies have investigated, both observationally and theoretically, the mechanisms which drive the build-up of the stellar mass of BCGs, and the results favour the scenario in which BCG formation and growth follows a two-phase hierarchical formation: rapid cooling and in-situ star formation at high redshifts followed by a subsequent growth through repeated mergers. However, many BCGs located in cooling-flow clusters, still exhibit signatures of significant star formation (SF) and also harbour large amounts of molecular gas. Cooling flows were shown to explain the on-going SF and AGN activity of BCGs through thermally unstable cooling of the ICM into warm and cold clouds sinking towards the SMBH (e.g. chaotic cold accretion model).
Based on VLT-MUSE optical integral field spectroscopy, we investigate the BCG of the massive cool-core CLASH cluster MACS 1931.8-2635 at redshift of z=0.35, with respect to its spatially resolved star formation activity, ionisation sources, chemical abundances, gas and stellar kinematics. The optical IFS data is supplemented by sub-mm ALMA observations (Fogarty et al. 2019), as well as by Chandra X-ray observations, enabling us to link the warm ionised medium to both the molecular gas component and the hot intra-cluster medium, respectively. These multi-wavelength observations offer a comprehensive view of the multi-phase, low-entropy gaseous component confined in the cluster core.
Using a population spectral synthesis code FADO (Gomez and Papaderos 2017) we reliably measure the fluxes of strong emission lines in the optical spectrum, allowing the derivation of electron temperature, electron density, ionisation parameter, (O/H) gas metallicities, ionic abundances, star formation rates and gas kinematics. Diagnostic diagrams based on strong emission line ratios combined with predictions from shock models reveal the ionising sources in different regions for the investigated galaxy. The sub-mm data allowed the derivation of the mass, kinematics, excitation of the CO molecular gas as well as the dust temperature.
Our preliminary results depict a BCG which is actively forming stars (SFR~167 M⊙/ yr), and whose optical features are typical of LINERs, showing composite emission, and thus suggesting a contribution from both star formation, AGN, pAGB stars and possibly shocks to the ionising budget. The emission line ratio maps show a considerable amount of variation, suggesting that the source of the excitation is not localised to a specific region within the BCG. The ALMA observations of the molecular gas and far-infrared continuum around the BCG revealed the largest known reservoir of cold gas in a cluster core with log(M/M⊙)= 10.28. The molecular emission traces the Halpha filaments, and the kinematics of the cold molecular gas are similar to those of the hot ionised gas suggesting that the two gas phases are co-spatial and co-moving. The temperature of several dust clumps was estimated to be ~10 K, too cold to be directly interacting with the surrounding 4.8 keV intra-cluster medium.

Data and Analysis

  • BCG in cool-core CLASH cluster MACS 1931 at z=0.35 
  • Data:
    • ESO-VLT MUSE IFS
    • Data reduction: MUSE pipeline (Weilbacher et al. 2014) & ZAP (Soto et al. 2016)
    • + ALMA data (Fogarty et al. 2019)
  • Data analysis: 
    • pss code FADO  (Gomes & Papaderos 2017) & MUSE Python Data Analysis Framework (Bacon et al. 2016)
      ➡Ionised gas properties: [OII]λ3727, Hβ, [OIII] λ5007, Hα and [NII] λ6584,[S II]λ6718, 6732 fluxes
      ➡Ionisation mechanisms: diagnostic diagrams & radiative shock models (Allen et al. 2008)
      ➡Stellar kinematics: GIST pipeline (Bittner et al. 2019)

The structure and kinematics of the molecular gas

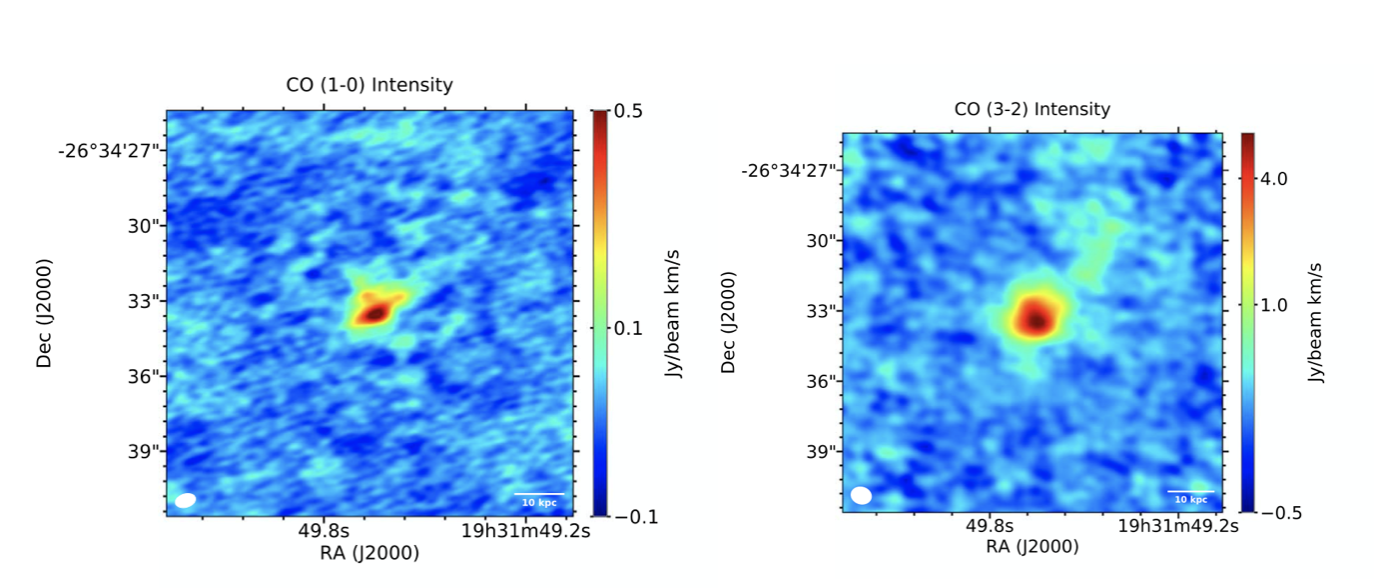
Left: CO(1−0) intensity map. Right:  CO(3−2) intensity map with a naturally weighted clean synthesized beam revealing an extended emission to the northwest. The solid white ellipse in the lower left depicts the beam size. An extended and faint emission feature along the Hα “tail”  to the N-E can be observed.

Mmolecular gas = (1.9±0.3)×1010 M

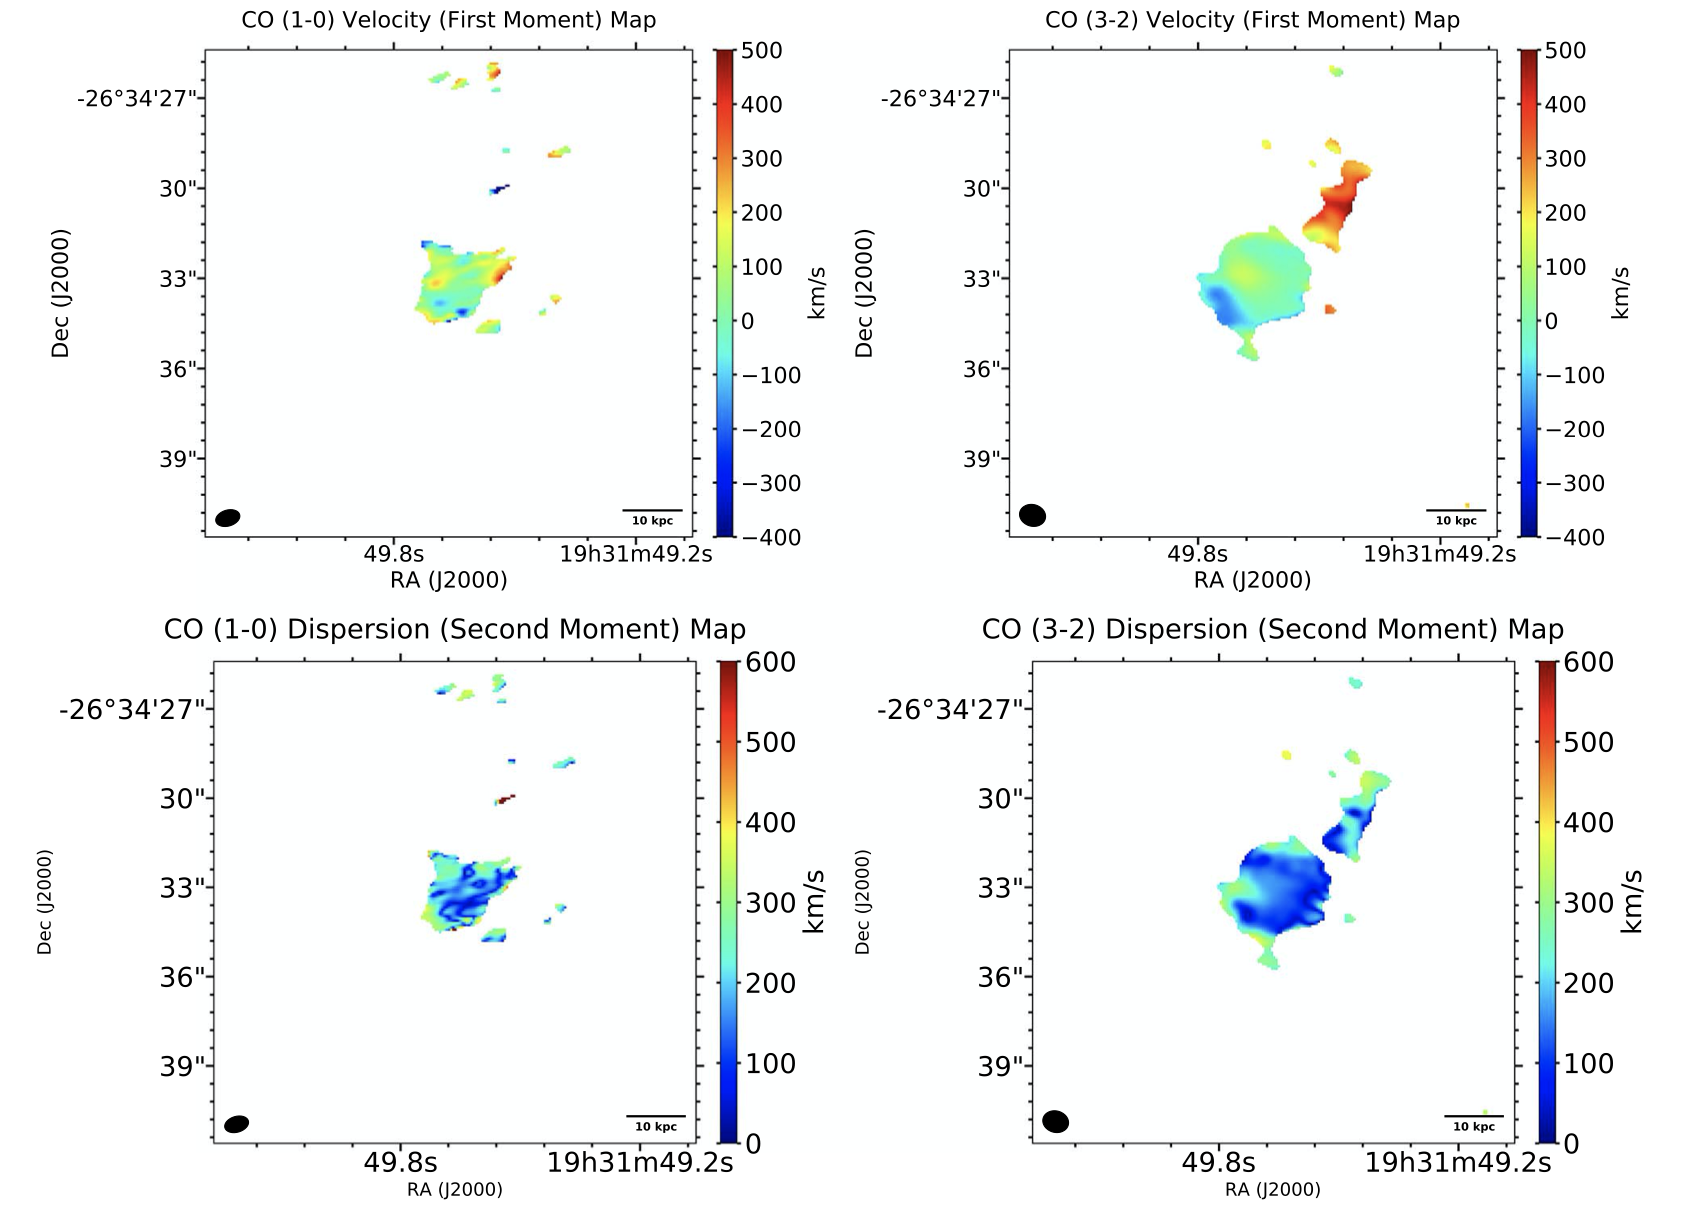
Top: velocity maps of the CO(1−0) and CO(3−2) molecular gas, computed from the first moment analysis of the data cubes. The molecular gas shows no clear morphological symmetry around the core or connection to X-ray cavities that would suggest jet-driven molecular gas outflows.  A systematic offset of ∼300 km s−1 between the gas in the tail and the gas in the core can be observed. Bottom: velocity dispersion maps computed from second moment analysis of the CO(1−0) and CO(3−2) data cubes. All images are masked to exclude regions with <3σ flux detections. The velocity dispersion distributions for the two lines are similar, and range between ∼25 km/s and ~400 km/s. The velocity dispersions are likely dominated by random bulk motion of different clouds.  

The ionised and molecular gas are co-moving and co-spatial.

Dust: Extended rest-frame 892μm and 640μm continuum emission in Bands 6 and 7 ➡ presence of very cold, ∼10 K, dust in parts of the Hα tail, with the highest dust emission relative to CO emission at the end of the tail 

Fogarty et al. 2019, ApJ, 879, 103

The structure and kinematics of the ionised gas

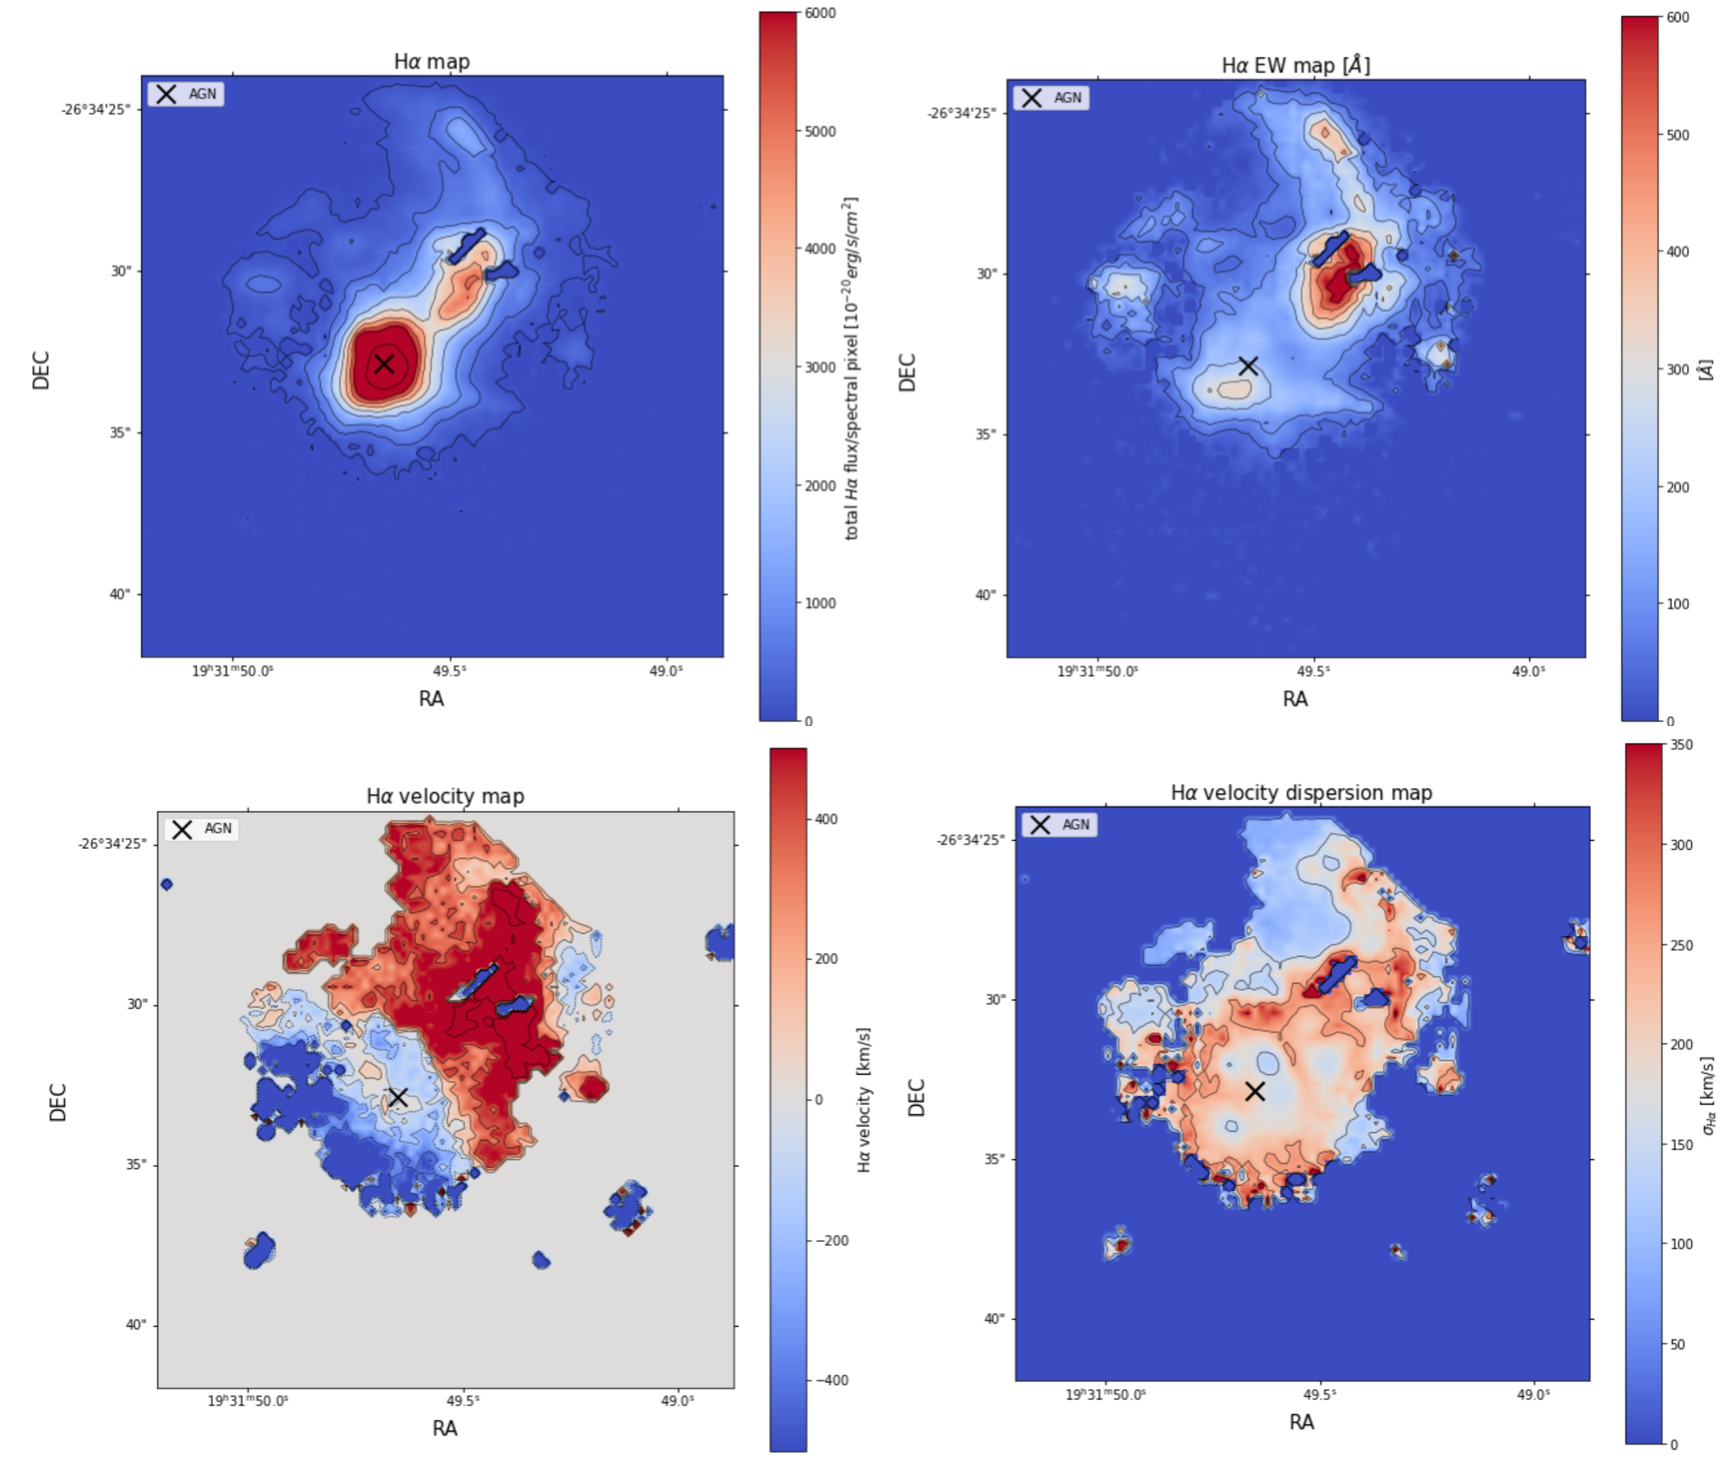
top-left: Spatially resolved Hα emission line. The colourbar shows the flux of the Hα line  in units of 1020 ergs/s/cm. top-right: Hα equivalent width map in [Å]. We observe an elongated Hα tail extending ∼ 30 kpc in N-E direction. bottom-left: Spatially resolved Hα radial velocity map in [km/s]. We observe a strong gradient from positive to negative velocities with respect to the systemic velocity of the BCG. Such velocity profiles are often indicative of rotation but can also arise from uniformly entrained  in- or out- flowing material with an inclination to the plane of the sky.  bottom-right: Spatially resolved Hα velocity dispersion map measured in [km/s].  The extended gas has a consistently low velocity dispersion of the order of ∼ 150 − 250 km/s , but it shows additional peaks in the line-width, suggesting the gas is more kinematically disturbed in these regions. Dispersions are lowest near the core and increase towards the northern and southern peripheries. The  blue and gray background (outside of the contours) in all 4 diagrams corresponds to spaxels with a SNR<10.

Ionised gas properties

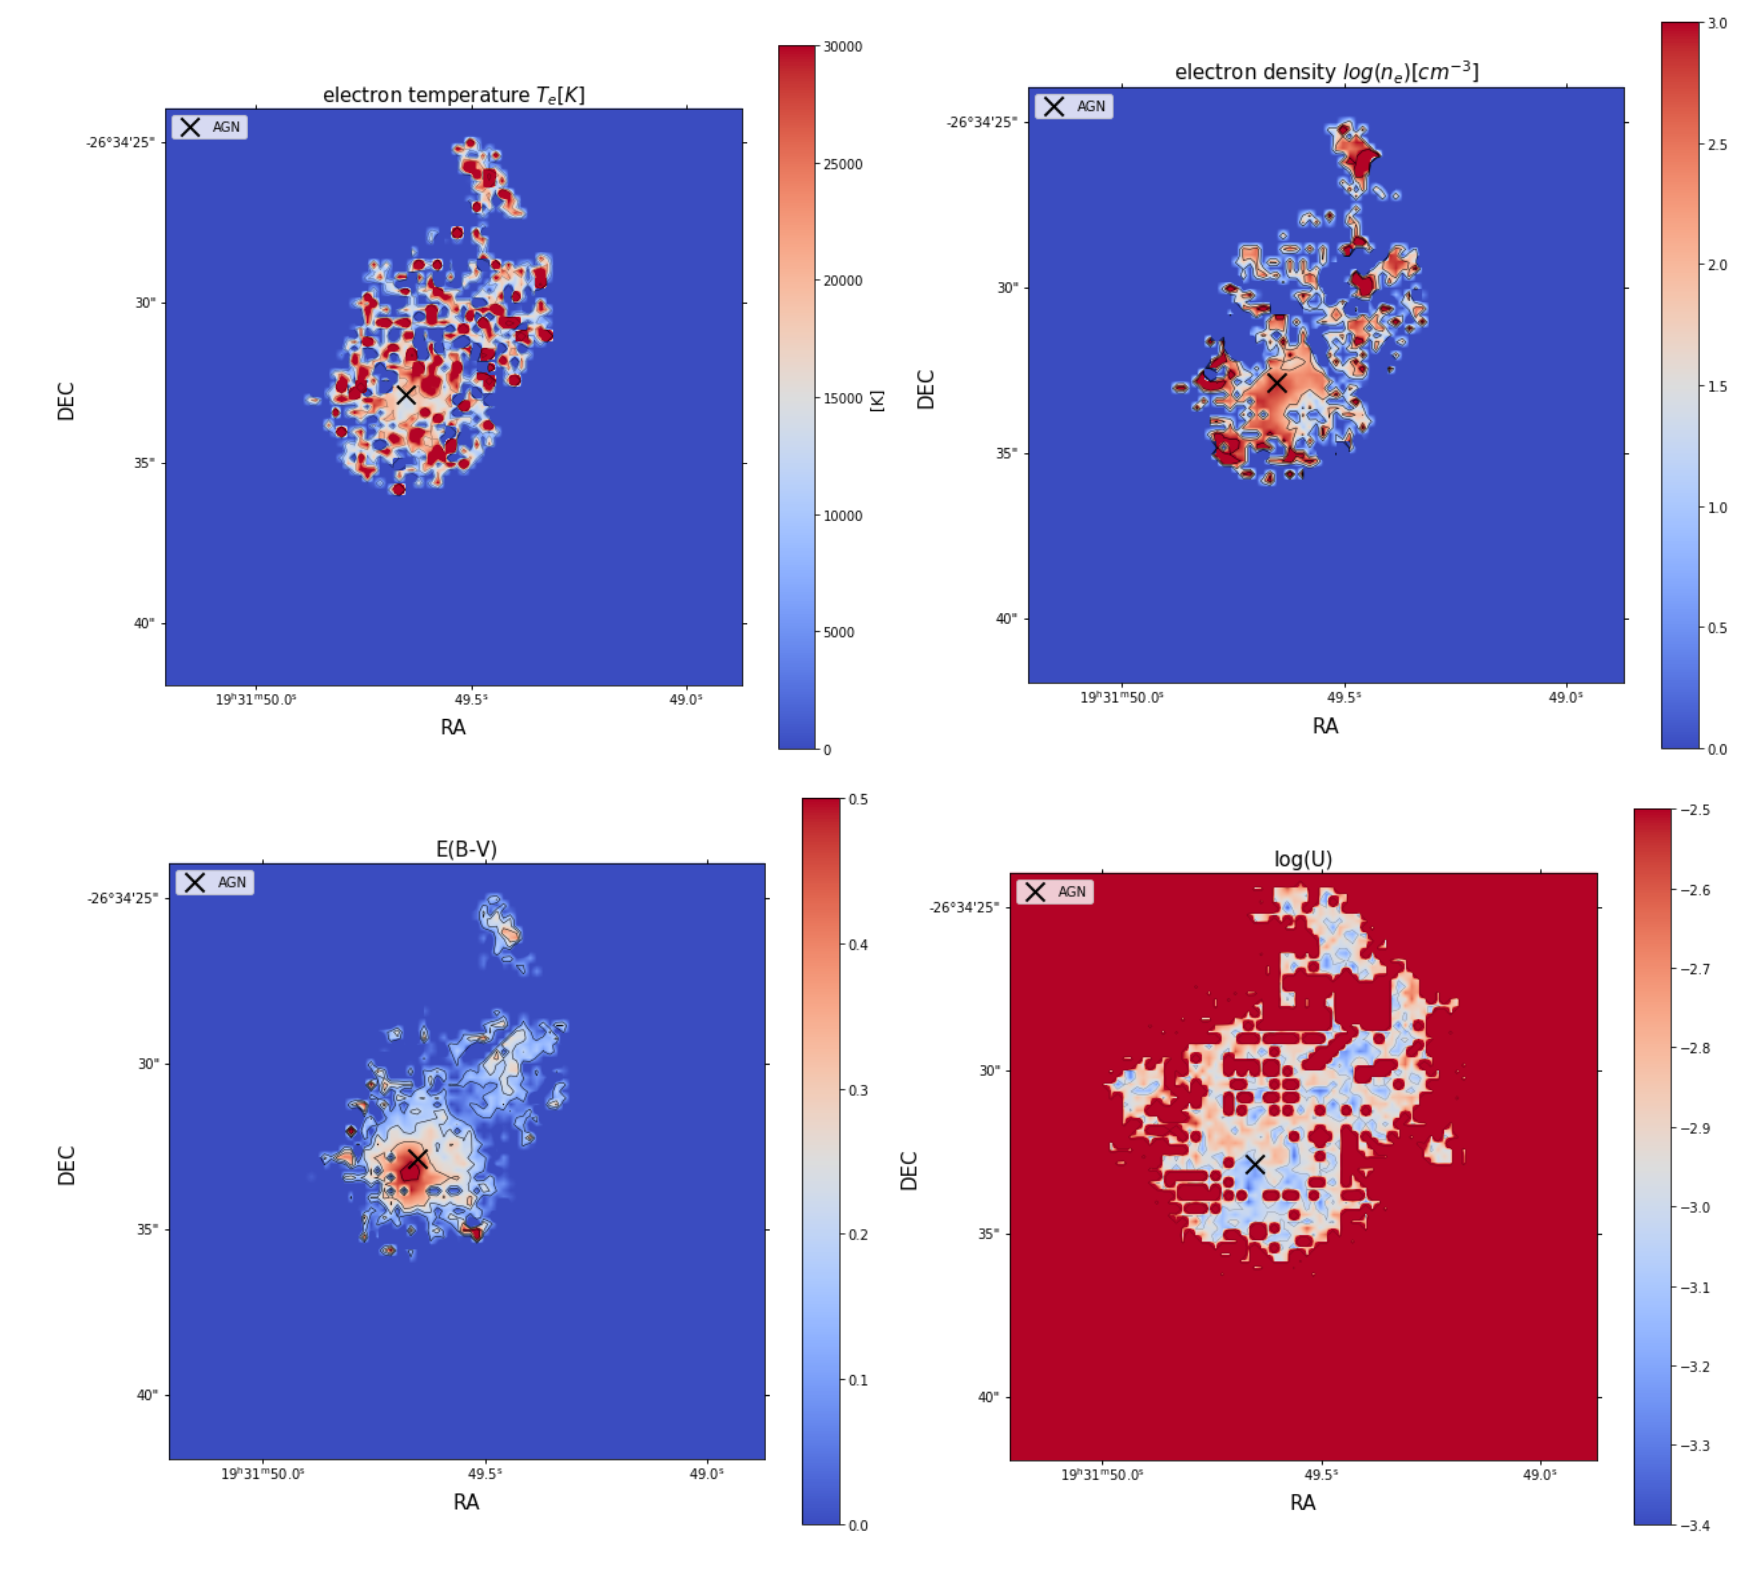
top-left: Electron temperature map in [K] computed frokm the [OIII]λ4958, λ5007, λ4363 emission lines. We measure a median Te ∼ 19532.6 +/-2400 K. top-right: Electron density map as computed from the [S II]λ6718, λ6732 doublet in units of cm-3. We observe a median density of log(ne) ~ 2.11 +/-1.1 cm-3. bottom-left: Colour excess map from the Balmer decrement. We measure a median value of E(B-V)~0.135 +\- 0.0019 with the highest extinction in the BCG core. bottom-right: Ionisation parameter map, computed from the the HII-CH-mistry tool (Pérez-Montero 2014). We measure a median log(U) = −2.93 +\- 0.26. The dark blue and red area, respectively, corresponds to the spaxels with a SNR<10 in the emission lines of interest. 

Diagnostic diagrams combined with predictions from fully radiative shock models from Allen et al. 2008 to distinguish the ionization mechanism of the nebular gas. Each data point represents a spaxel of the MUSE cube with a SNR > 10 in each emission line used for the diagnostic. left:  BPT diagnostic diagram (Baldwin et al. 1981), where we observe mainly compisite emission. middle: Diagnostic diagrams of Kewley et al. 2001  using the [OIII]/Hβ vs [S II]/Hα emission line ratios and righ: [OIII]/Hβ vs [OI]/Hα diagnostic diagram, where we observe mainly LINER emission. The coloured grids represent different shock models computed with MAPPINGS V. We consider a pre-shock density of 1 cm−3, shock velocities ranging from 10-350 km/s, and different metallicities. 


Shocks:  shock models just partially reproduce the measured emission line ratios + weakness of the [O III] λ4363  ➡ lower velocity shocks  play just a minor role as an ionising mechanism 


Seyfert II emission:  just a few spaxels fall in the Seyfert II region + weakness of He II λ4686 Å ➡ ionisation from AGN influences the most central region of the system


➡ The dominant source of ionisation in M1931 BCG is a mix between SF and other energetic processes which can “mimic” LINER emission (photoionisation from O-stars and young starbursts, old pAGB stars (e.g. Loubser et al. 2013); heating of nebular gas through photoionisation by cosmic rays, conduction from hot gas, X-ray photoionisation, turbulent mixing layers or collisional heating (e.g. Donahue et al. 1991,  Begelman et al. 1991) ) 

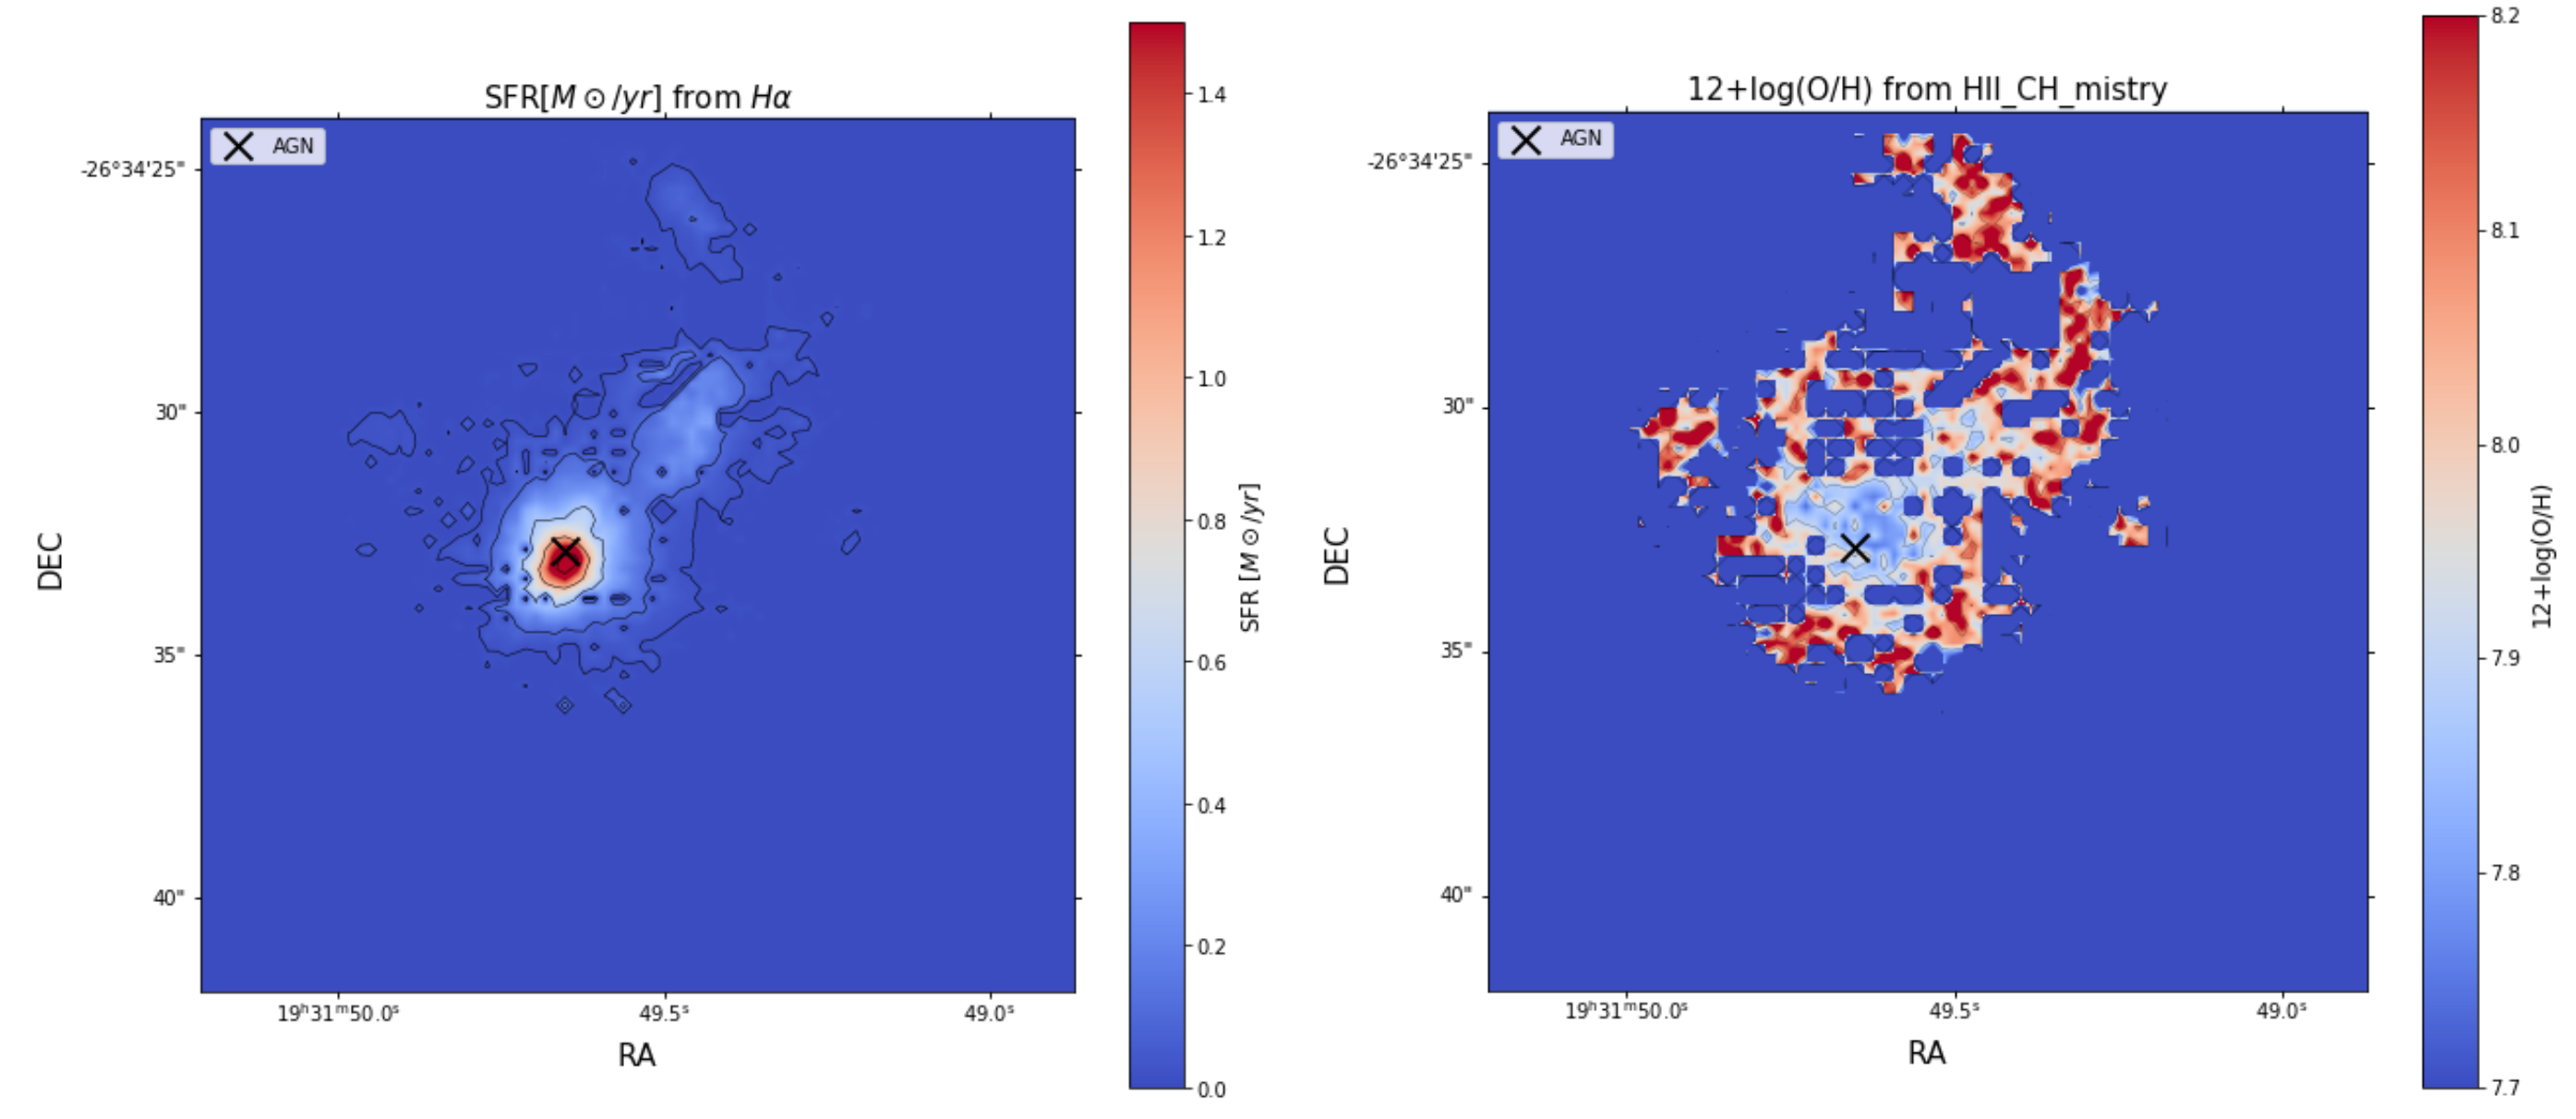
left: Spatially resold SFR map calculated from the extinction corrected Hα emission line in units of M⊙/yr. We measure an integrated SFR ∼ 167 +/- 0.33  M⊙/yr. right: Gas phase metallicity (O/H), as computed by the HII-CH-mistry tool in units of 12+log(O/H). We measure a median 12 + log(O/H) ∼ 8 +/- 0.35, with the lowest (O/H) values in the BCG core, and more enhanced values in the outskirts, in perfect agreement to the ones obtained employing direct Te methods (Pérez-Montero 2017). The M1931 BCG is missing the central metallicity peak which is normally measured in cool core clusters, suggesting bulk transport of gas out to large distances from the centre due to AGN outburst ( in accordance to Ehlert et al. 2011)

Stellar kinematics

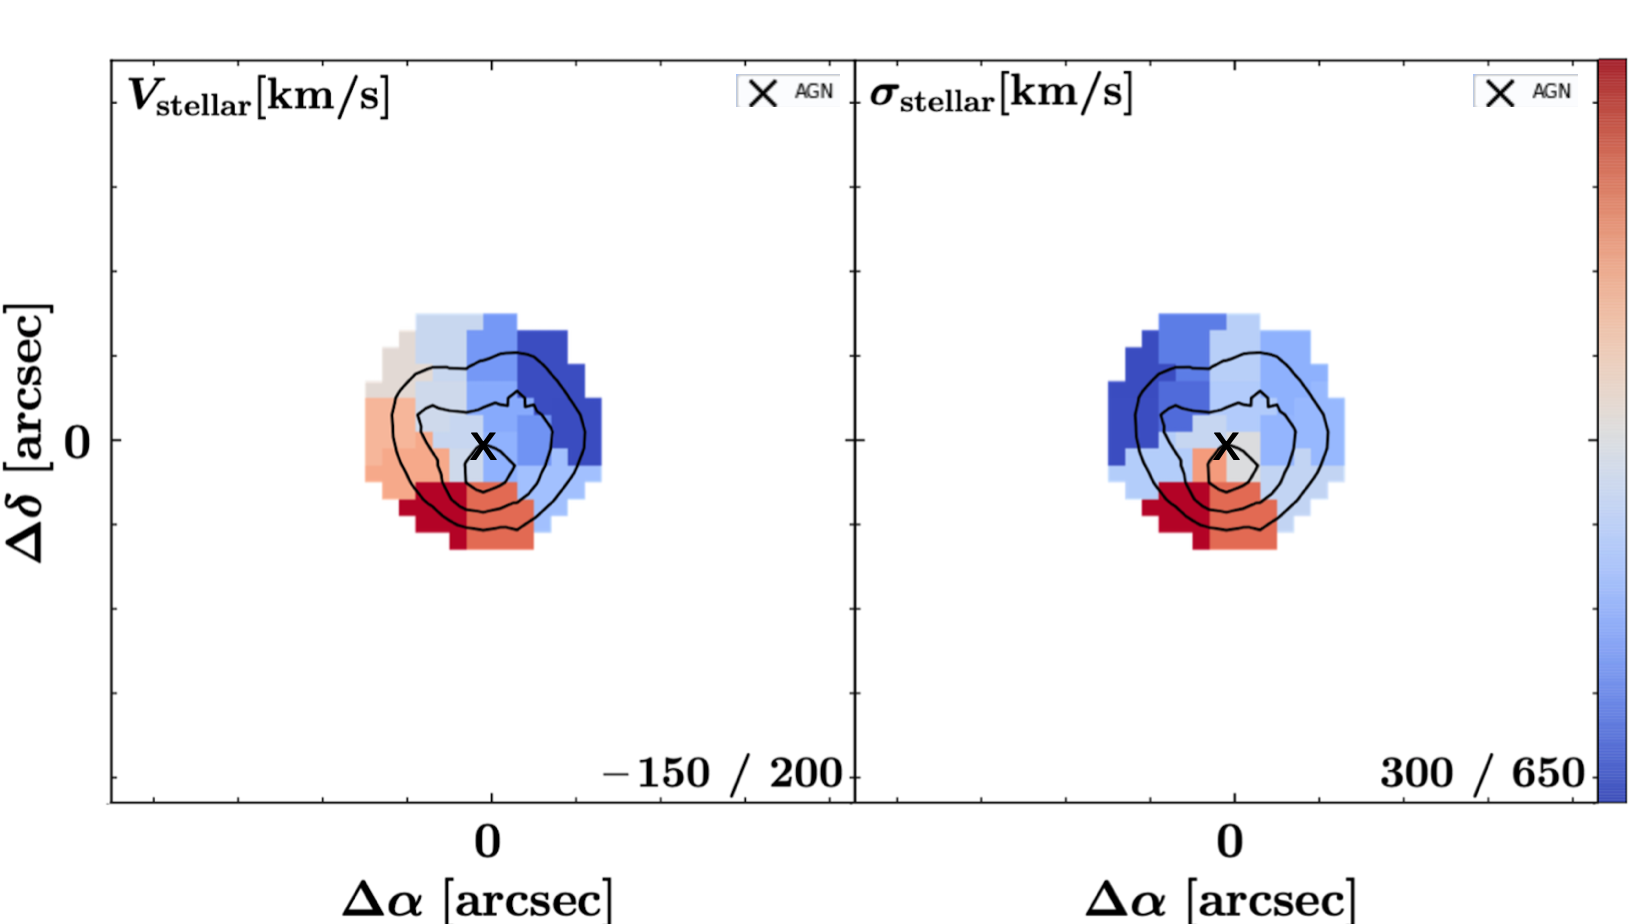
left: Radial velocity of the stars in the BCG core in [km/s], with the colour-bar limits displayed in the lower-right corner of each diagram. Due to the low signal to noise in the stellar continuum, the data needs binning. We measure a gradient from -150 to 200 km/s with respect to the stellar systemic velocity. right: Velocity dispersion of the stars in the M1931 BCG. We observe much higher stellar velocity dispersions, in the oreder of 300-650 km/s, making the system dispersion dominated, i.e. a slow rotator which is typical for elliptical galaxies. 


The gas and stellar kinematics seem to be decoupled. The motion of the gas seems to be more closely related to the turbulance and bulk motion of the ICM, than it is related to the motion of the stars.

Conclusions

  • Ionised and molecular gas are co-spatial and co-moving
  • Kinematics of ionised and molecular gas suggest either chaotic infall or orbiting, with the gas in the Hα tail likely falling inward ➡ "chaotic cold accretion" ➡ fuels SF and (weak) AGN activity
  • Gas and stellar kinematics are decoupled ➡gas is not following the gravitational potential of the stars
  • Gas excitation: mix between SF and other energetic processes which give rise to LINER emission
  • SFR~ 167 M⊙︎/yr
  • 12+log(O/H) ~ 8