The VLT-MUSE and ALMA view of the MACS 1931.8-2635 brightest cluster galaxy

Bianca-Iulia Ciocan 1 , Bodo Ziegler 1 , Miguel Verdugo 1

  • 1 Institute For Astronomy (ifa), University Of Vienna, Austria

Abstract

We reveal the importance of ongoing in situ star formation in the brightest cluster galaxy (BCG) in the massive cool-core CLASH cluster MACS 1931.8-2635 at a redshift of z=0.35 by analysing archival VLT-MUSE optical integral field spectroscopy. Using a multi-wavelength approach, we assessed the stellar and warm ionised medium components, which were spatially resolved by the VLT-MUSE spectroscopy, and linked them to the molecular gas by incorporating sub-mm ALMA observations.
We measured the fluxes of strong emission lines such as: [OII] λ3727, Hβ, [OIII] λ5007, Hα, [NII] λ6584, and [SII] λ6718, 6732, which allowed us to determine the physical conditions of the warm ionised gas, such as electron temperature, electron density, extinction, ionisation parameter, (O/H) gas metallicities, star formation rates, and gas kinematics, as well as the star formation history of the system. Our analysis reveals the ionising sources in different regions of the galaxy.
The ionised gas flux brightness peak corresponds to the location of the supermassive black hole in the BCG and the system shows a diffuse warm ionised gas tail extending 30 kpc in the north-east direction. The ionised and molecular gas are co-spatial and co-moving, with the gaseous component in the tail likely falling inward, providing fuel for star formation and accretion-powered nuclear activity. The gas is ionised by a mix of star formation and other energetic processes which give rise to LINER-like emission, with active galactic nuclei emission dominant only in the BCG core. We measured a star formation rate of ∼ 97 M⊙/yr, with its peak at the BCG core. However, star formation accounts for only 50-60% of the energetics needed to ionise the warm gas. The stellar mass growth of the BCG at z<0.5 is dominated either by in situ star formation generated by thermally unstable intracluster medium cooling or by dry mergers, with these mechanisms accounting for the build-up of 20% of the stellar mass of the system. Our measurements reveal that the most central regions of the BCG contain the lowest gas-phase oxygen abundance, whereas the Hα arm exhibits slightly more elevated values, suggesting the transport of gas out to large distances from the centre as a result of active galactic nuclei outbursts. The galaxy is a dispersion-dominated system that is typical for massive, elliptical galaxies. The gas and stellar kinematics are decoupled, with the gaseous velocity fields being more closely related to the bulk motions of the intracluster medium.

Data analysis

Brightest Cluster Galaxy (BCG) in cool-core cluster MACS 1931.8-2635 at z=0.35 

Data:

  • ESO-VLT MUSE Integral Field Spectroscopy
  • data reduction: MUSE pipeline (Weilbacher et al. 2014) & ZAP (Soto et al. 2016)  
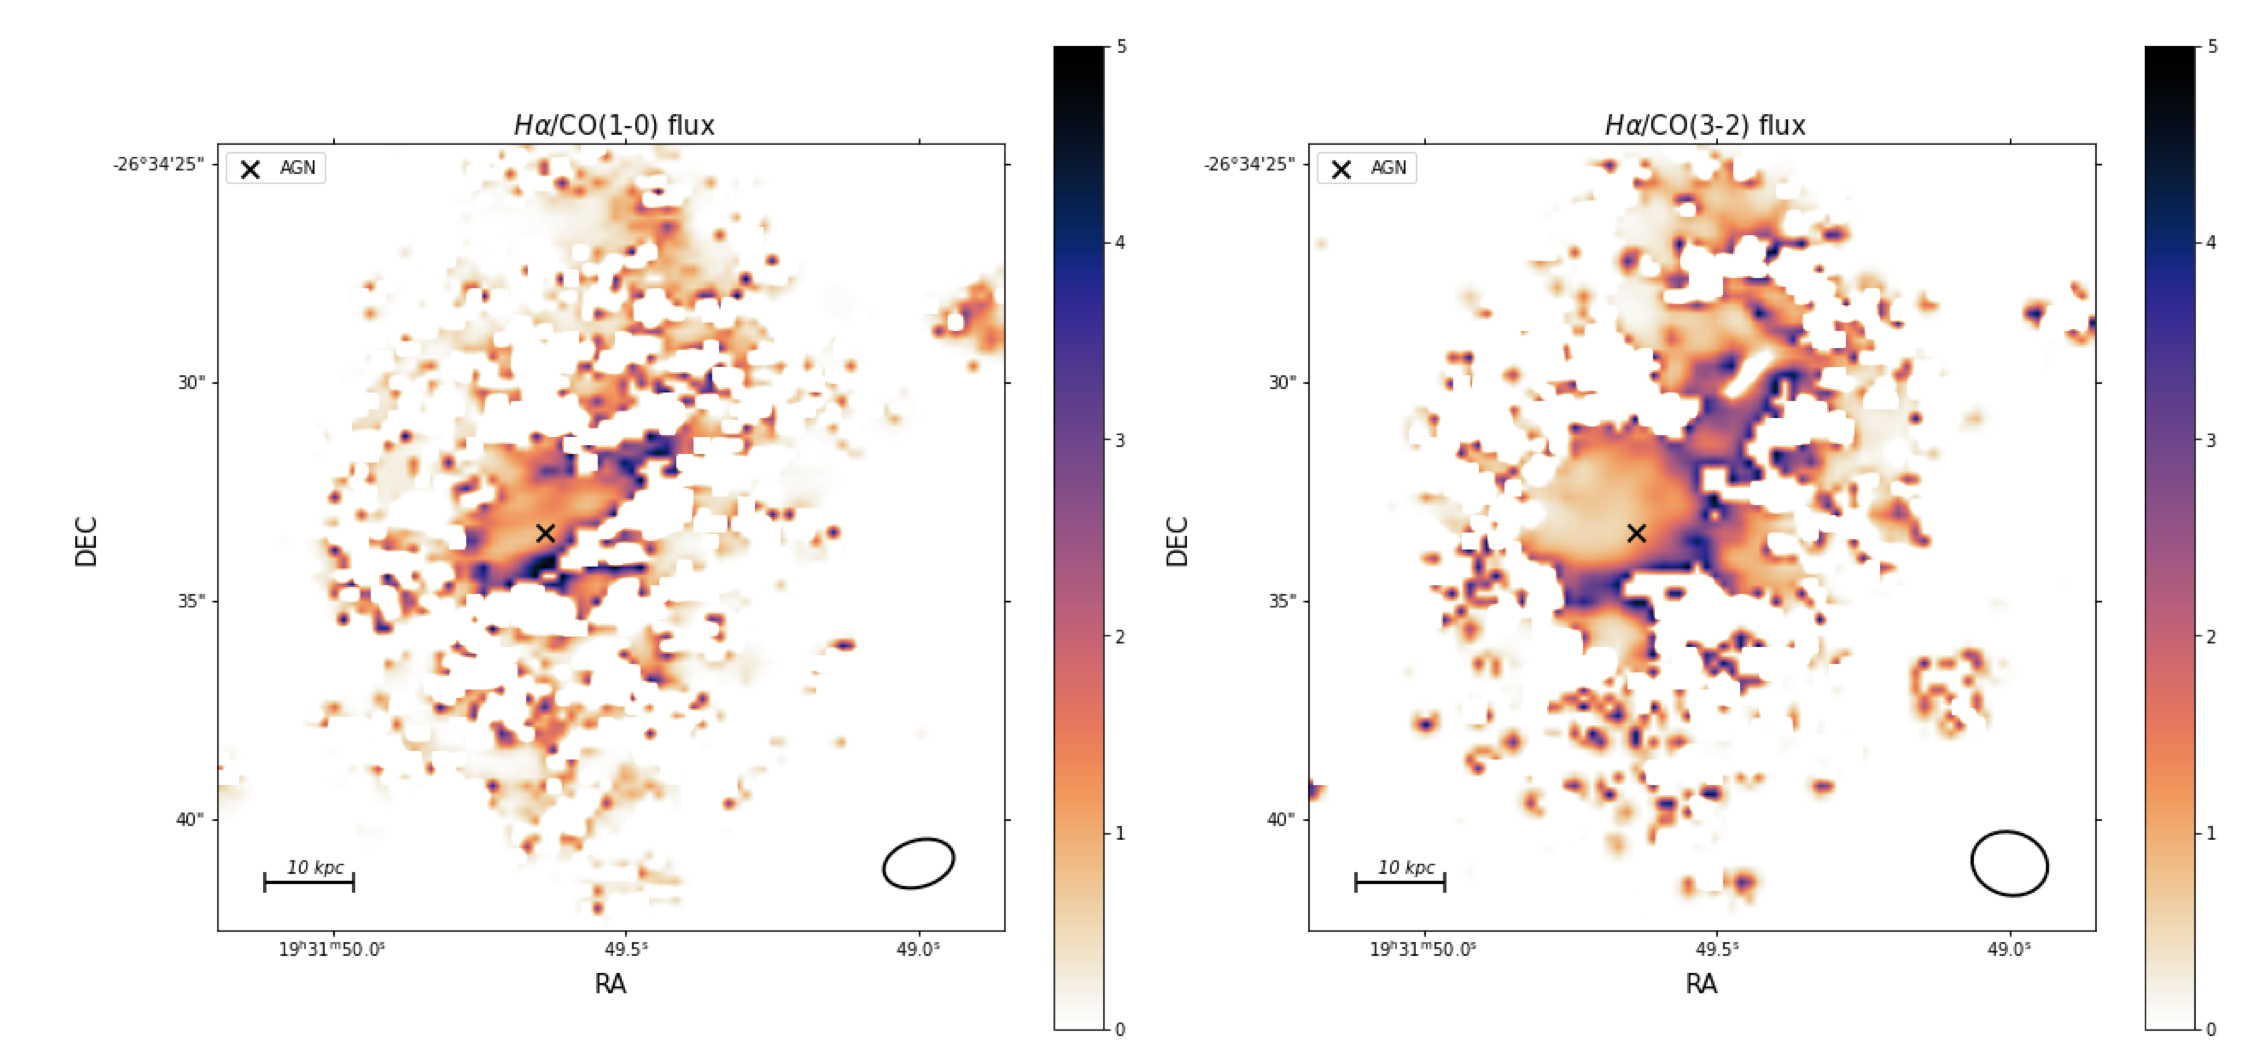
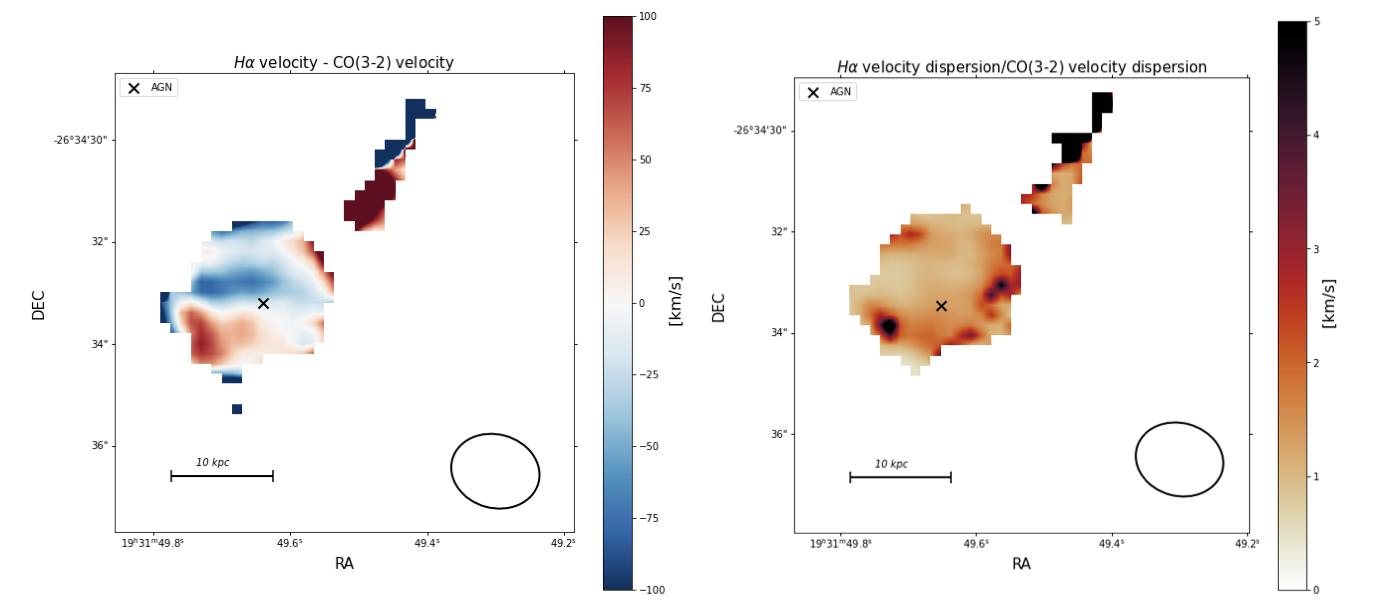
  • ALMA data (Fogarty et al. 2019) 

Data analysis: 

  • population spectral synthesis codes FADO (Gomes & Papaderos et al. 2017) + Porto3D (Papaderos et al. 2013, Gomes et al. 2016)
  • MUSE Python Data Analysis Framework (Bacon et al. 2016) 
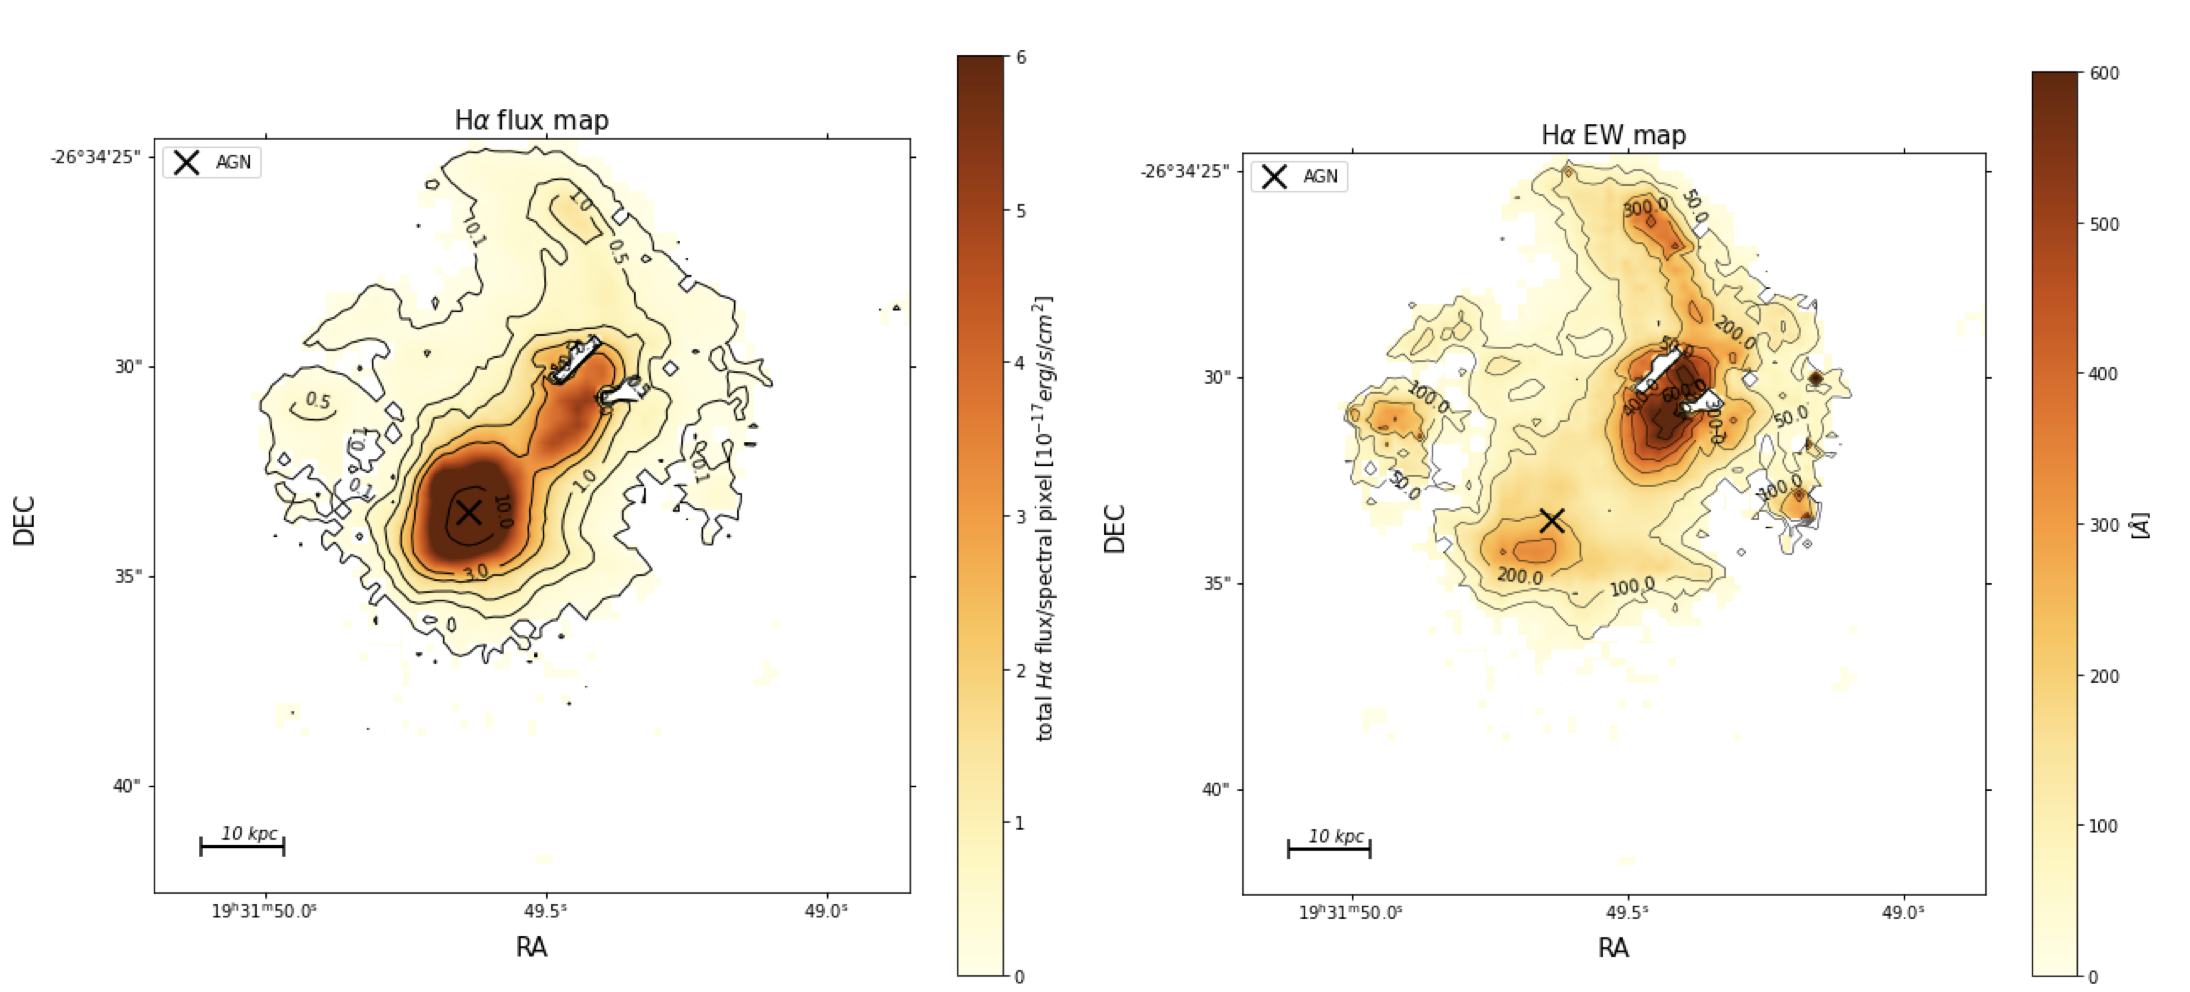
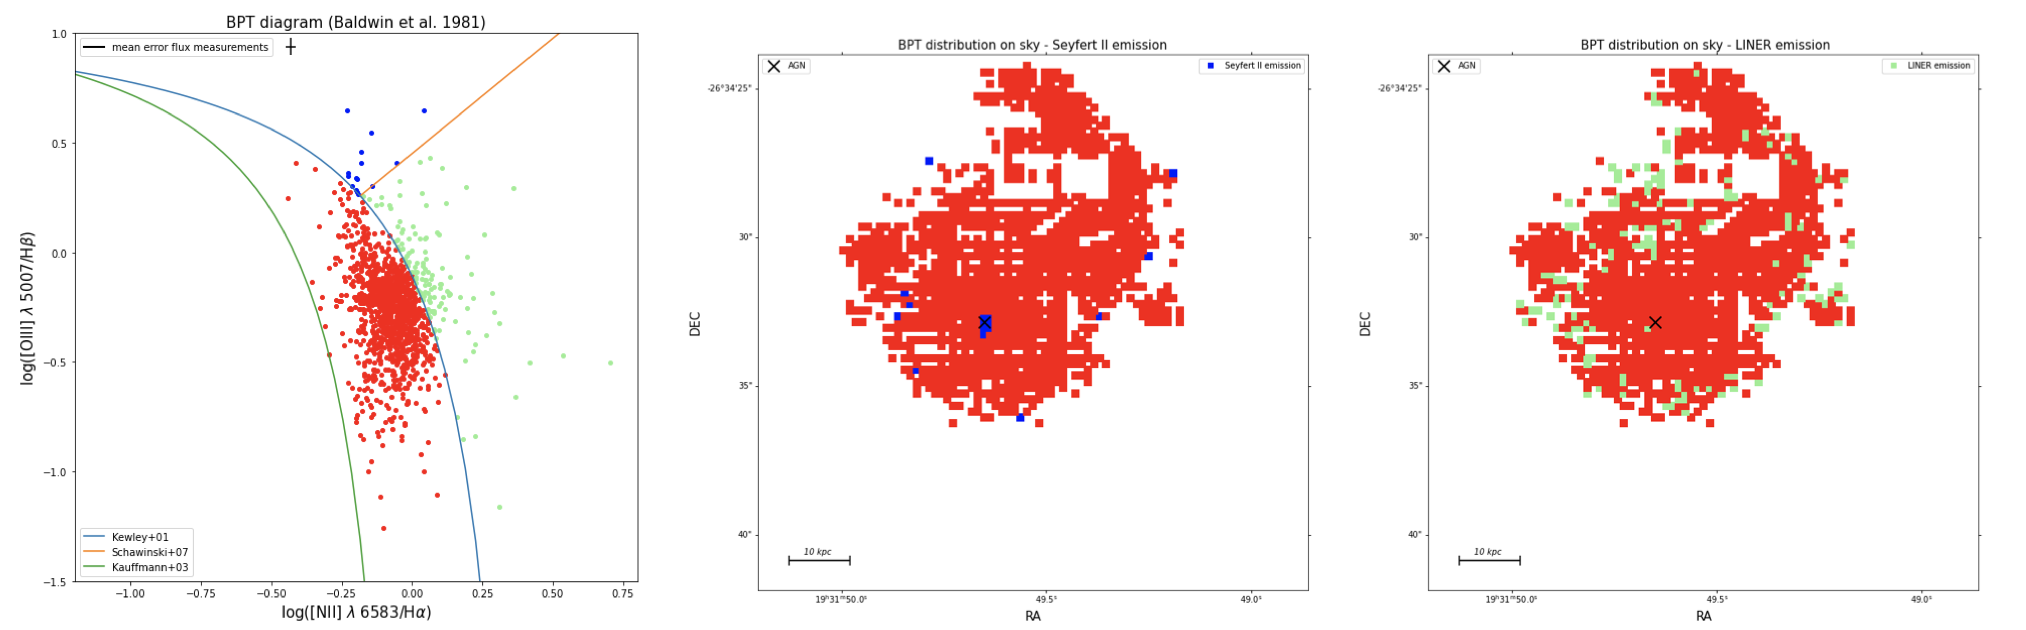
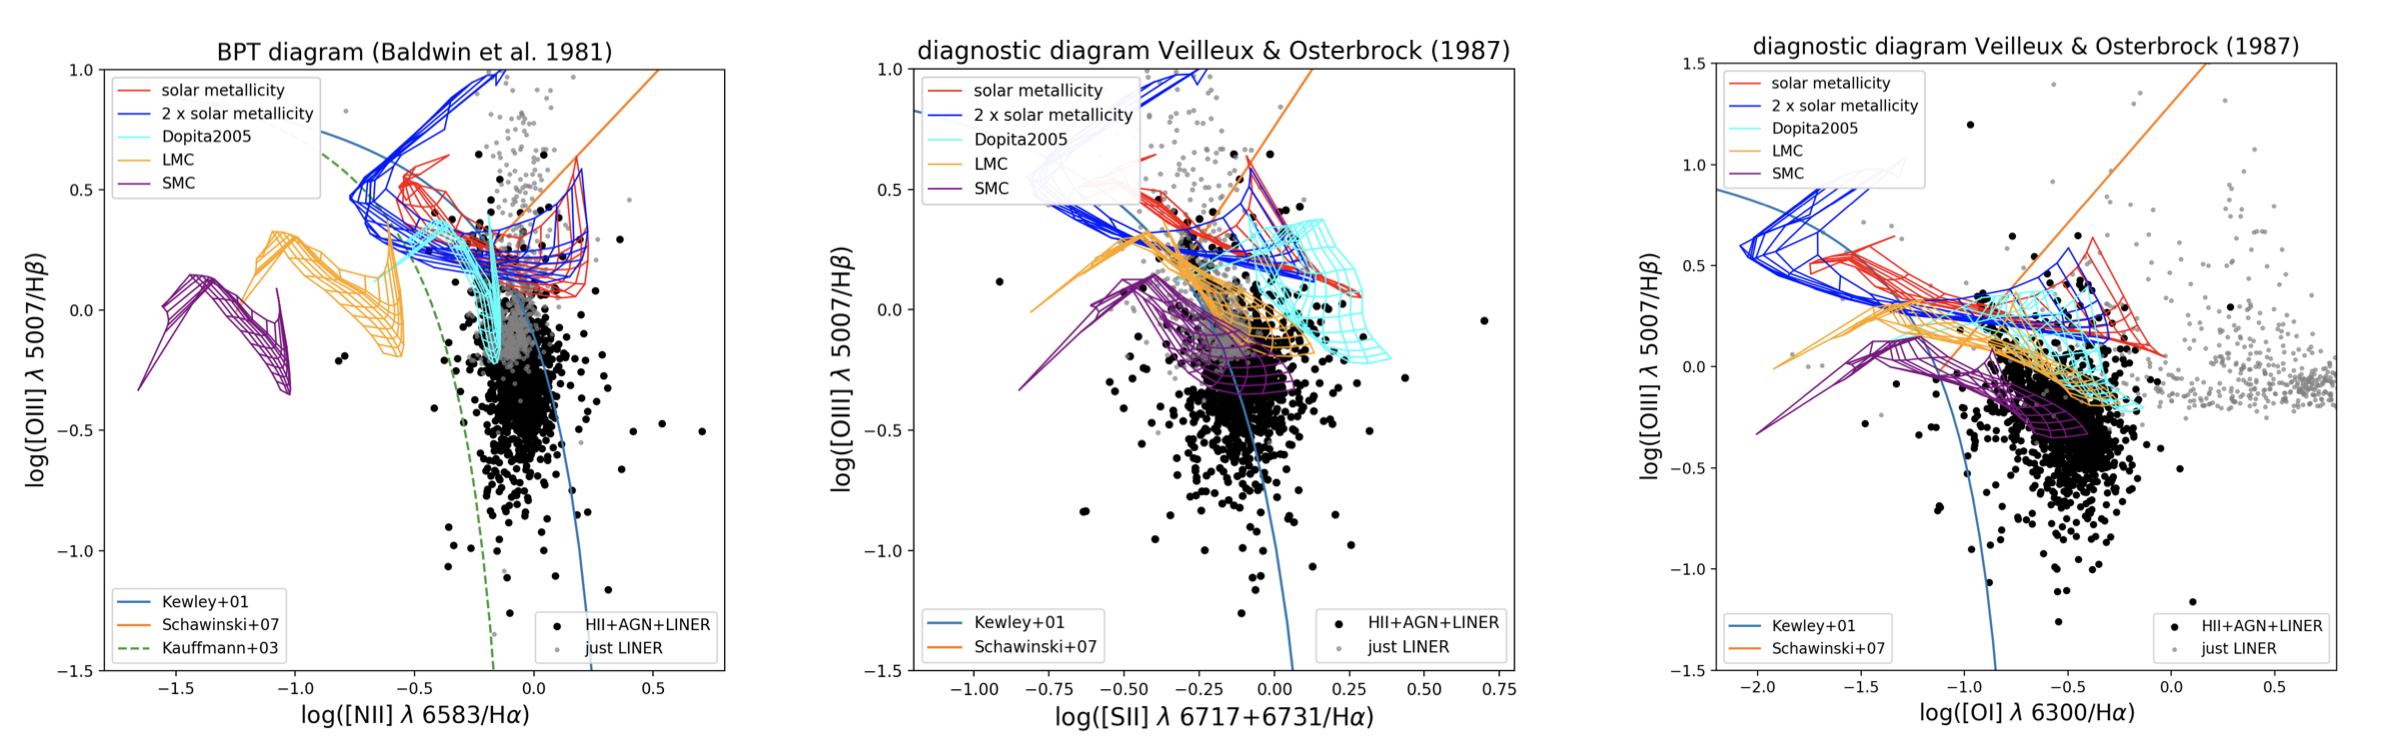
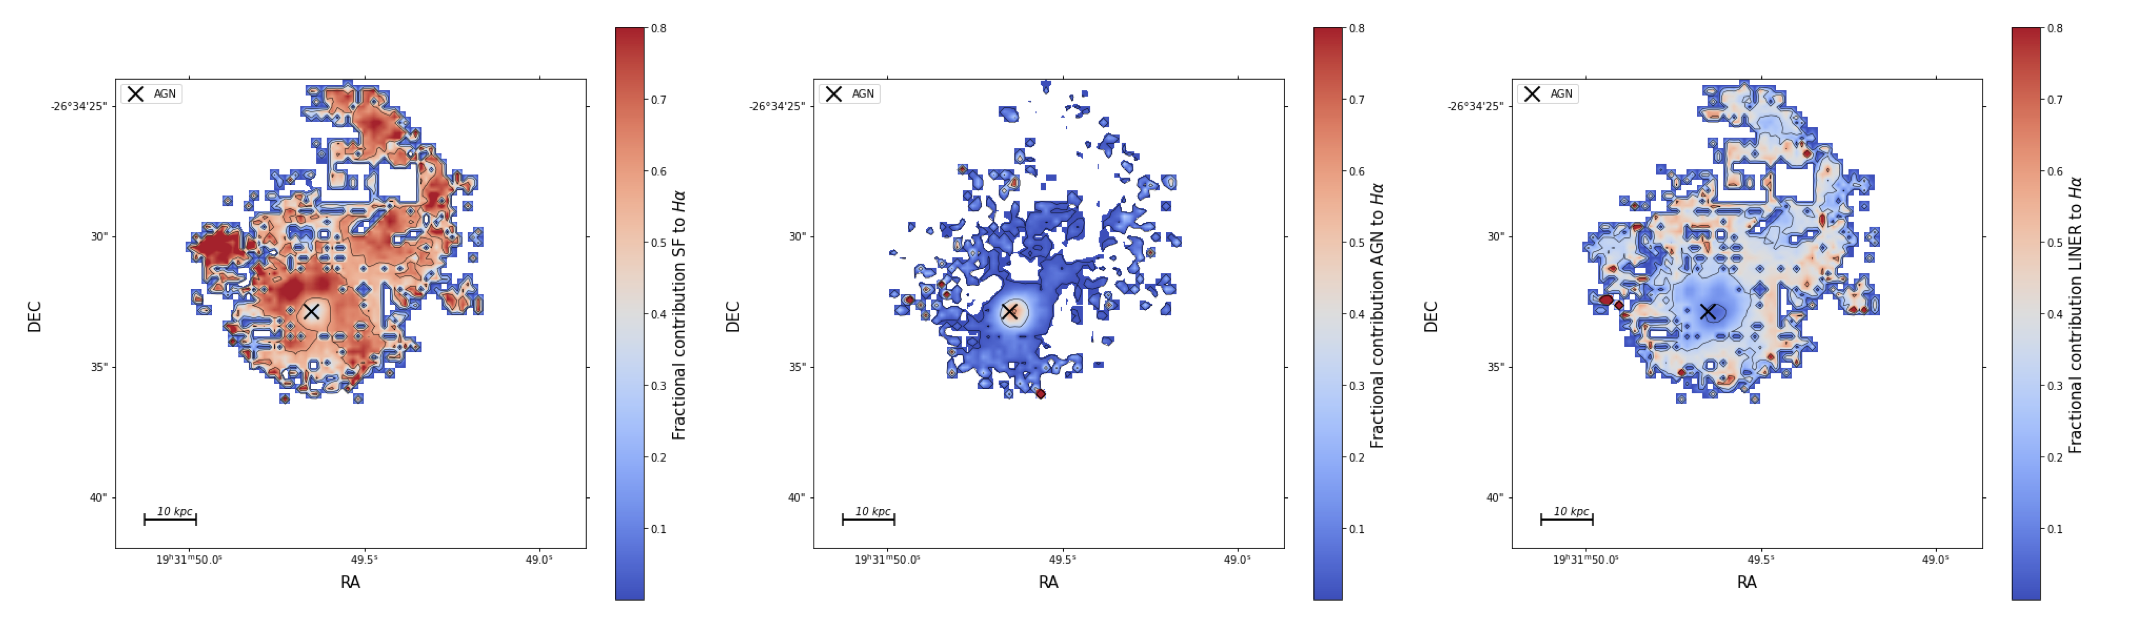
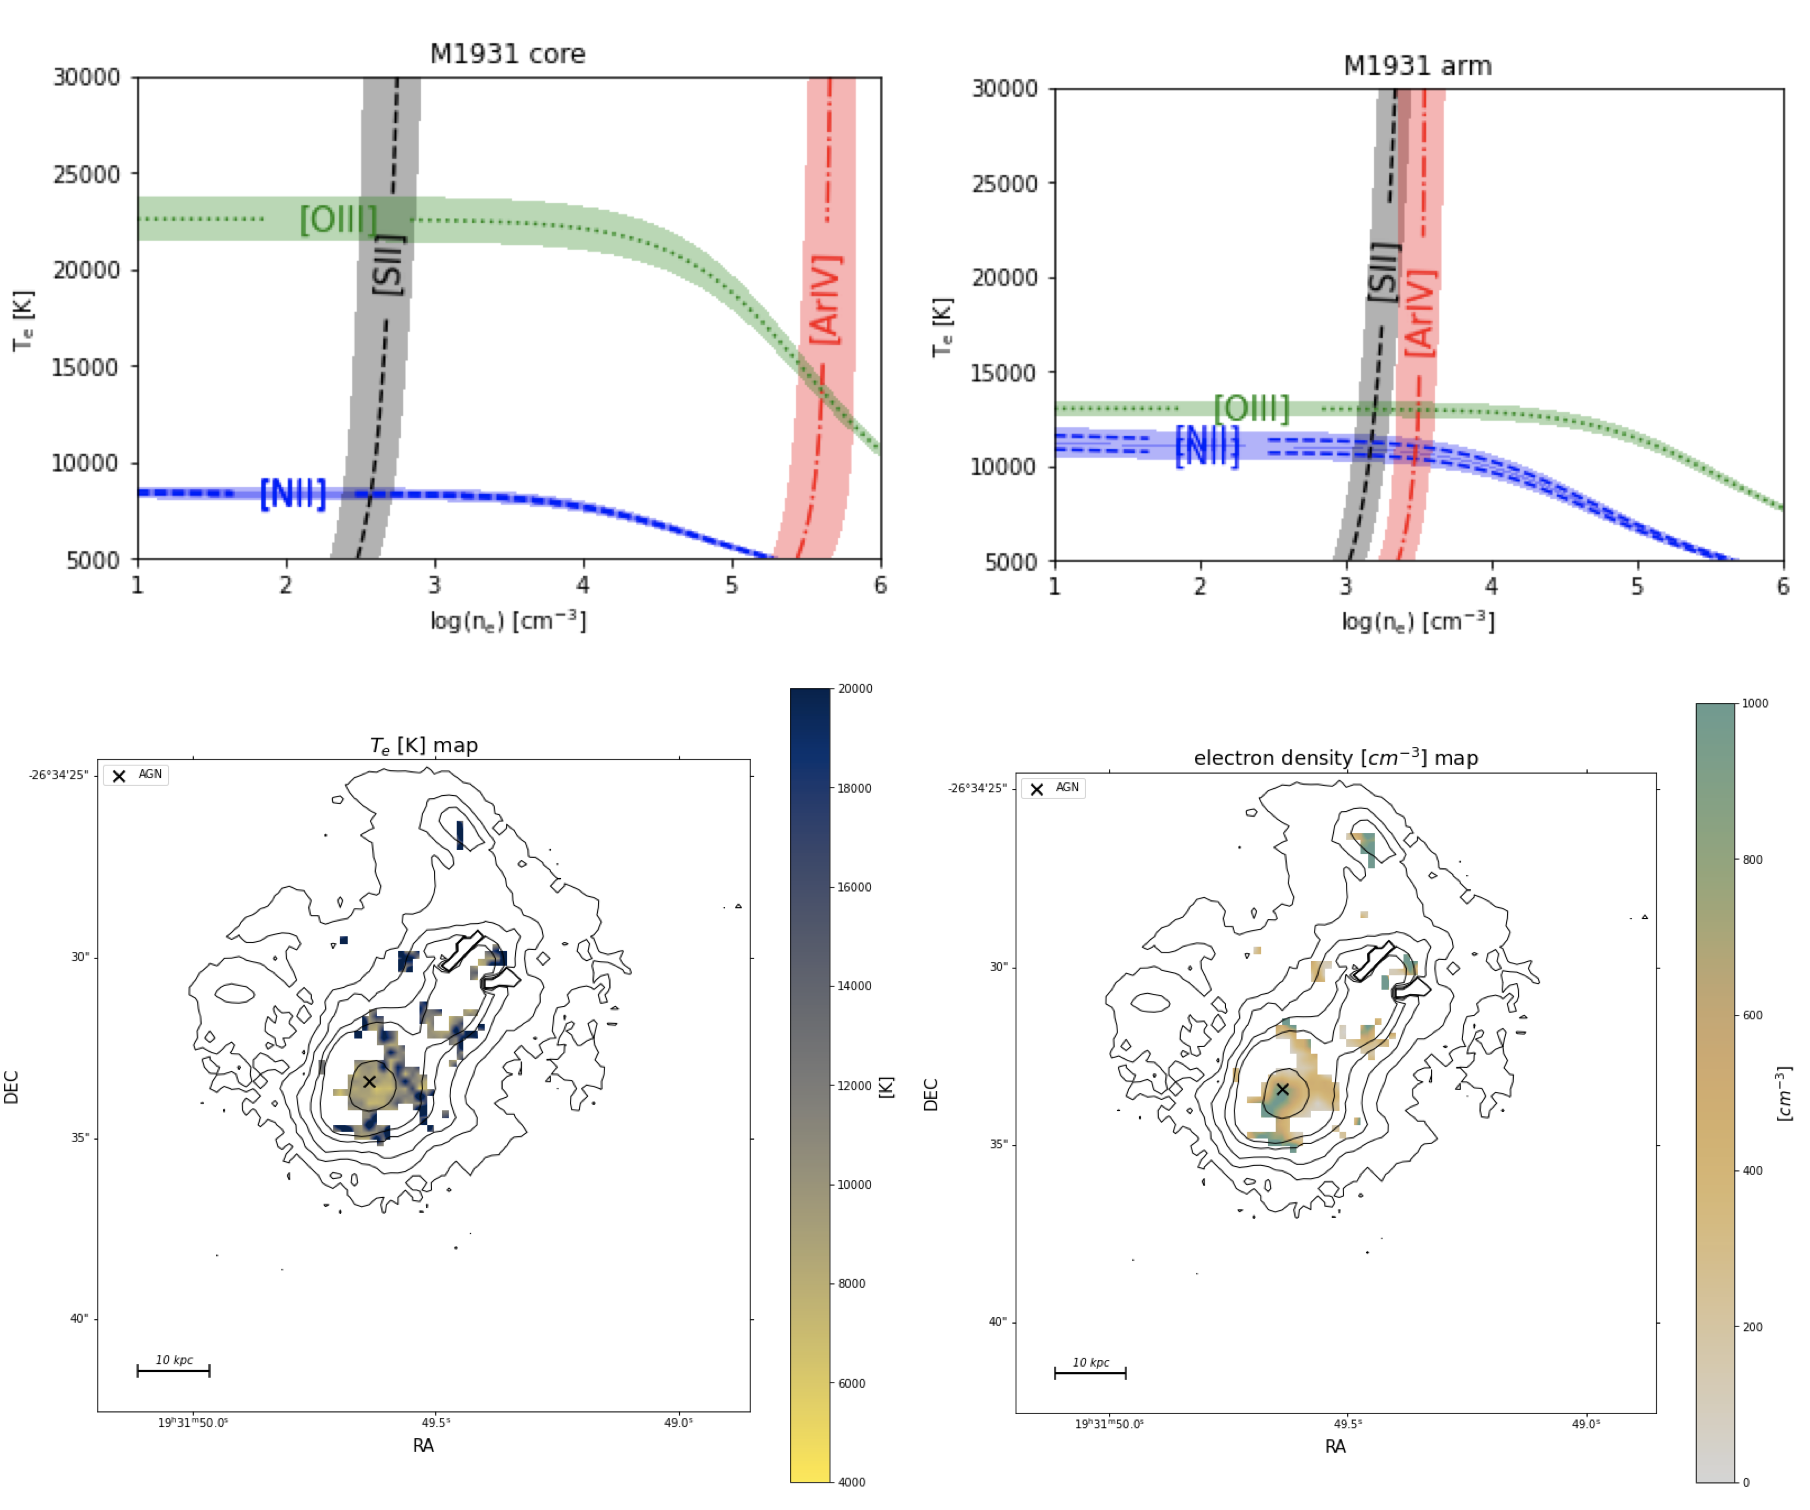
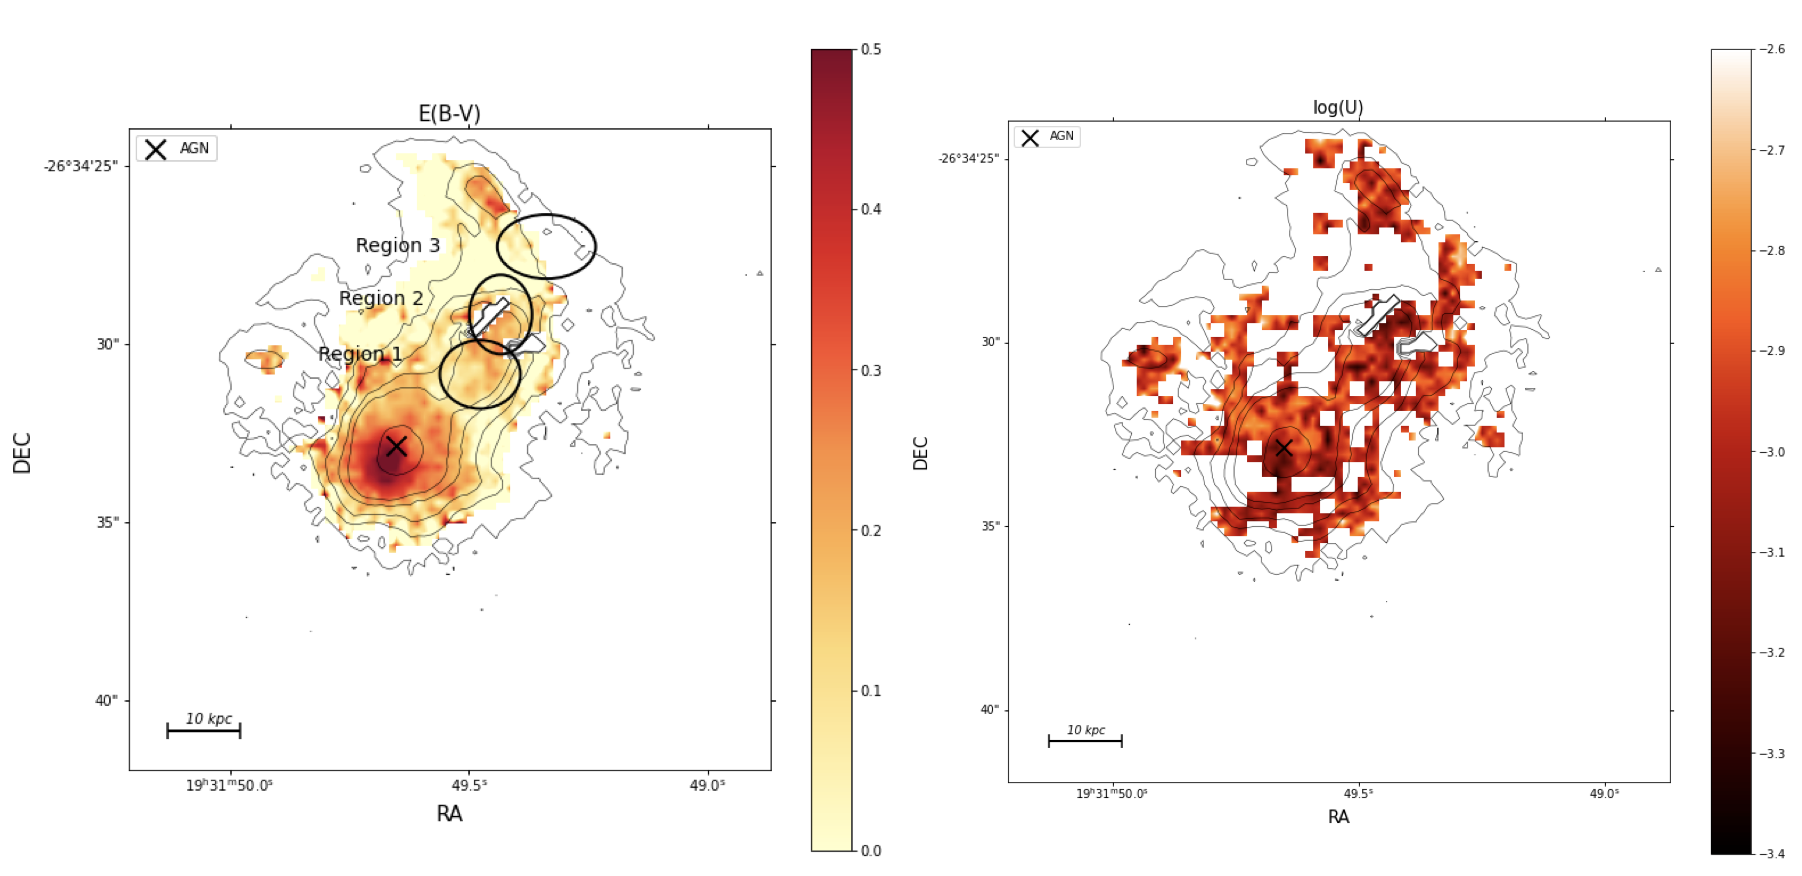
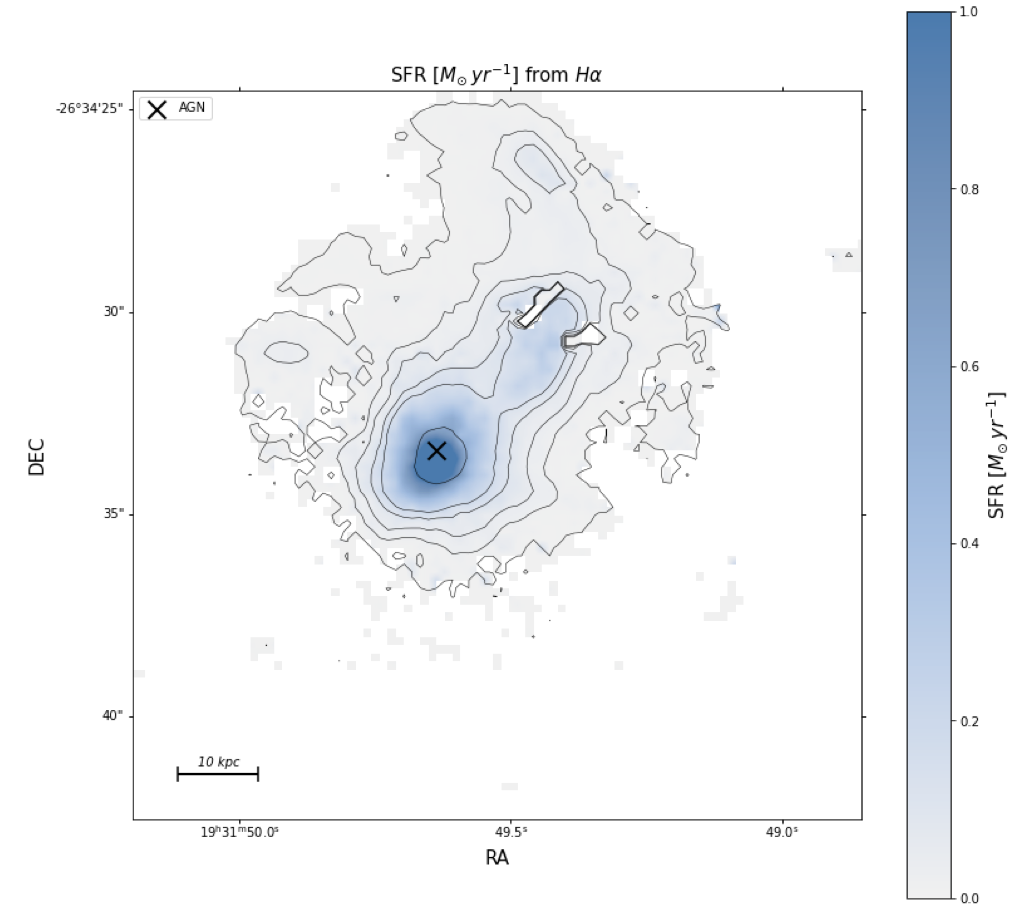
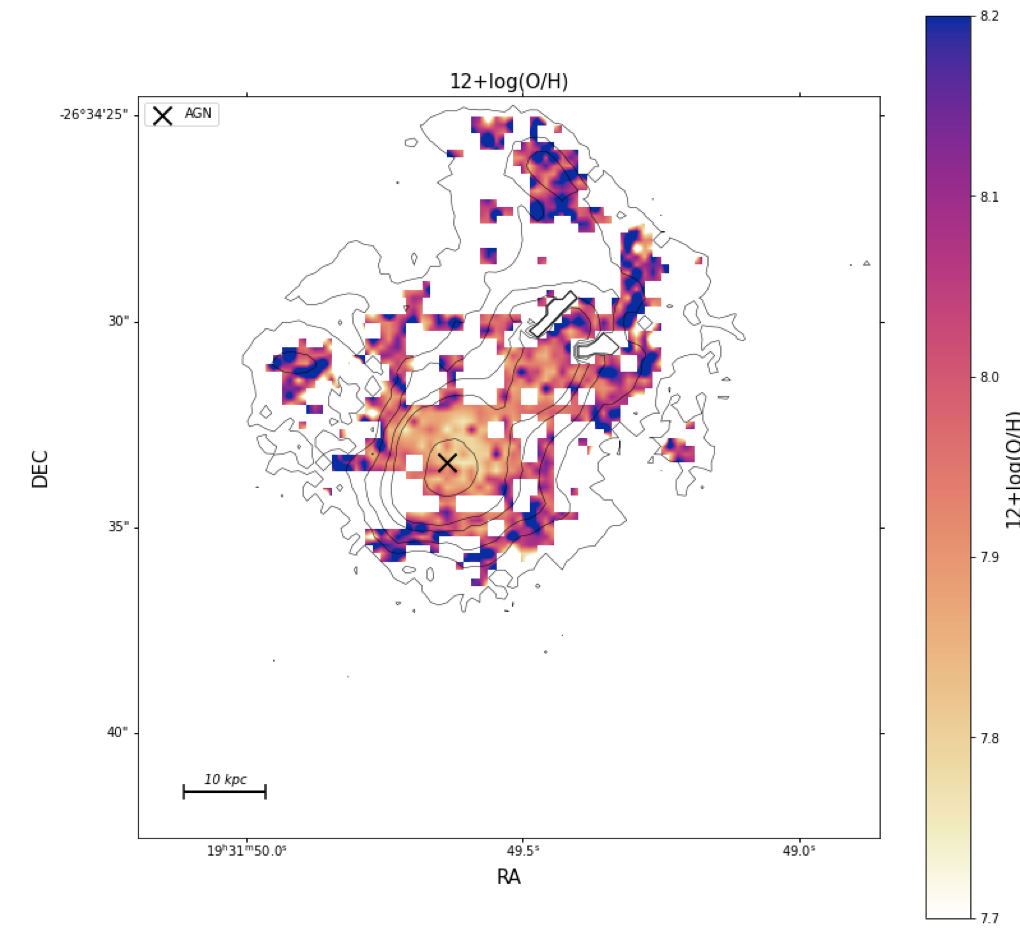
  • Ionised gas properties: [OII]λ3727, Hβ, [OIII] λ5007, Hα, [NII] λ6584,  and [SII]λ6718, 6732 fluxes + photoionisation codes (Pérez-Montero 2014) 
  • Ionization mechanisms: diagnostic diagrams + shock models (Allen et al. 2008) 
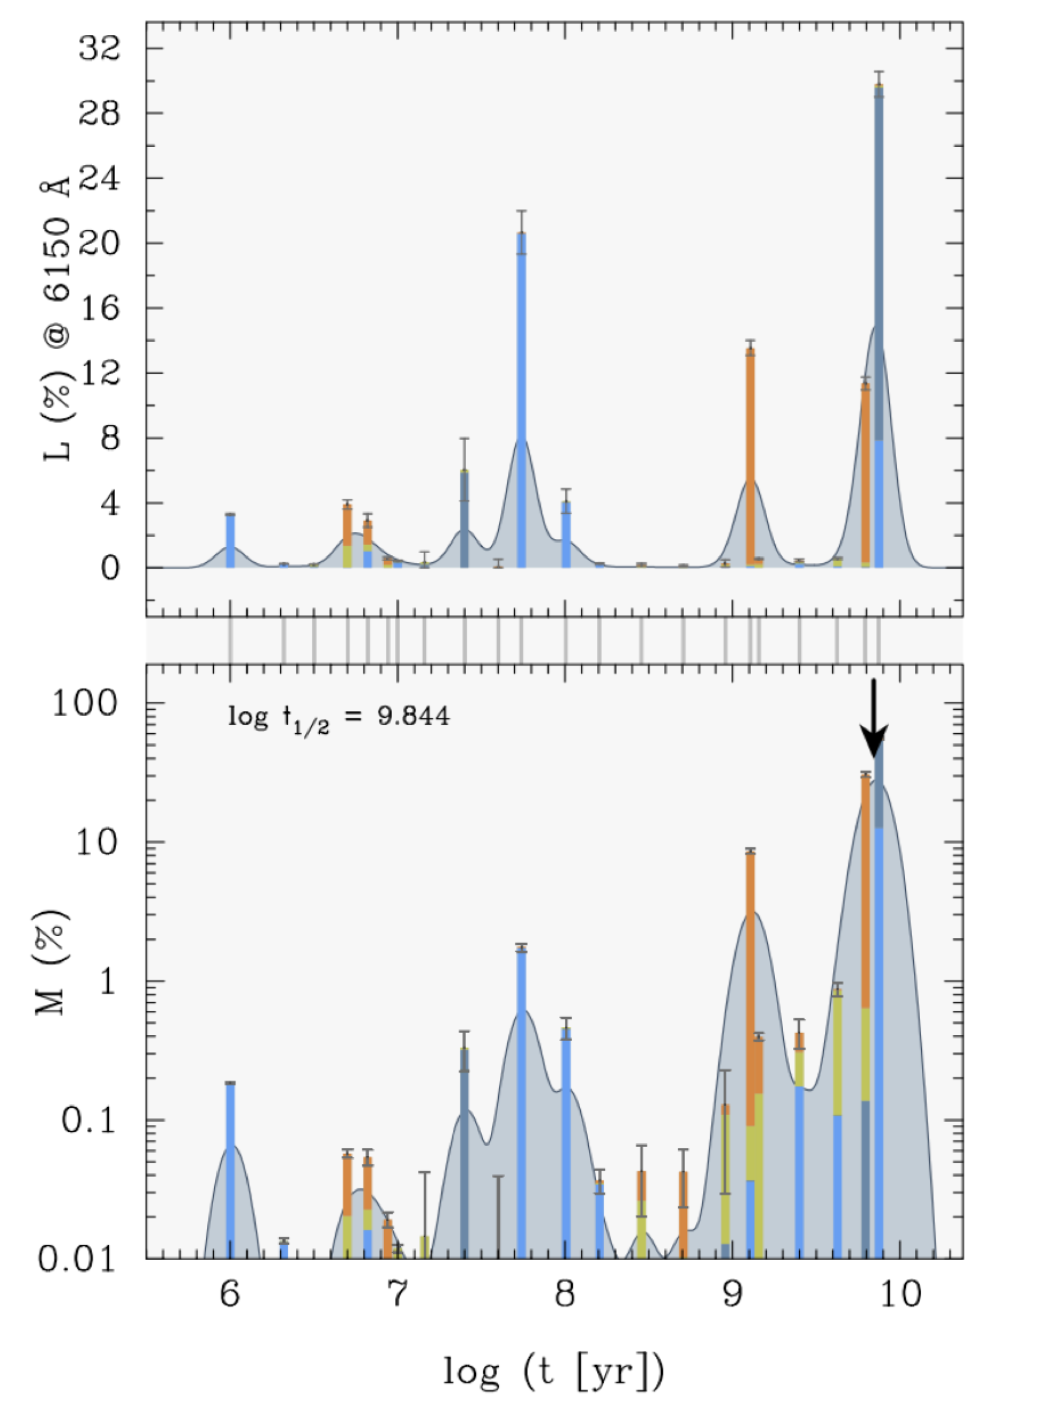
  • Star formation history via FADO and Porto3D 
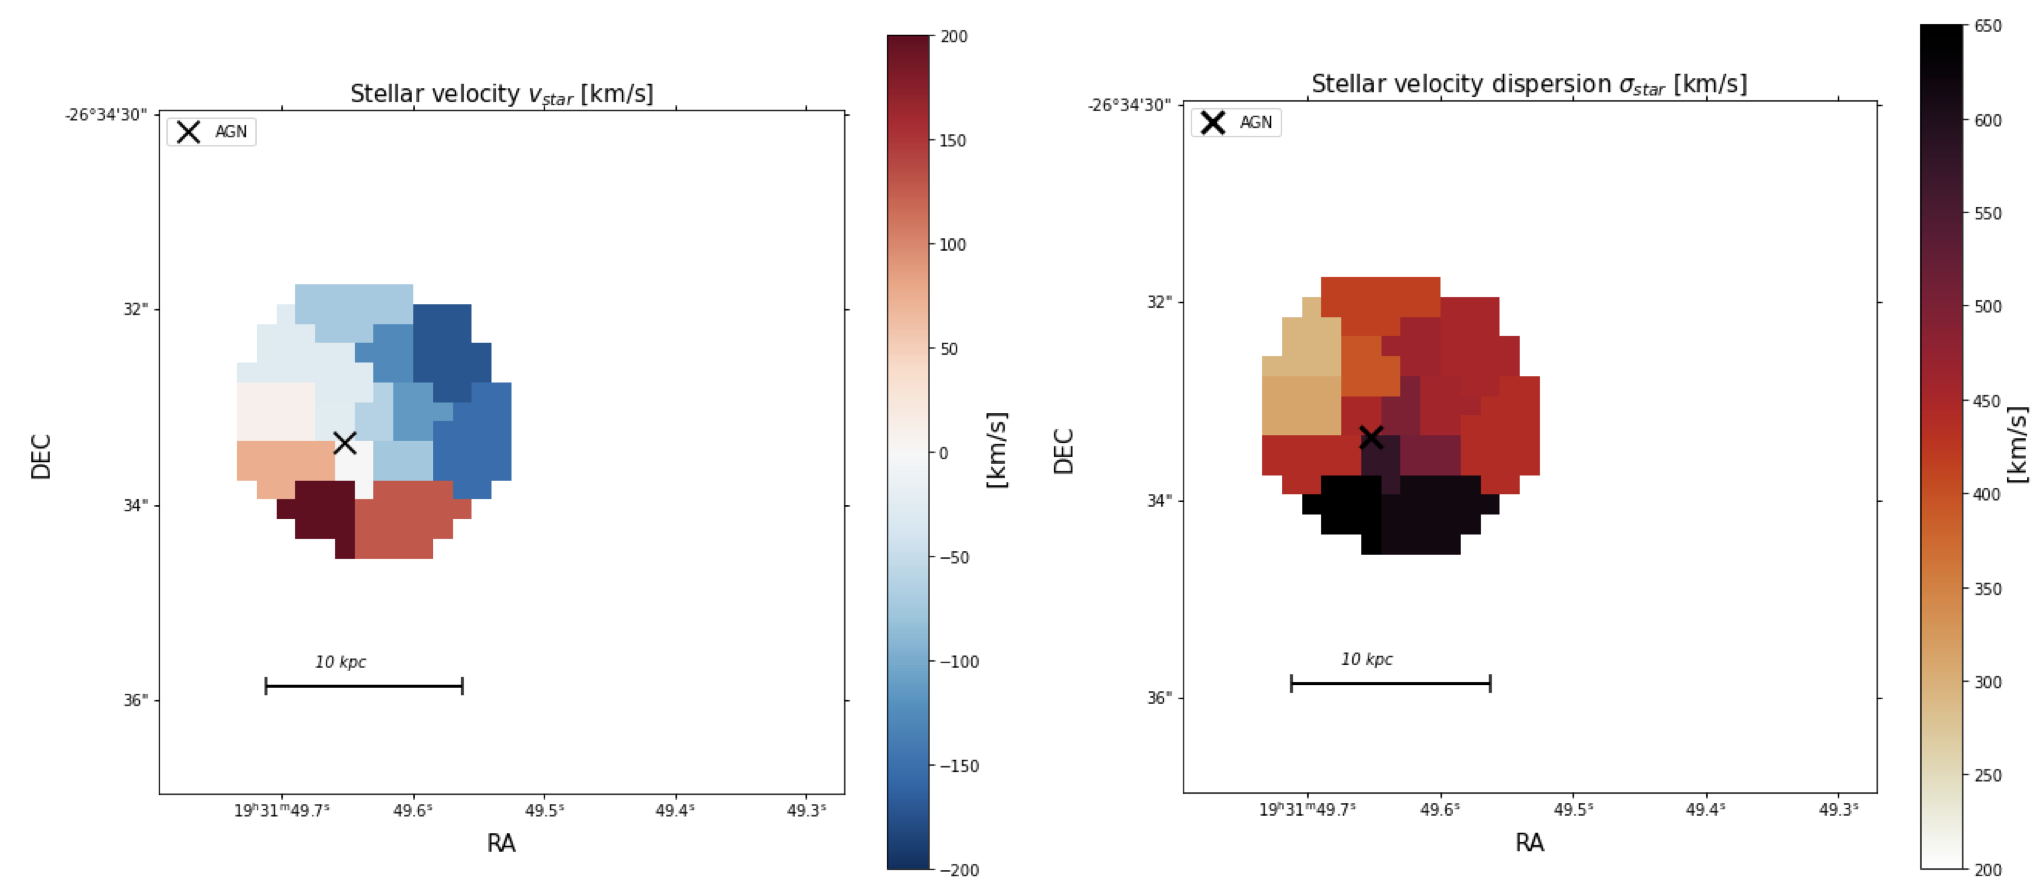
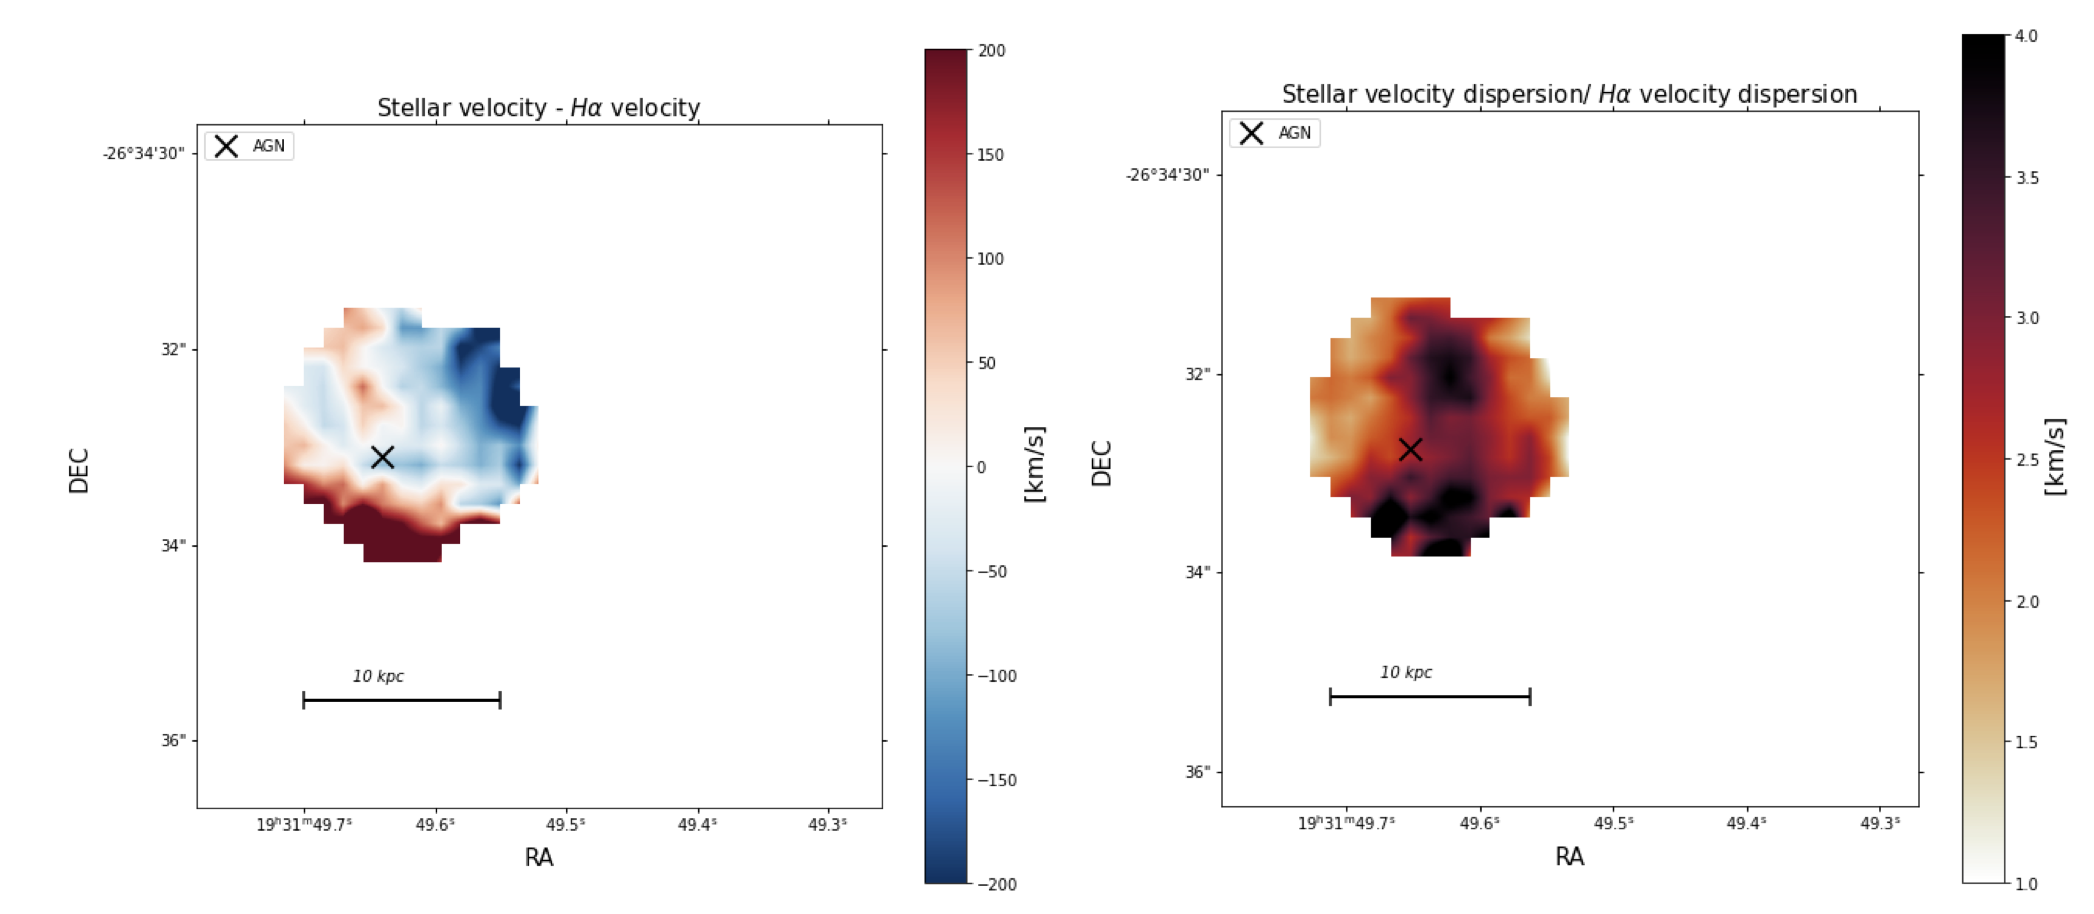
  • Stellar kinematics: pPXF (Cappellari & Emsellem 2004) via GIST pipeline (Bittner et al. 2019) 

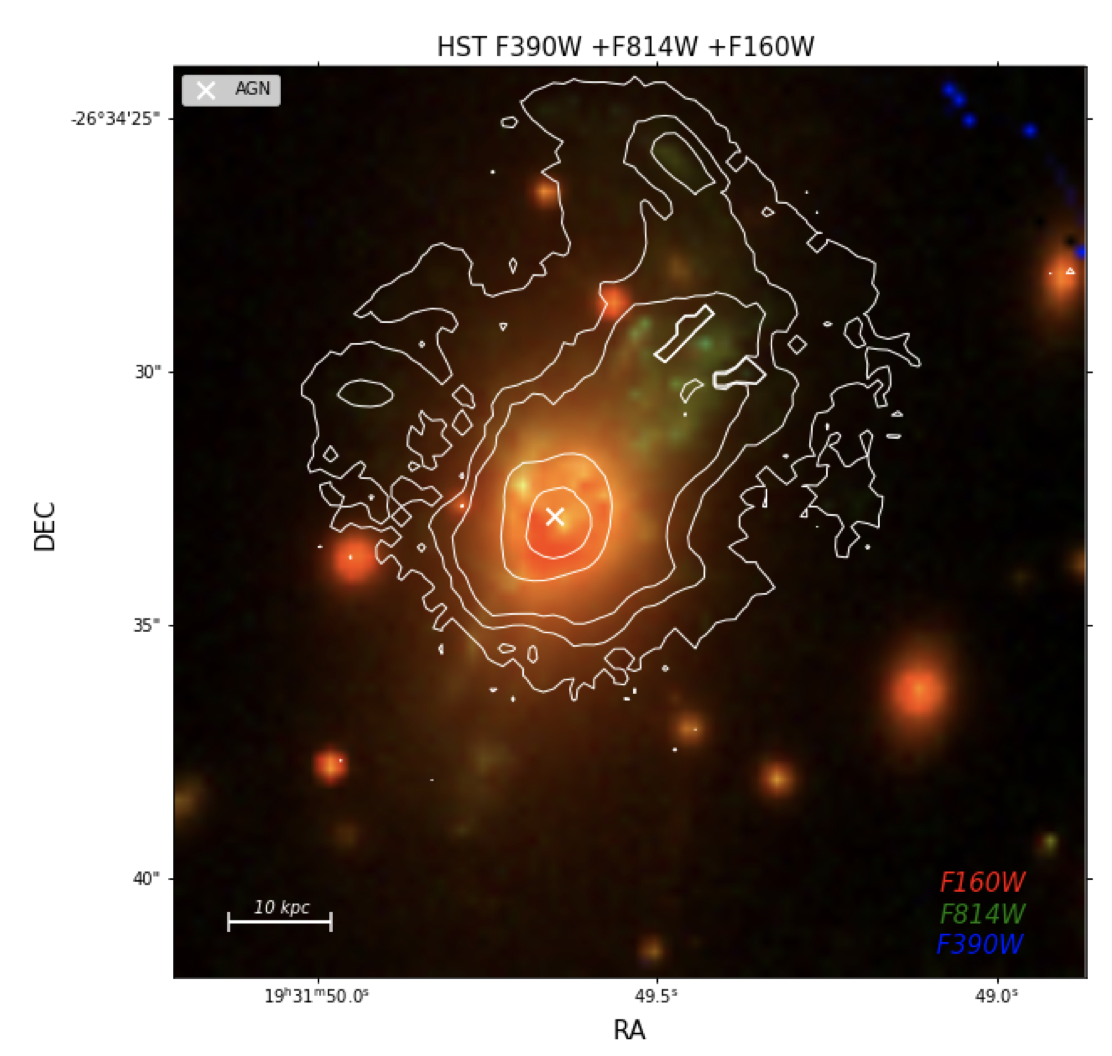
HST composite RGB image of the M1931 BCG: the F160W image is shown in red, the F814W in green, and the F390W in blue. The white contours show the Hα flux intensity, as measured from MUSE. The cross shows the location of the AGN.

Structure and kinematics of the gas

Ionised gas flux maps:

Left: spatially resolved Hα emission line map for the BCG of the M1931 galaxy cluster. The colour-bar shows the flux of the Hα line in units of 10−17 ergs s−1 cm−2 . Right: Hα equivalent width map measured in Angstrom.


 ➡The flux brightness peak corresponds to the location of the SMBH and the system shows a diffuse warm ionized gas tail extending ∼ 30 kpc in N-E direction 

Comparison between Hα and CO linear normalised flux:

Left: ratio between Hα and CO(1-0) fluxes. Right: ratio between the fluxes of Hα and CO(3-2). The cross shows the location of the AGN. The ellipses in the lower right of both panels depict the beam sizes of the ALMA observations.


 ➡Warm ionised and cold molecular gas are co-spatial 

Kinematics of the ionised gas:

Left: spatially resolved Hα radial velocity map for the BCG of the M1931 galaxy cluster. The colour-bar displays the radial velocity of the Hα gas with respect to the BCG rest frame, measured in [km/s]. Right: spatially resolved Hα velocity dispersion map measured in [km/s].


➡ Clear gradient from negative (∼ −300 km/s) to positive velocities ( ∼ 300 km/s) 

➡ Redshifted stream of gas in the Hα tail is radially in-falling towards the center, in accordance to chaotic cold accretion models (Voit et al. 2017, Gaspari et al. 2013)

➡ Low velocity dispersion of the order of ∼ 150 − 250 km/s 
 

Difference between the kinematics of the ionised gas and those of the cold molecular gas:

Left: difference between the radial velocity of the Hα gas and the velocity of the CO(3-2) gas. Right: ratio between the Hα velocity dispersion and the CO(3-2) velocity dispersion. The ellipses in the lower right of both panels depict the beam sizes of the ALMA observations.


 ➡Warm ionised and cold molecular gas are co-moving

 ➡the ∼ ± 100 km s−1 velocity differences might be explained by the different spatial resolutions of the MUSE and ALMA data.

Ionising sources:

Diagnostic diagrams:

Left: BPT diagram (Baldwin et al. 1981) for all spaxels of the MUSE data cube with S /N > 10 in the emission lines used for the diagnostic. Middle: BPT distribution on the sky showing the spaxels with Seyfert II emission in blue. Right: BPT distribution on the sky showing the spaxels which fall in the LINER region of the diagnostic diagram in green.


 ➡composite +LINER-like emission

Diagnostic diagrams (left: BPT; middle: diagnostic diagram of  Veilleux & Osterbrock (1987) using [OIII]/Hβ vs. [SiII]/Hα; right: diagnostic diagram of Veilleux & Osterbrock (1987) using [OIII]/Hβ vs [OI]/Hα) showing the predictions from the fully radiative shock models of Allen et al. (2008) computed with MAPPINGS V. We consider a pre-shock density of 1 cm−3, shock velocities ranging from 10 to 350 km s−1, and different metallicities. The choice of these shock velocities is motivated by the observed velocity dispersion of the nebular gas. The red lines depict a grid with solar metallicity, the blue ones a grid with twice solar metallicity, the cyan lines one with metallicities from Dopita et al. (2005), the orange ones a grid with Large Magellanic Cloud metallicities, and the purple ones a grid with Small Magellanic Cloud metallicities. The black data-points represent the spaxels of the MUSE cube, with an S/N > 10 in each emission line used for the diagnostic. The grey data-points represent the spaxels of the MUSE cube, from which we have subtracted the contribution from star formation and AGN emission to the total luminosity of each emission line, after applying the decomposition method of Davies et al. (2017). These data-points are representative for pure LINER-like emission.

 ➡Fully radiative shock models do not reproduce the measured emission line ratios
 ➡shocks are not responsible for ionising the gas


Davies et al 2017 spectral decomposition method:

Maps depicting the fractional contribution of SF (left), AGN (middle), ‘LINER’ (right) to the Hα emission line, as calculated based on the spectral decomposition method of Davies et al (2017).The colour-bar limit displaying the fractional contribution of each ionising mechanism to the total luminosity of the emission lines was set to 0.8, and not the nominal value of 1, for better visualisation purposes.

 ➡Fractional contribution of ionisation mechanisms:

SF: ∼ 50 − 60% 
AGN emission: ∼ 10%, dominant only in the core
LINER-like emission: ∼ 30% − 40%

 ➡Main source ionisation: mix between SF and other energetic processes that “mimic” LINER  emission

 ➡energetic proccesses which can give rise to LINER-like emission: photoionisation by cosmic rays, conduction from hot gas, X-ray photoionisation, turbulent mixing layers, collisional heating; ionisation by pAGB stars ruled out 

Properties of the ionised gas

Electron Density and Electron Temperature (pyNeb, Luridiana et al. 2015):

Top-left: electron density vs electron temperature diagnostic diagram for the core of the M1931 BCG. For this plot, we use the following diagnostics: [NII] λ 5755/6548, [NII] λ 5755/6584, [SII] λ 6731/6716, [ArIV] λ 4740/4711, and [OIII] λ 4363/5007. The intersection of the curves gives the best fit electron temperature and density. Top-right: same as top-left, but for the Hα tail of the BCG. Bottom-left: spatially resolved electron temperature map for the BCG of the M1931 cluster. The colour bar shows the temperature measured in [K], as computed using the PyNeb tool, from the [NII] λ5755/6584 emission lines. Bottom-right: electron density map as computed using the PyNeb tool, from the [Sii] λ6731/6716 doublet. The colour-bar depicts the density in units of cm−3.

median values:

 ➡Te ∼11230 +/-220 K from [NII] λ5755/6584 
 ➡ne ~ 361 +/-60 cm^-3 from [SII] λ6718/ 6732 


Extinction and Ionisation parameter:

Left: colour excess map for the M1931 BCG as computed from the Balmer decrement. Right: ionisation parameter map, as computed from the HII-CH-mistry tool (Pérez-Montero et al. 2014). 

median values:

 ➡E(B-V)~0.135 +\- 0.0019 
 ➡log(U) = −2.93 +\- 0.26  

SFR and gas-phase metallicity:

Spatially resolved SFR map calculated from the extinction cor- rected Hα emission line for each spaxel of the MUSE sub-cube. The colour-bar shows the SFR in units of M⊙ yr−1.

Integrated SFR values:

 ➡SFR ∼ 144 +/- 0.33  M⊙/yr  (Kennicutt 1998)
 ➡SFR ∼ 97 +/- 0.7  M⊙/yr after removing the contribution from AGN and LINER-like emission to the extinction-corrected luminosity of the Hα emission line


Gas phase metallicity (O/H), as computed by the HII-CH-mistry tool. The colour-bar shows the oxygen abundance in units of 12+log(O/H). 

 ➡12 + log(O/H) ∼ 8 +\- 0.35 from Te based methods and HII-CH-mistry pipeline (Pérez-Montero et al. 2014) 
 ➡ICM metallicity: 12 + log(O/H) = 8.25 (Ehlert et al. 2011); gas condensation from the ICM, in accordance to chaotic cold accretion scenario

Stellar kinematics and SFH

Stellar kinematics:

Left: radial velocity of the stars with respect to the systemic velocity of the most central region of the system. Right: velocity dispersion of the stars in the BCG. The colour-bar in both plots depicts the radial velocity and velocity dispersion in units of [km/s]. Due to the lower S/N in the stellar continuum (only spaxels with S/N>10 considered), the data needs binning, and we can, therefore, measure the stellar kinematics only in the core of the system.

 ➡stellar radial velocity shows a gradient from -200 to 200 km/s 
 ➡velocity dispersion ranges from  300 km/s up to ∼ 600 km/s
 ➡dispersion dominated system; slow rotator

Comparison stellar and ionised gas kinematics:

Left: difference between the radial velocities of the stars and the Hα gas in the BCG core. Right: ratio between the velocity dispersion of the stars and the Hα gas in the core of the system. 

 ➡σgas < 0.5 · σstars  in accordance to chaotic cold accretion model 
 ➡stellar and gas kinematics are decoupled

SFH:

Star formation history of the M1931 BCG. Upper panel: contribution of the individual SSPs in the best-fitting population vector to the monochromatic luminosity at 6150 Å as a function of age. Lower panel: contribution of the SSPs to the total mass of the system as a function of age. The vertical arrow marks the age when 50% of the present-day stellar mass has been in place. The vertical bars represent the 1σ uncertainties. The grey vertical lines connecting the two panels mark the ages of the SSPs. The light-blue shaded area in both panels shows an Akima-smoothed (Akima 1970) version of the SSP contributions.

 ➡total M∗ = 5.9 · 1011 M⊙ 
 ➡in-situ star formation more than 6 Gyr ago  (z>1.5) leads to the formation of ∼ 80% of M*
 ➡both dry mergers and/or "cooling-flow" induced in-situ star formation episodes dominate the mass build- up at late epochs (z<0.5), but they account for only 20% of the total M* build-up
 ➡in accordance to theoretical models (De Lucia et al. 2007,  Bellstedt et al. 2016,  Lavoie et al. 2016)

Conclusions

 ➡ionised and molecular gas components are co-spatial and co-moving
 ➡gas confined into the tail is likely falling inward, providing fuel for SF and AGN feedback, in accordance with models of “chaotic cold accretion” & “precipitation” (Gaspari et al. 2013; Voit et al. 2017)
 ➡main source of ionisation in the M1931 BCG is a mix between star formation and other energetic processes which give rise to LINER-like emission, with classical LINER emission as well as photoionization by pAGB stars  being ruled out
 ➡SFR  ∼ 97M⊙/yr (value corrected for AGN & LINER-like contribution), with the most elevated levels in the BCG core, but SF accounts only to 50-60% of the energetics that are required to ionise the warm gas
 ➡12 + log(O/H) ∼ 8 ;  the low metallicity value is explained by gas condensation from ICM
 ➡stellar and gas kinematics are decoupled, in accordance with models of “chaotic cold accretion”
 ➡dry-mergers and/or in-situ SF generated by ICM cooling dominate the mass build-up at low z and account for less than 20% of the stellar mass of the M1931 system 

Ciocan e al. 2021, A&A,649A,23C