Reading between the lines: Probing magnetospheric accretion, winds, and the innermost disk with emission line tomography

Aurora Sicilia-aguilar 1 , Justyn Campbell-White 1 , Jerome Bouvier 2 , Veronica Roccatagliata 3 , Soko Matsumura 1 , Min Fang 4

  • 1 University Of Dundee
  • 2 University of Grenoble
  • 3 University of Pisa
  • 4 Purple Mountain Observatory

Abstract

What happens in the planet-forming region at the time of planet formation? How are stars like our Sun formed? Observationally-based answers have to deal with one fact: the highest spatial resolution available nowadays is not enough to observe the immediate surroundings of stars (few stellar radii to few au). Thus to gain information on the tiny scales of stellar radii and the innermost planet-forming regions of disks, indirect methods are required.

Young stars are rich in emission (and absorption) lines, related to their winds, accretion, spots, and innermost disk gas. Optical lines contain a large number of species with various excitation potentials and critical densities, providing information on the temperature, density, and velocity of hot and tiny structures. Combining the velocity information with repeated, time-resolved data, we can reconstruct scales far beyond the spatial resolution of the most powerful interferometers.

Using time-resolved spectroscopy covering several rotational and disk orbital periods, we can obtain a very detailed view of the structure and variability of accretion columns and spots and information on the presence and launching points of stellar/disk winds in young stars. Understanding these processes and how they affect the observed spectra can also help us to identify (or rule out) the presence of young and newly-formed planets and stellar companions that may be perturbing the disk. Highly variable sources provide a further point: with the temperature varying during outbursts, we can spectroscopically access an even larger region of the disk and surroundings!

I will present the results for stars with different spectral types and behaviours, discussing the power and limitations of emission line tomography and time-resolved data, and exploring what we can learn from "reading between their (spectral) lines" in these and other objects... and maybe help us to unveil why wild, and variable stars are so wild!

Abstract

What happens in the innermost disk at the time of planet formation? How does accretion, winds, and matter transport connect the star and the innermost disk, where planets are forming? And how can you resolve all those details that go below the capabilities of spatial resolution?

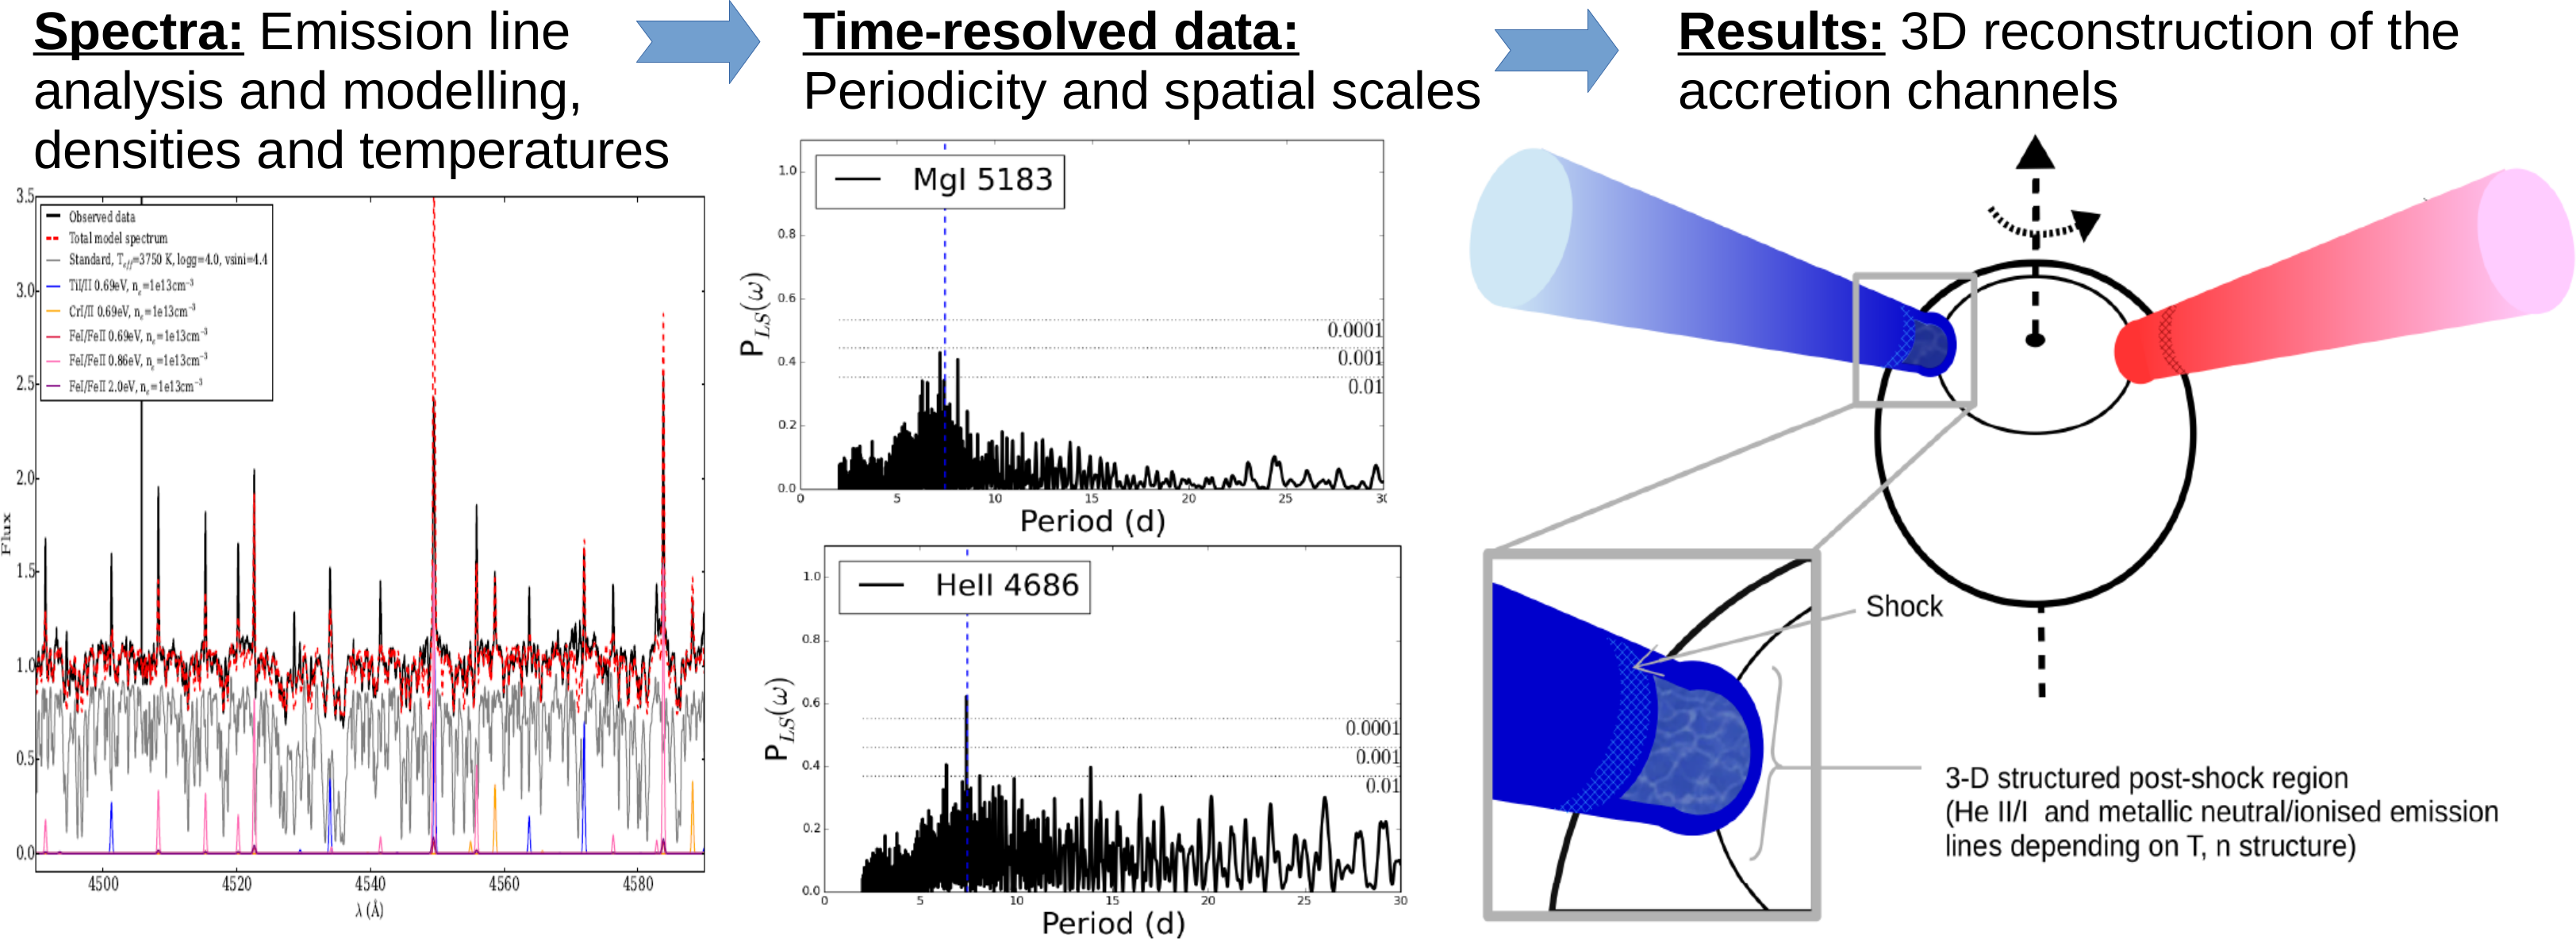
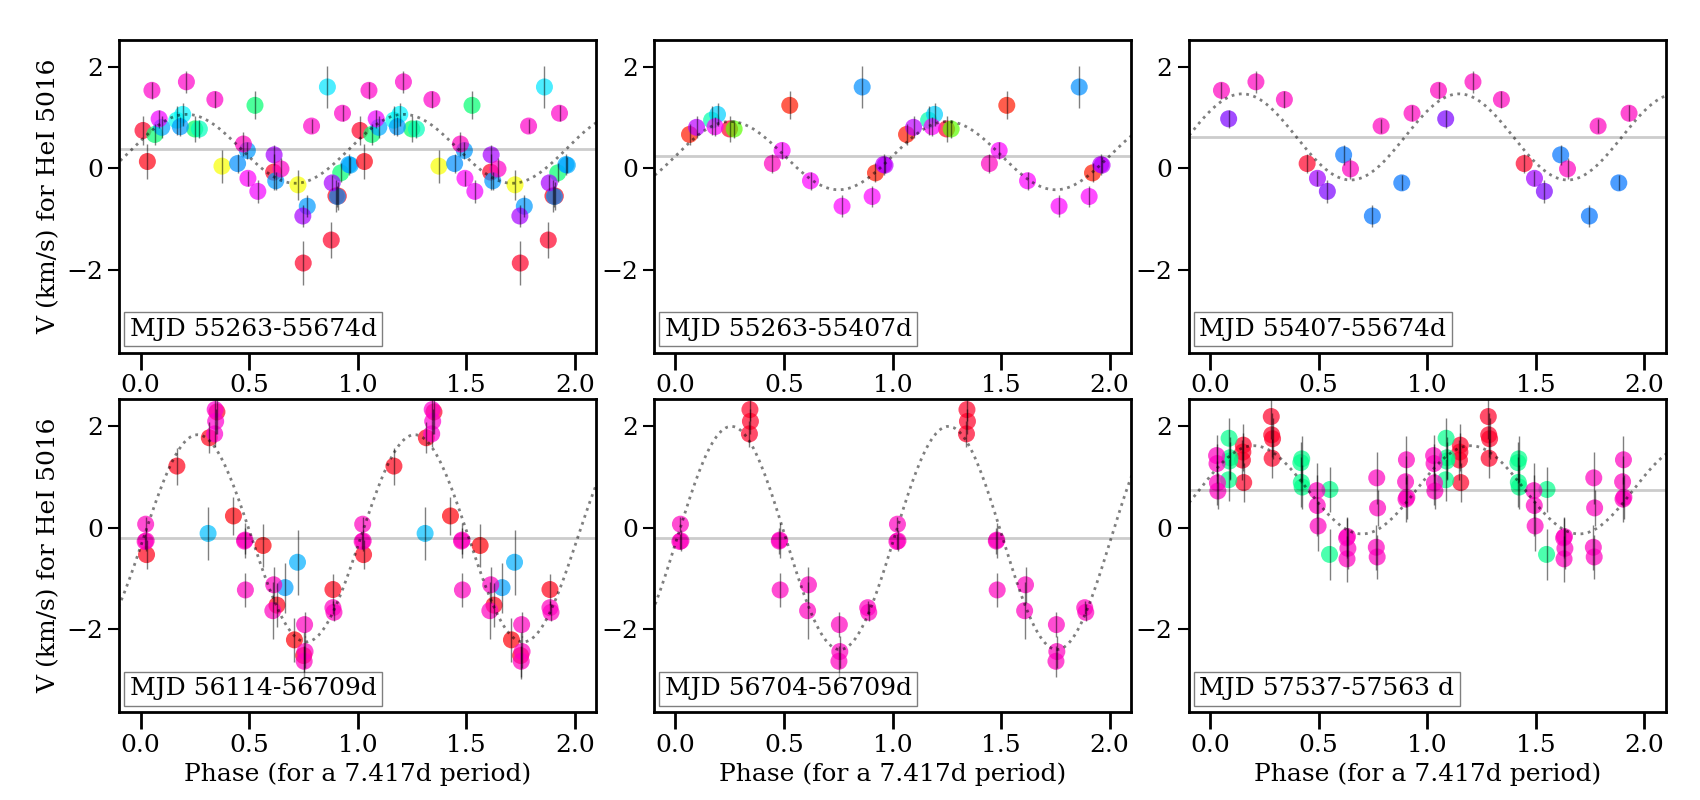
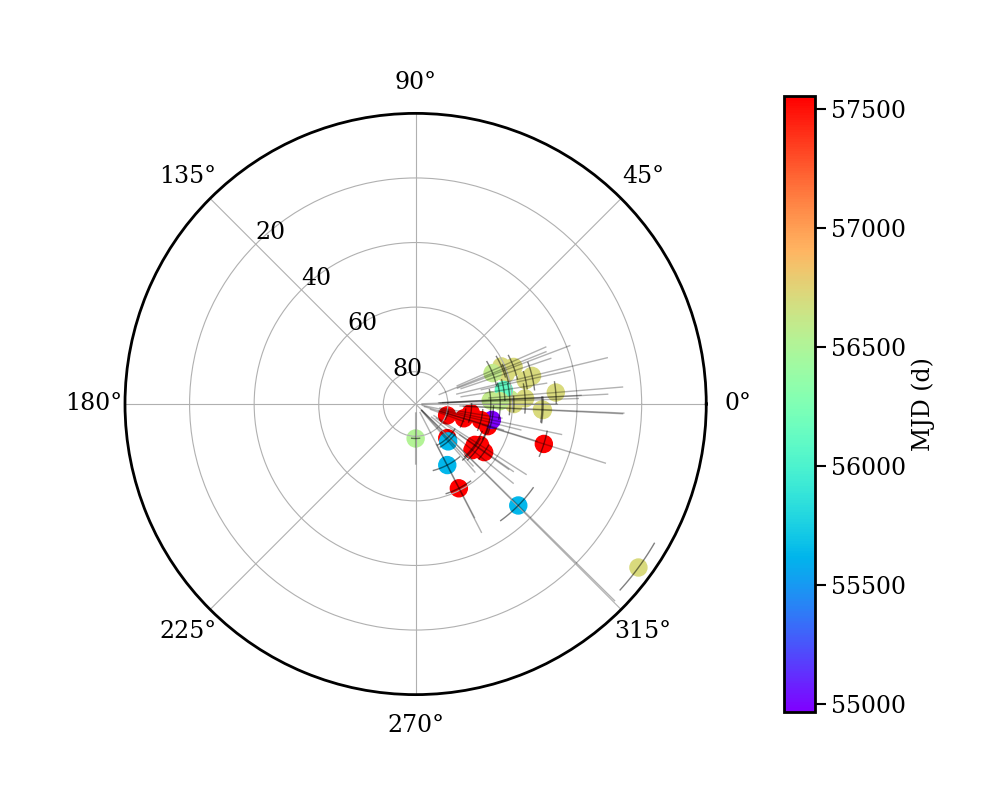
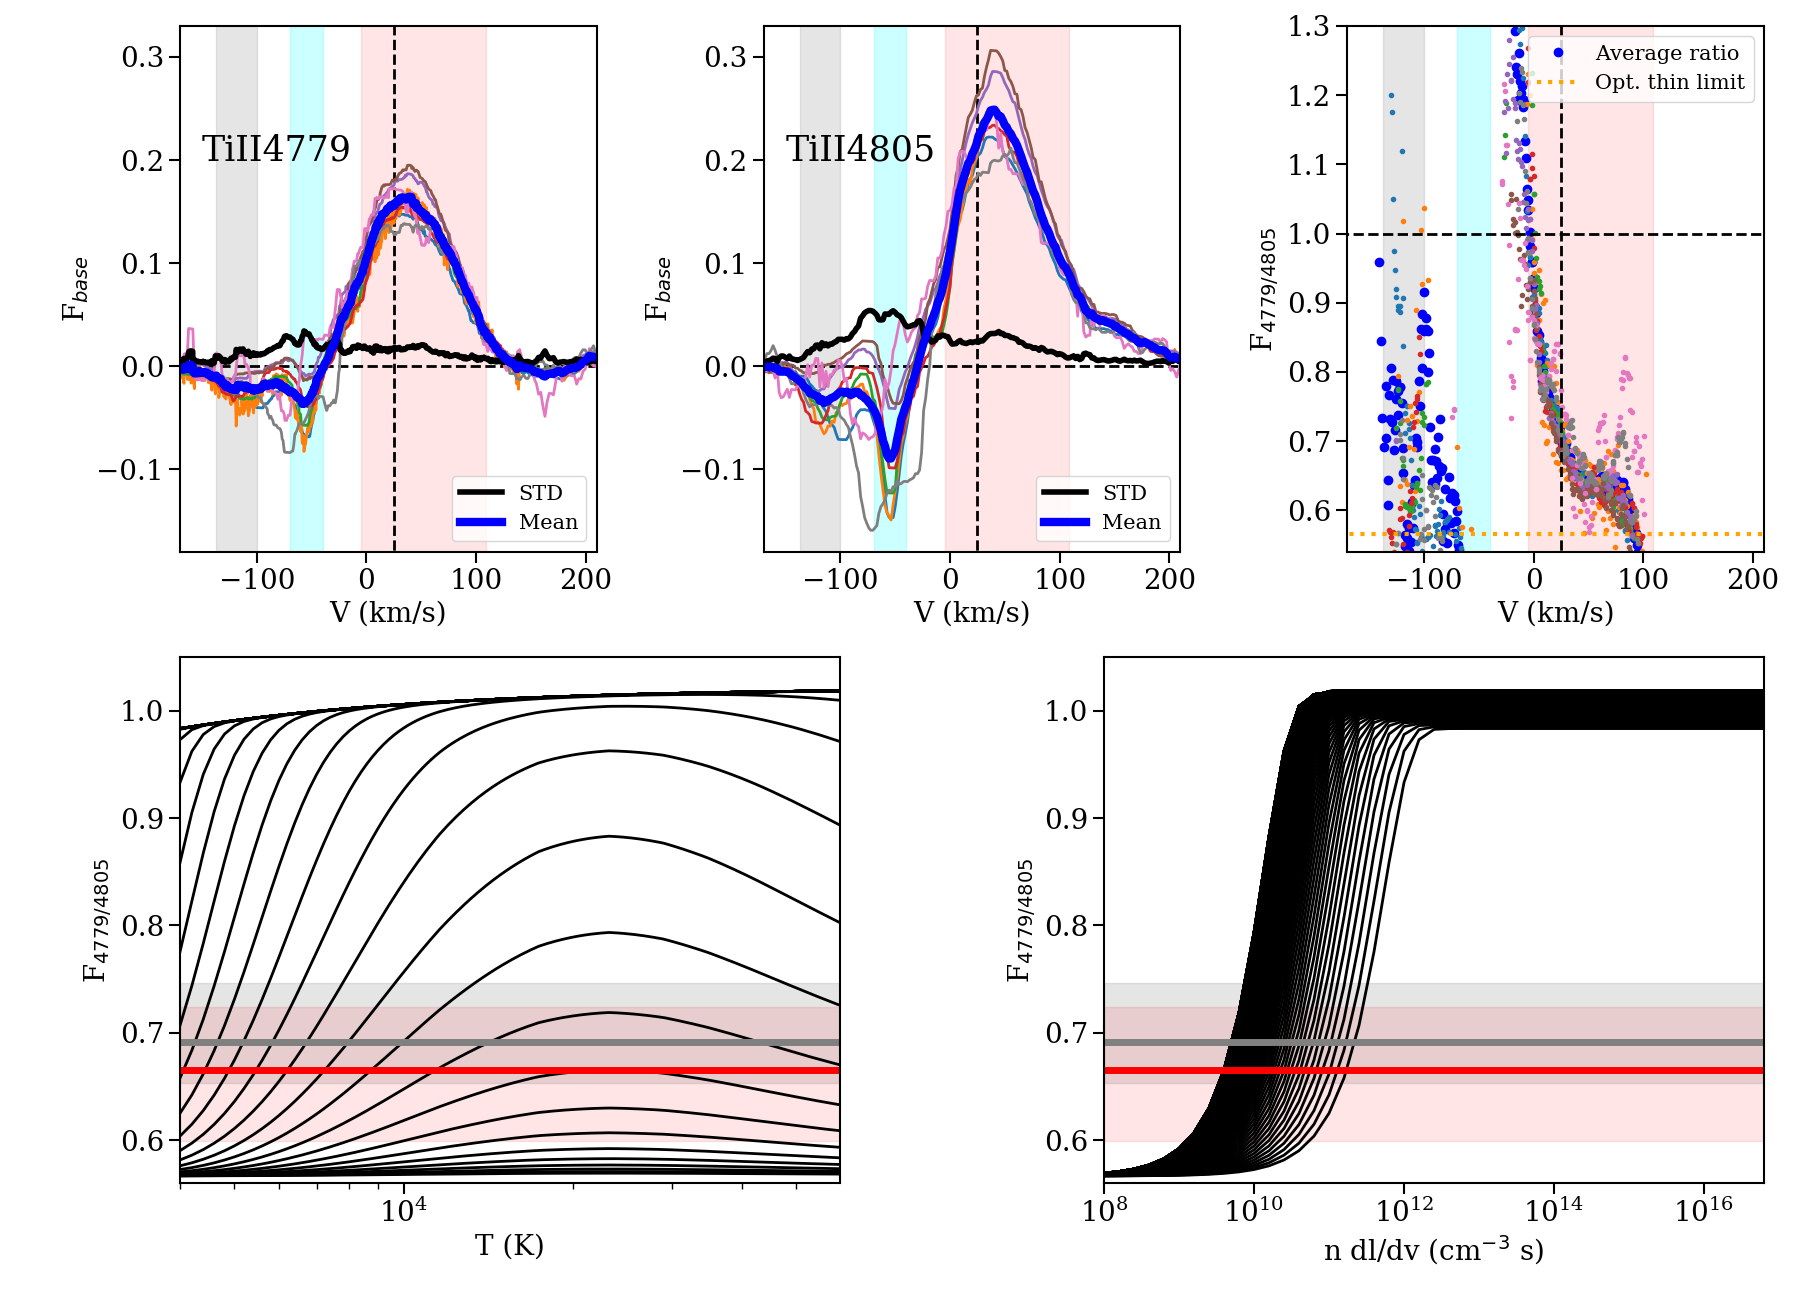
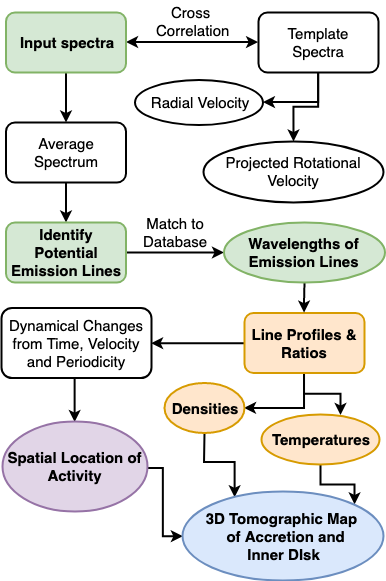
While direct mapping cannot access these regions, emission (and absorption) lines in young stars trace their winds, accretion-related structures, spots, and innermost disk. In the optical, a large number of species with various excitation potentials can provide information on the temperature, density, and velocity of hot and tiny structures. Using time-resolved spectroscopy covering several rotational and disk orbital periods, we can obtain a very detailed view of the structure and variability of accretion columns and spots and information on the presence and launching points of stellar/disk winds in young stars. In outbursting sources, the temperature variation allows us to spectroscopically access an even larger region of the disk and surroundings. 

But extracting this information is not a minor task. To make the process easier, we have created the STAR-MELT Python package that allows emission line identification, extraction, and fitting, using time-resolved spectra from any of the main ESO spectroscopes (and many other facilities).

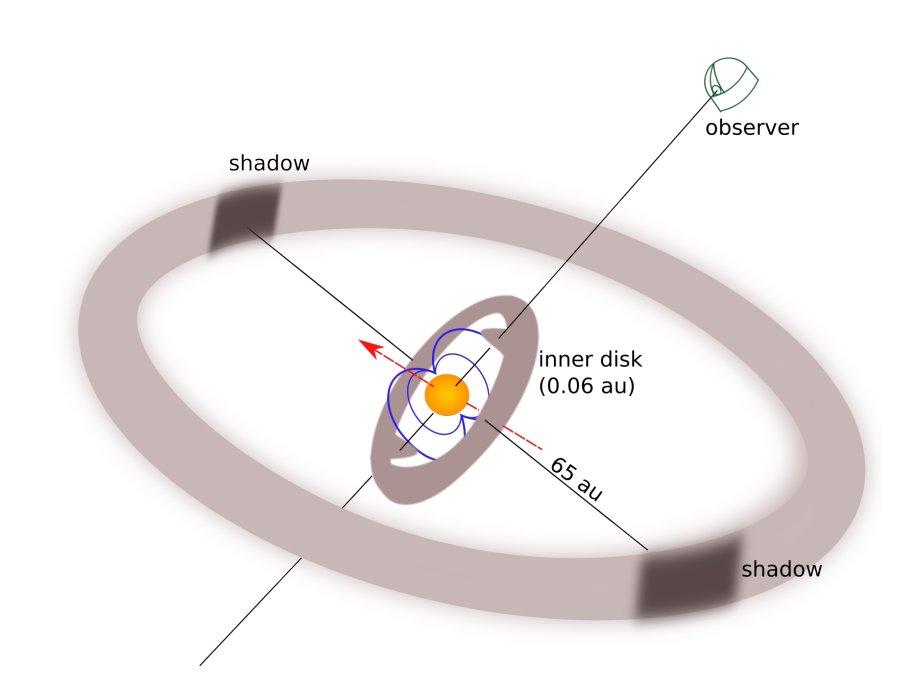
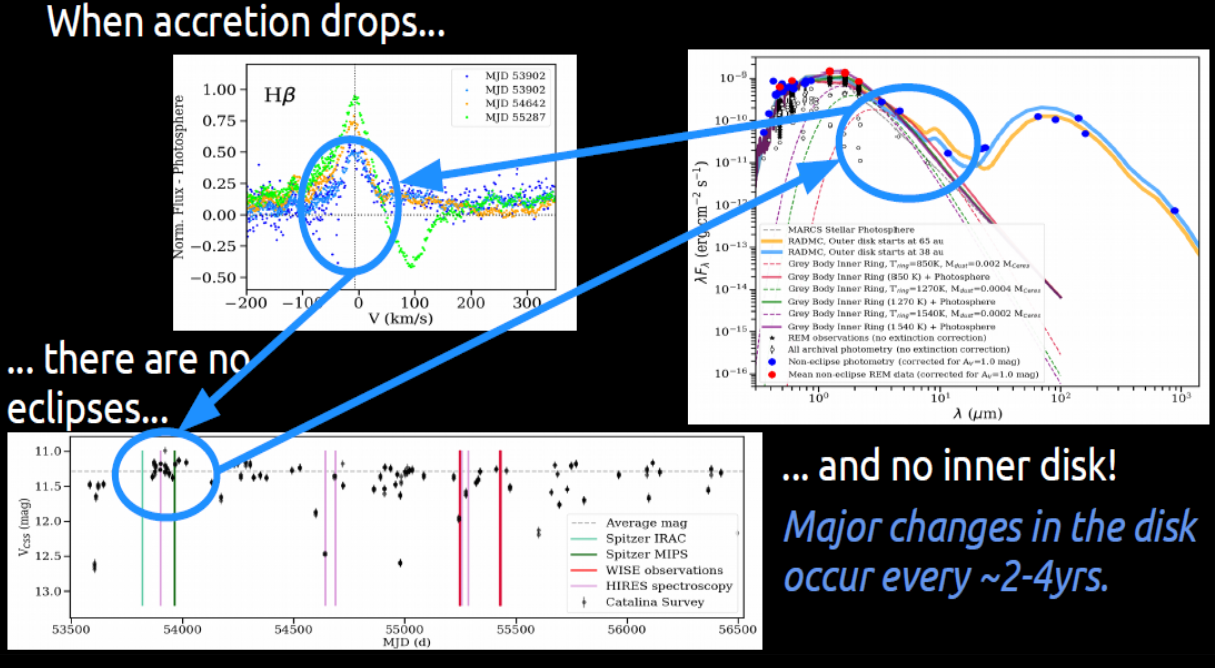
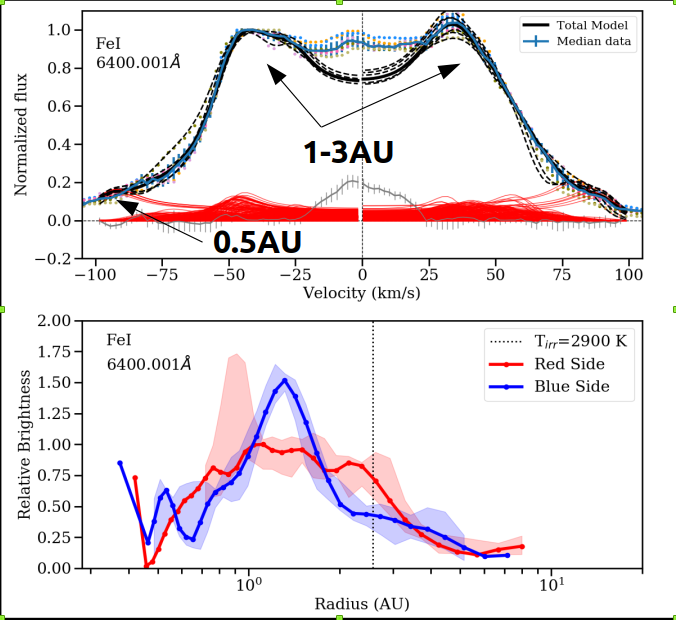
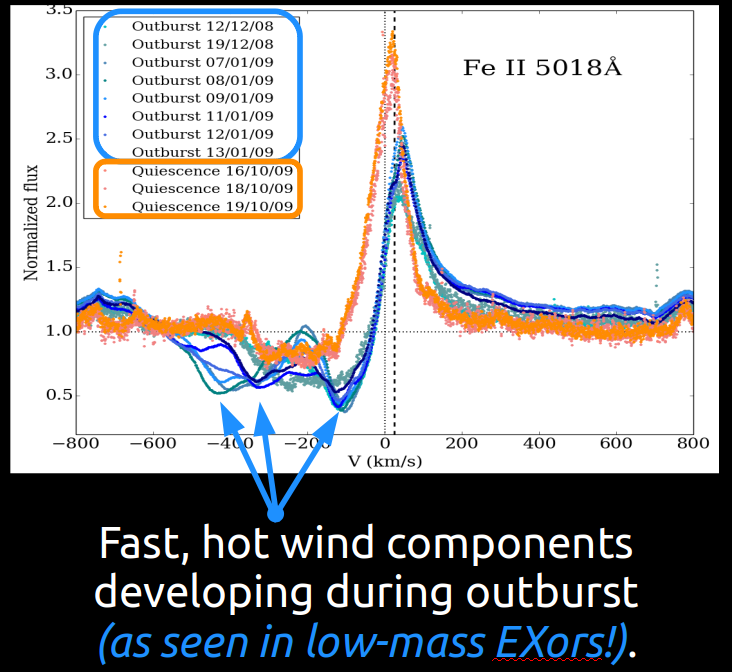
Here we present the results on several young stars, including EX Lupi (the prototype of outbursting EXor), J1604 (a source with two highly misaligned disks), and the outbursting HBe ZCMa NW, discussing what we can learn from "reading between the (spectral) lines".


The development of STAR-MELT is funded by STFC grant ST/S000399/1

Your stars are no longer young? You have lines but no stars?
No problem! If lines are there, STAR-MELT can find them and read between them!   

Please  contact ASA & JCW for details.

EX Lupi: The outbursting star in quiescence

EX Lupi, the prototype of EXor variable stars, has a large number of emission lines in the optical. These emission lines make a radial velocity measurement very complicated [Kospal et al. 2014] but also revealed the presence of a stable accretion column rotating with the stellar 7.417d period [Sicilia-Aguilar et al. 2015].

STAR-MELT allows to extract and fit the lines with unprecedented accuracy, so that the velocity modulation of lines from different species can be examined along various epochs.

Variations in amplitude and phase indicate changes in the location of the hot spot that produces the lines, associated with the footprint of the accretion column.

The amplitude of the modulations observed in the emission lines is below the projected rotational velocity of the star (vsini) and the line periodicity is the same than the rotational period of the star (7.417d), which suggest that the line emission originates very close to the stellar surface in a stable hot spot associated with the post-shock region of a single stable accretion column.

By analyzing the time variability of the radial velocity of lines from different species, we can derive their periodicity, phase and amplitude. The radial velocities of He I/II, Fe I/II, Mg I/II, and Si II lines are all modulated by the stellar rotation. Nevertheless, we observe variations in the amplitude of the modulation and, to lesser extent, in the phase, which translates into variations of latitude and longitude of the hot spot over the stellar surface.

Only the higher energy HeII lines have amplitudes that sometimes equal (or surpass) vsini. Although the uncertainties do not allow to rule out that the emission originates from the stellar surface, it may indicate that the He II emission originates either at a larger distance over the photosphere, or closer to the stellar equator.

The rotational modulation of the CaII IR triplet is uncertain. The lines display little rotational modulation and uncertain periodicity, sometimes consistent with half a rotational period. This may indicate the presence of more than one component originating the CaII IR emission, or also a spot closer to the stellar pole. Together with the results for the He II lines, this reveals a temperature gradient of the hot spot structure along the stellar surface.


The polar plots above and on the left show the distribution of the line emission over the stellar visible hemisphere, color-coded according to species (top) or to the MJD (left). Note that the inclination of EX Lupi is 20 degrees with respect to the line-of-sight.

Although the accretion column is found to be stable over the 10 years of data analyzed in Campbell-White et al. 2021, there is a significant variation in the position of the column vs time (see left figure). 

This could result from changes in the position of the accretion column likely linked to changes in the magnetic field driving accretion. The emission from all species remains arising from a very small part of the stellar surface at all dates, revealing that the post-shock region is stable and compact.

[Campbell-White et al. 2021]

J1604: A tale of two disks

J1604 is known for its two disks, highly inclined with respect to each other [Pinilla et al. 2018]. The inclined inner disk is also responsible for the eclipses observed in the optical lightcurve [Ansdell et al. 2016; Rebull et al. 2018]. Time-resolved photometry from the ground and with K2 allows us to construct the inner disk picture below [Sicilia-Aguilar et al. 2020a].

The rapid variability from period to period (see K2 curve below) betrays the presence of two accretion columns connected to the disk.  Accretion "recycles" the matter causing the eclipses in a couple of rotational periods, explaining the rapid variability.

Longer-time IR variability had been reported before [Luhmann & Mamajek 2012]. Putting together the available spectroscopy and longer term photometry in the optical and IR, we find that sometimes accretion drops... together with the eclipses and with the evidence of near-IR excess. This is a signature of draining (and re-filling) the inner disk on few-years timescales [Sicilia-Aguilar et al. 2020a].

Z CMa NW: Massive but variable

ZCMa NW is the companion to the ZCMa FUor object, itself an outbursting EXor-type variable [Shevchenko et al. 1999], but also an intermediate-mass star [van den Ancker et al. 2004].

Spectroscopy in outburst and quiescence reveals a wealth of emission lines. The profiles of the low-energy metallic lines reveal an origin in a disk between 0.3-3au (see above). The disk has blue/red and also midplane/top layers asymmetries [Sicilia-Aguilar et al. 2020b].

Higher-energy lines are dominated by accretion and wind. The wind in outburst (blue) has several complex, variable, non-axisymmetric components (see above), similar to what is observed in low-mass EXors [Sicilia-Aguilar et al. 2020b].

Combining the many lines observed, we can also constrain the temperature and density structure of the line-emitting regions.

Using the Sobolev approximation and line ratios of lines from the same upper level, we can constrain temperatures and densities of the emitting region.

The combination of many lines with the same type of profile and physical origin allows to add further constraints.

STAR-MELT

STAR-MELT is now offered on a collaborative basis and will be soon released as a Python package via GitHub.

STAR-MELT can help to extract emission lines of any spectra, not only those of young stars (see for instance Spathis et al. 2021 regarding applications in laboratory planetary science). We have ongoing collaborations with the University of Glasgow to use STAR-MELT to analyze time-resolved spectroscopy of coronal mass ejections.

We are happy to help you tune STAR-MELT for your science case, just contact ASA and JCW.

References

STAR-MELT is funded by STFC grant ST/S000399/1

Main STAR-MELT reference:  Campbell-White et al. 2021 subm to MNRAS

STAR-MELT will be released soon here: https://github.com/justyncw/STAR_MELT

References

Ansdell et al. 2016, MNRAS, 462, L101

Campbell-White et al. 2021 subm to MNRAS

Fang et al. 2014, A&A, 570, A118

Grankin & Artemenko 2009, IBVS, 5905, 1

Kóspál et al. 2014, A&A, 561, 61

Luhman & Mamajek 2012, ApJ, 758, 31

Pinilla et al. 2018, ApJ, 868, 85

Rebull et al. 2018, AJ, 155, 196

Shevchenko et al. 1999, MNRAS, 310, 210

Sicilia-Aguilar et al. 2015, A&A 580, 82

Sicilia-Aguilar et al. 2020a, A&A 633, 37

Sicilia-Aguilar et al. 2020b, A&A 643, 29

van den Ancker et al. 2004, MNRAS, 349, 1516