The wind duty cycle of the Einstein Cross

Elena Bertola 1 , Mauro Dadina 2 , Massimo Cappi 2 , Cristian Vignali 1,2 , George Chartas 3 , Barbara De Marco 4 , Giorgio Lanzuisi 2 , Margherita Giustini 5 , Eleonora Torresi 2

  • 1 Physics and Astronomy Department, University Of Bologna, Bologna
  • 2 INAF-OAS Bologna, Bologna
  • 3 Department of Physics and Astronomy of the College of Charleston, Charleston
  • 4 N. Copernicus Astronomical Center of the Polish Academy of Sciences, Warsaw
  • 5 Centro de Astrobiologìa (CSIC-INTA), Madrid

Abstract

Ultra-fast outflows (UFOs) are often identified as the origin of kpc-scale outflows, which are possibly the main actors in establishing the co-evolution between active galactic nuclei (AGN) and their host galaxies. UFOs are well characterized in local AGN but we are still quite groping in the dark for what concerns higher redshifts. Searching for evidence of UFOs in high-z quasars is thus crucial to test wind-driven AGN feedback models around the Cosmic Noon (z~2), i.e. when these phenomena are expected to be most relevant. I will present our study of Q2237+030, the Einstein Cross, a quadruply-imaged radio-quiet lensed quasar located at z=1.695. We performed a systematic and comprehensive temporally and spatially resolved X-ray spectral analysis of all the available Chandra and XMM-Newton data. We find clear evidence for spectral variability, possibly due to absorption column density (or covering fraction) variability intrinsic to the source. For the first time in this quasar, we detect a fast X-ray wind outflowing at v~0.1c and also a faster component, with velocity up to v~0.5c. Crucial result of our work is the first estimate of the wind duty cycle in a high-z quasar; given the large sample and long time interval spanned by the analyzed X-ray data, we are able to roughly estimate such quantity as ~0.46 (0.31) at 90% (95%) confidence level.

Q2237+030

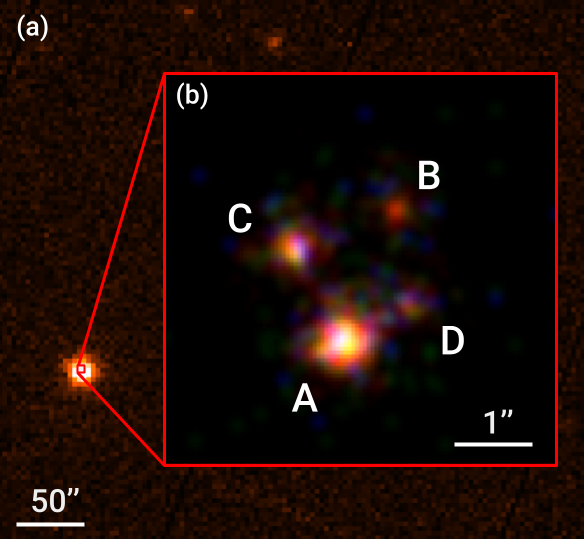
Figure 1: (a) EPIC-pn cleaned image of the first XMM-Newton exposure in the 0.3–10 keV observed-energy band. The red square marks the 5'' region of the Chandra image centered on the quasar and shown in inset (b). (b) Raw Chandra image of Q2237+030 (ObsID 431) binned with a bin size of 0.1'', color-coded based on the observed-energy bands: 0.4–2 keV in red,  2–4.5 keV in green, and 4.5–7 keV in blue. The images are named A, B, C, and D as in Yee (1988). Given the quasar redshift (zQ = 1.695), 100'' separation corresponds to a distance of 8.68 kpc (cosmology values: H0 = 70.0 km s−1 Mpc−1 , Λ0 = 0.73).

  • Radio-quiet quasar at z = 1.695
  • Lensed in four images (Fig. 1) by nearby galaxy (z = 0.039; Huchra et al. 1985)
  • Magnification factor ~ 16 (Schneider et al. 1988, Schmidt et al. 1998; Wertz & Surdej 2014)
  • Image time delays ranging from ~2h to ~16h
    (Dai et al., 2003; Schmidt et al. 1998; Wertz & Surdej 2014)
  • Ideal source to study microlensing effects (Dai et al., 2003; Chen et al., 2011, 2012; Mosquera et al. 2013; Guerras et al. 2017)

  • Many monitoring campaigns in optical and X-ray band
  • 40 X-ray archival observations (as of Sept. 2019)
    • 37 Chandra + 3 XMM-Newton exposures

    • Spatially resolved in Chandra data
      • We refer to Chandra observation using the CXO ObsID

    • XMM-Newton exposures provide better counting-statistics spectra, apart from the last observation, which we discard because of high flare contamination
      • First XMM-Newton obs.: XMM 2002
      • Last XMM-Newton obs.: XMM 2018


References
:

Chen, B., Dai, X., Kochanek, C. S., et al. 2011, ApJ, 740, L34
Chen, B., Dai, X., Kochanek, C. S., et al. 2012, ApJ, 755, 24
Dai, X., Chartas, G., Agol, E., Bautz, M. W., & Garmire, G. P. 2003, ApJ, 589, 100
Huchra, J., Gorenstein, M., Kent, S., et al. 1985, AJ, 90, 691
Mosquera, A. M., Kochanek, C. S., Chen, B., et al. 2013, ApJ, 769, 53
Schmidt, R., Webster, R. L., & Lewis, G. F. 1998, MNRAS, 295, 488
Schneider, D. P., Turner, E. L., Gunn, J. E., et al. 1988, AJ, 95, 1619
Wertz, O., & Surdej, J. 2014, MNRAS, 442, 428
Yee, H. K. C. 1988, AJ, 95, 1331

UFOs in Chandra data

Figure 4: 90% energy-normalization confidence contours (1.6σ) for the absorption lines reported in Table 1 (ObsIDs 431 A, 11534 A, 12831 A, 13961 A, 14514 A). Those in blue correspond to the lines detected at more than a 99% confidence level (based on the Monte-Carlo-simulation significance).

We applied a signal-to-noise cut to Chandra data to select only those spectra with more than 500cts in the 0.4-7 keV observed-frame energy band. We find that 14 spectra match the criterion and we refer to them as the high-statistics sample (HSS).
These spectra were extracted from 11 epochs, since two lensed images are found to be above threshold in three epochs (ObsIDs 431, 11534, 12831).

This selection is necessary to carry out a reliable analysis of the absorption features typical of UFOs. To that aim, we bin our data to at least 20cts/bin and use χ2 statistics.

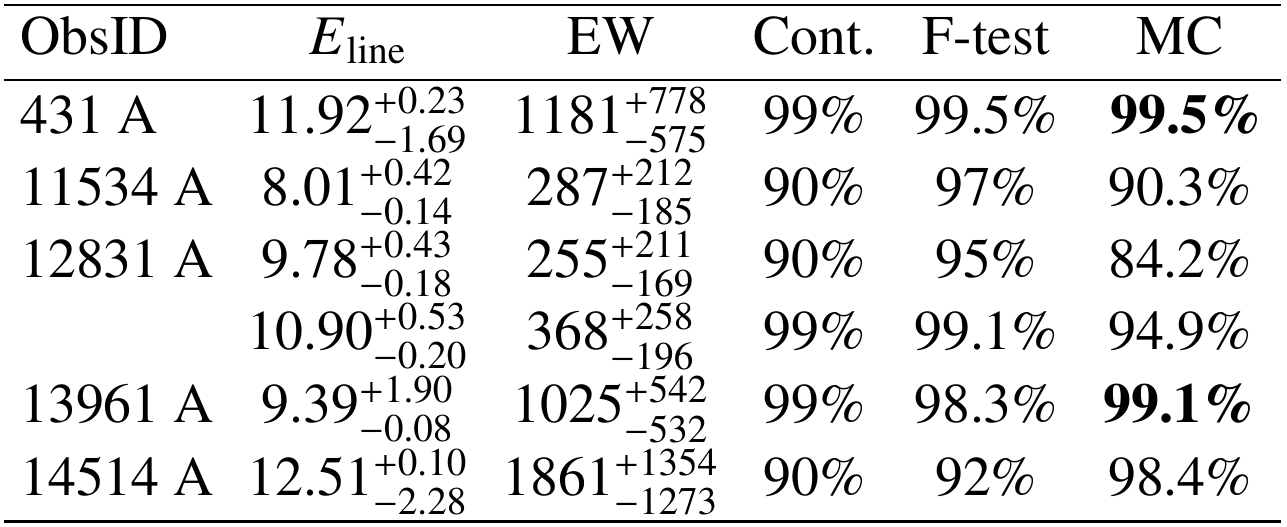
We blindly scan the HSS for Gaussian lines following the procedure of Tombesi et al. (2010). The absorption lines were then validated by computing their significance through both the F-test and Monte Carlo (MC) simulations (Protassov et al. 2002). We only consider those detected at more than 90% confidence by both methods. Table 1 summarizes the properties of all absorption lines detected above 90% confidence level through the F-test.

Figure 4 shows the 90% confidence contours of the detected absorption lines. Interestingly, the majority of them are clustered around 11 keV rest frame and correspond to outflow velocity ranging from 0.3c to 0.5c.

Table 1:  Rest-frame energies and equivalent widths of the absorption lines detected at more than 90% confidence in
the HSS, based on the F-test.


Notes: Significance levels above 99% confidence, according to Monte Carlo simulations, are reported in boldface. Column 1: ObsID and image; Col. 2: line energy (in units of keV); Col. 3: line rest-frame equivalent width (in units of eV); Col. 4: blind-search confidence level; Col. 5: F-test confidence level; Col. 6: Monte-Carlo-simulation confidence level. All the errors are computed at a 90% confidence level for one parameter of interest. The energy width of the lines is set to 0.01 keV.

Through the binomial distribution, we evaluated the global probability of detecting these absorption lines in 5 spectra out of a sample of 14 by chance. We conservatively considered all the lines as detected at 90% confidence, even though more than half show higher significance.
The probability of a by-chance detection is P = 7.76 × 10⁻³, yielding an overall significance of 99.2% (i.e., slightly below 3σ) for the detection of these absorption lines at Erf > 7 keV throughout the HSS.


References:

Tombesi, F., Cappi, M., Reeves, J. N., et al. 2010, A&A, 521,  A57
Protassov, R., van Dyk, D. A., Connors, A., Kashyap, V. L., & Siemiginowska, A. 2002, ApJ, 571, 545

Spectral variability in Chandra data

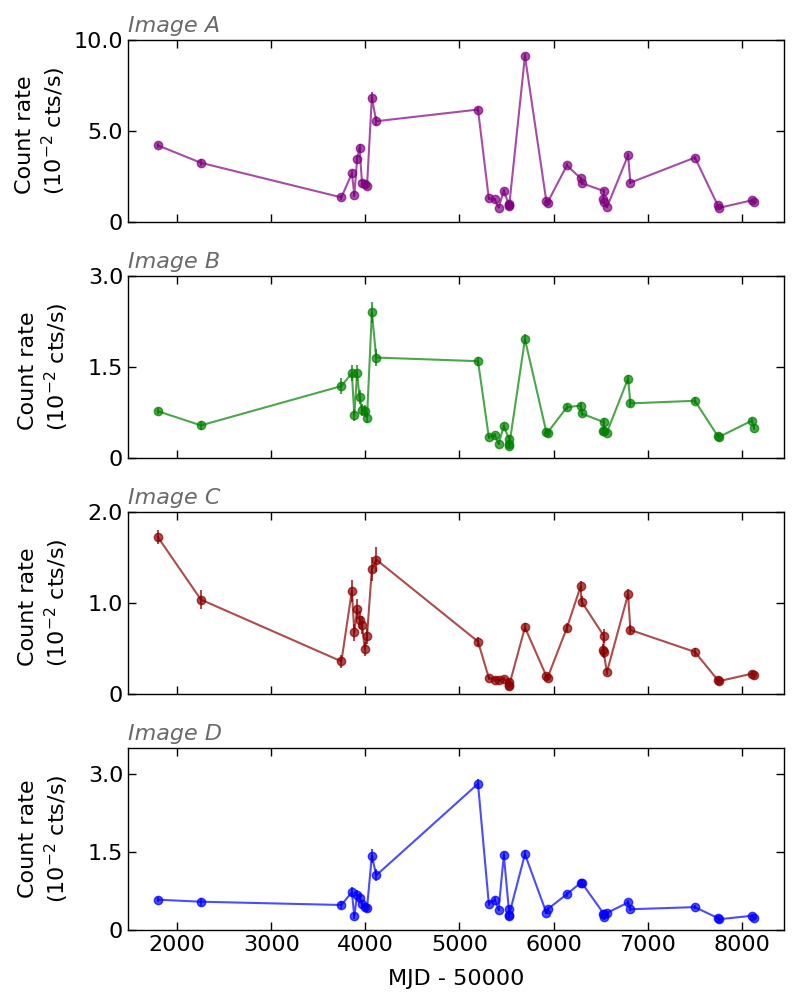
Figure 2: Chandra individual-image multi-epoch light curves. We show the mean count rate between 0.4 and 7.0 keV observed frame of each observation vs. time. From top to bottom: image A, image B, image C, image D. The error bars are derived from the error on the Poisson-distributed counts.

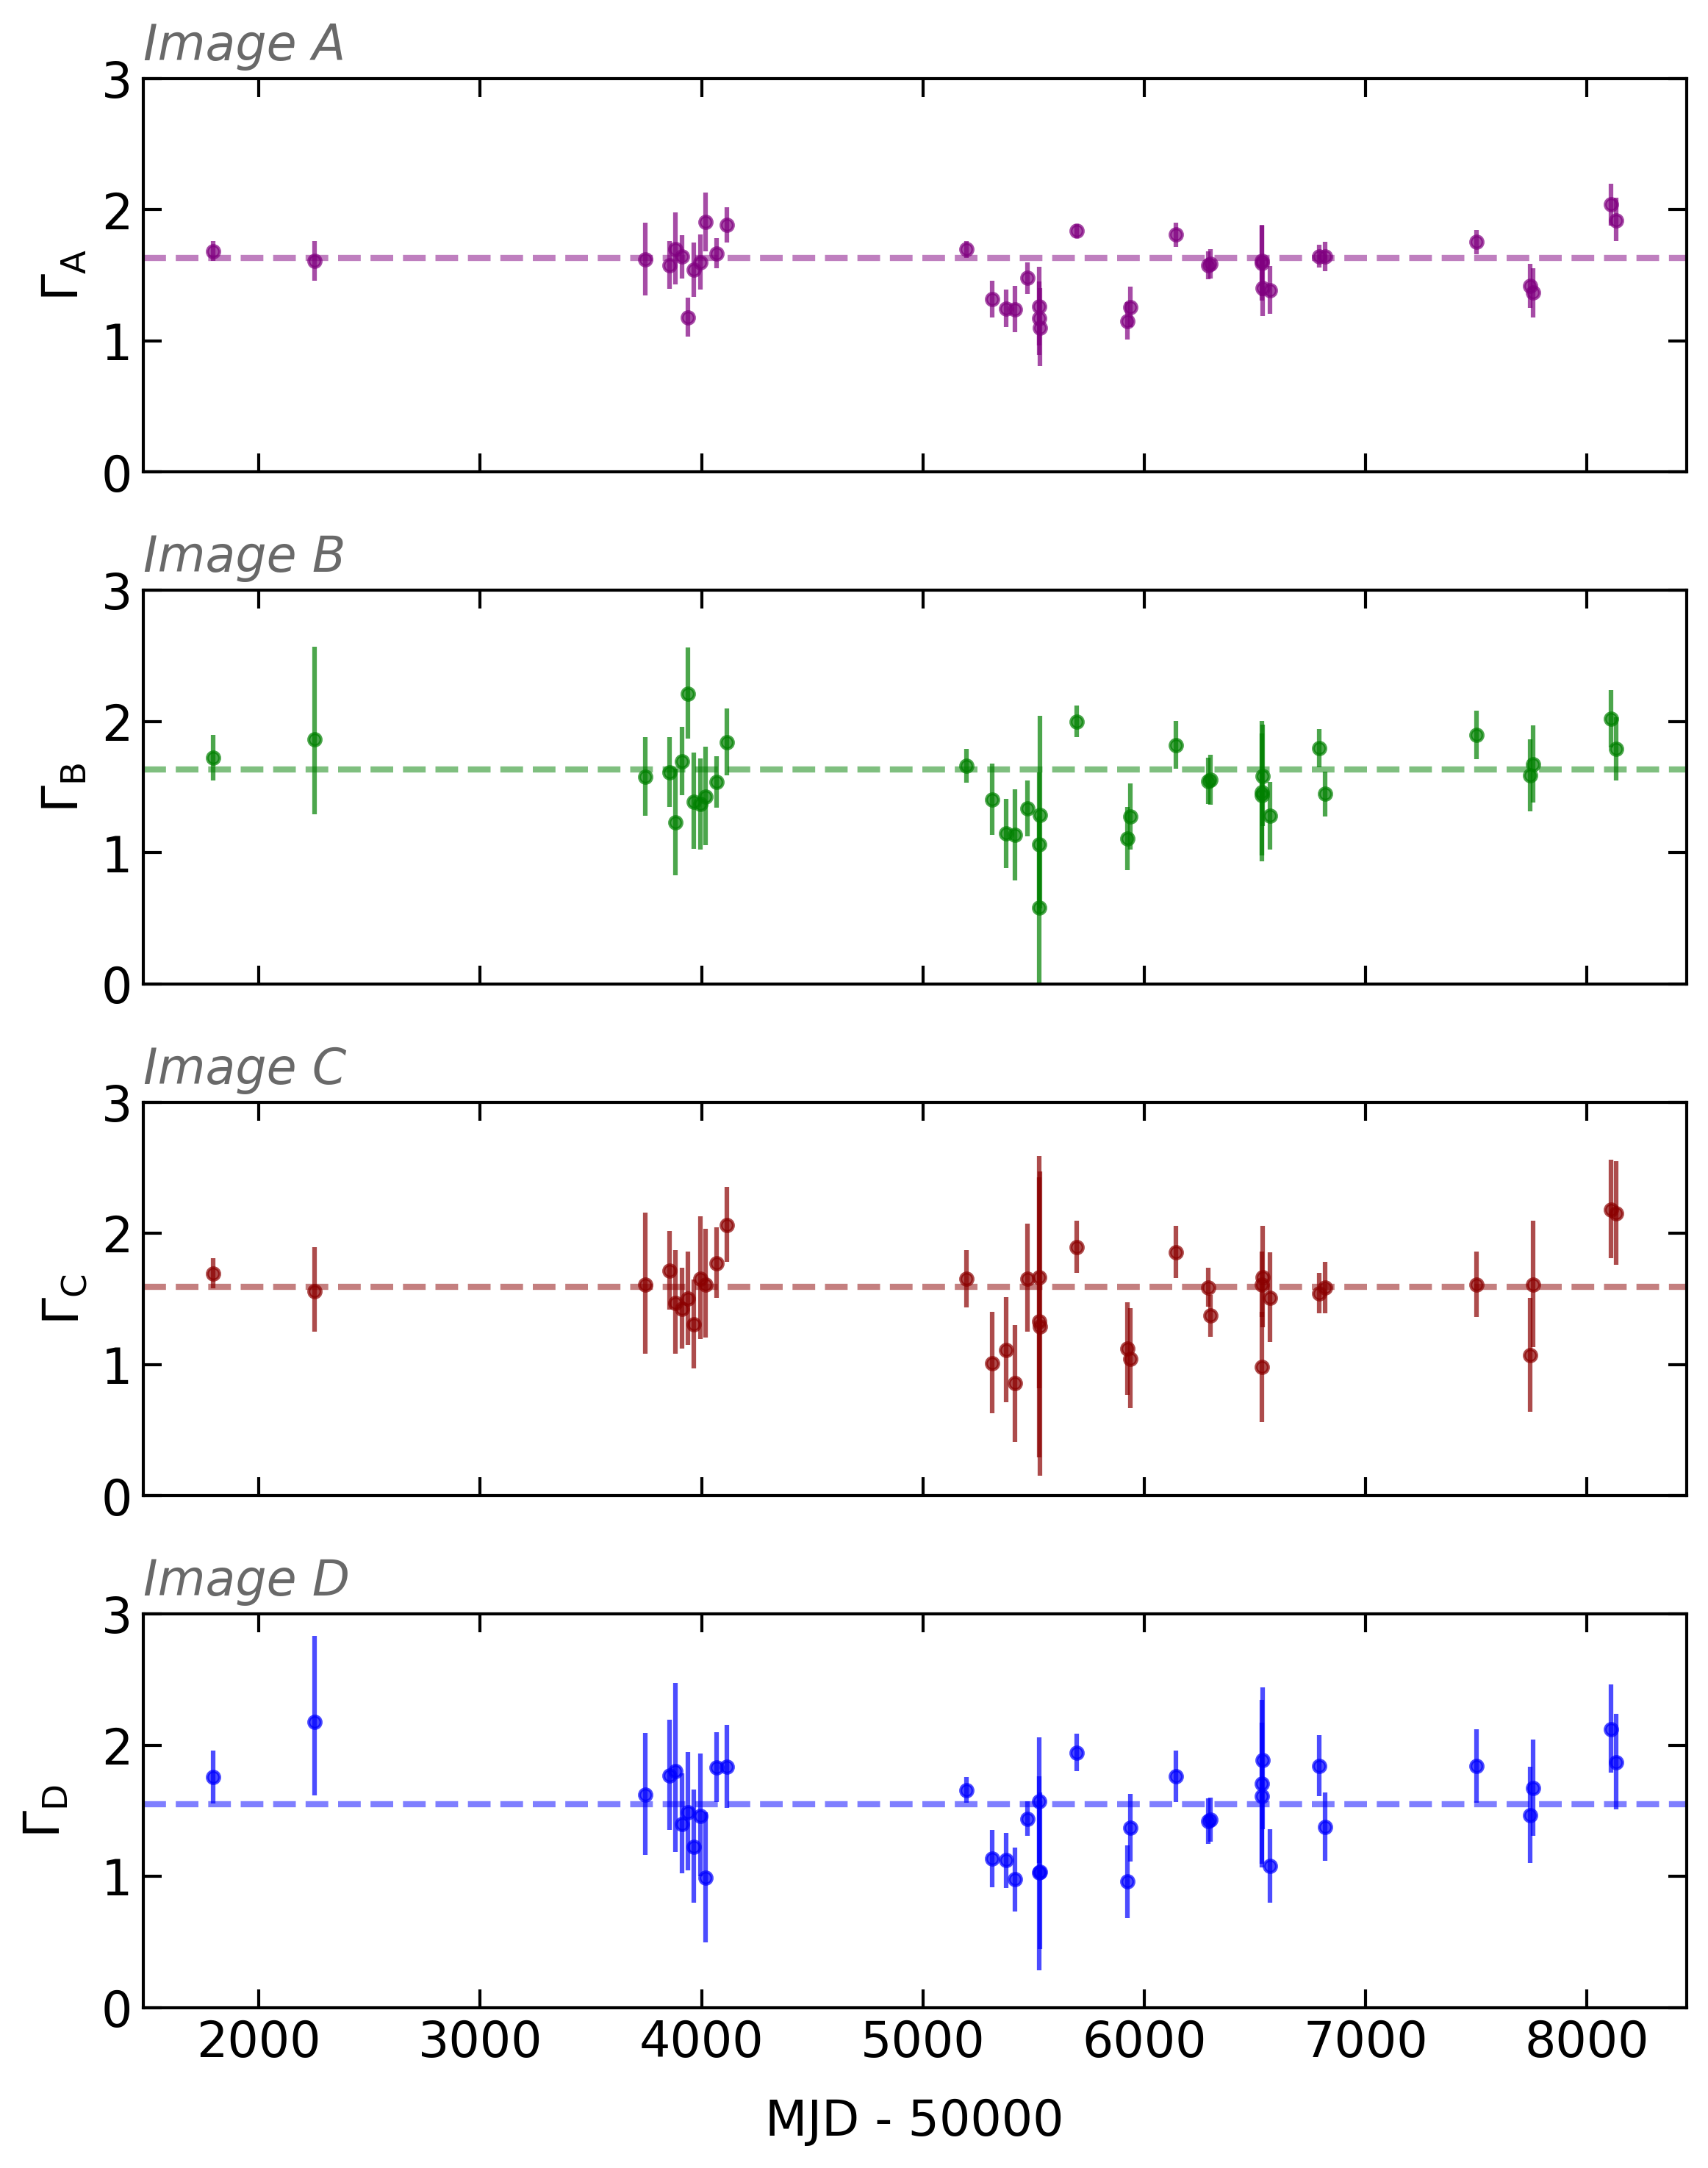
Figure 3: Variation of the photon index (1σ errors) for each image in the Chandra data as a function of time. The dashed line represents the best fit obtained using a constant function.

From the multi-epoch lightcurves of the four images (Fig. 2), we find discrepancies among them that are likely due to microlensing events, as previously found by Dai et al. (2003) and Chen et al. (2011, 2012). Nonetheless, microlensing is unlikely to fake UFO imprints.

Each image shows clear photon-index variability (Fig. 3). However, photon-index ratios among the four images are consistent with being constant. This allows us to rule out microlensing as the driver of spectral variability and thus investigate it as inherent to the quasar.

References:

Chen, B., Dai, X., Kochanek, C. S., et al. 2011, ApJ, 740, L34
Chen, B., Dai, X., Kochanek, C. S., et al. 2012, ApJ, 755, 24
Dai, X., Chartas, G., Agol, E., Bautz, M. W., & Garmire, G. P. 2003, ApJ, 589, 100

UFOs in XMM-Newton data

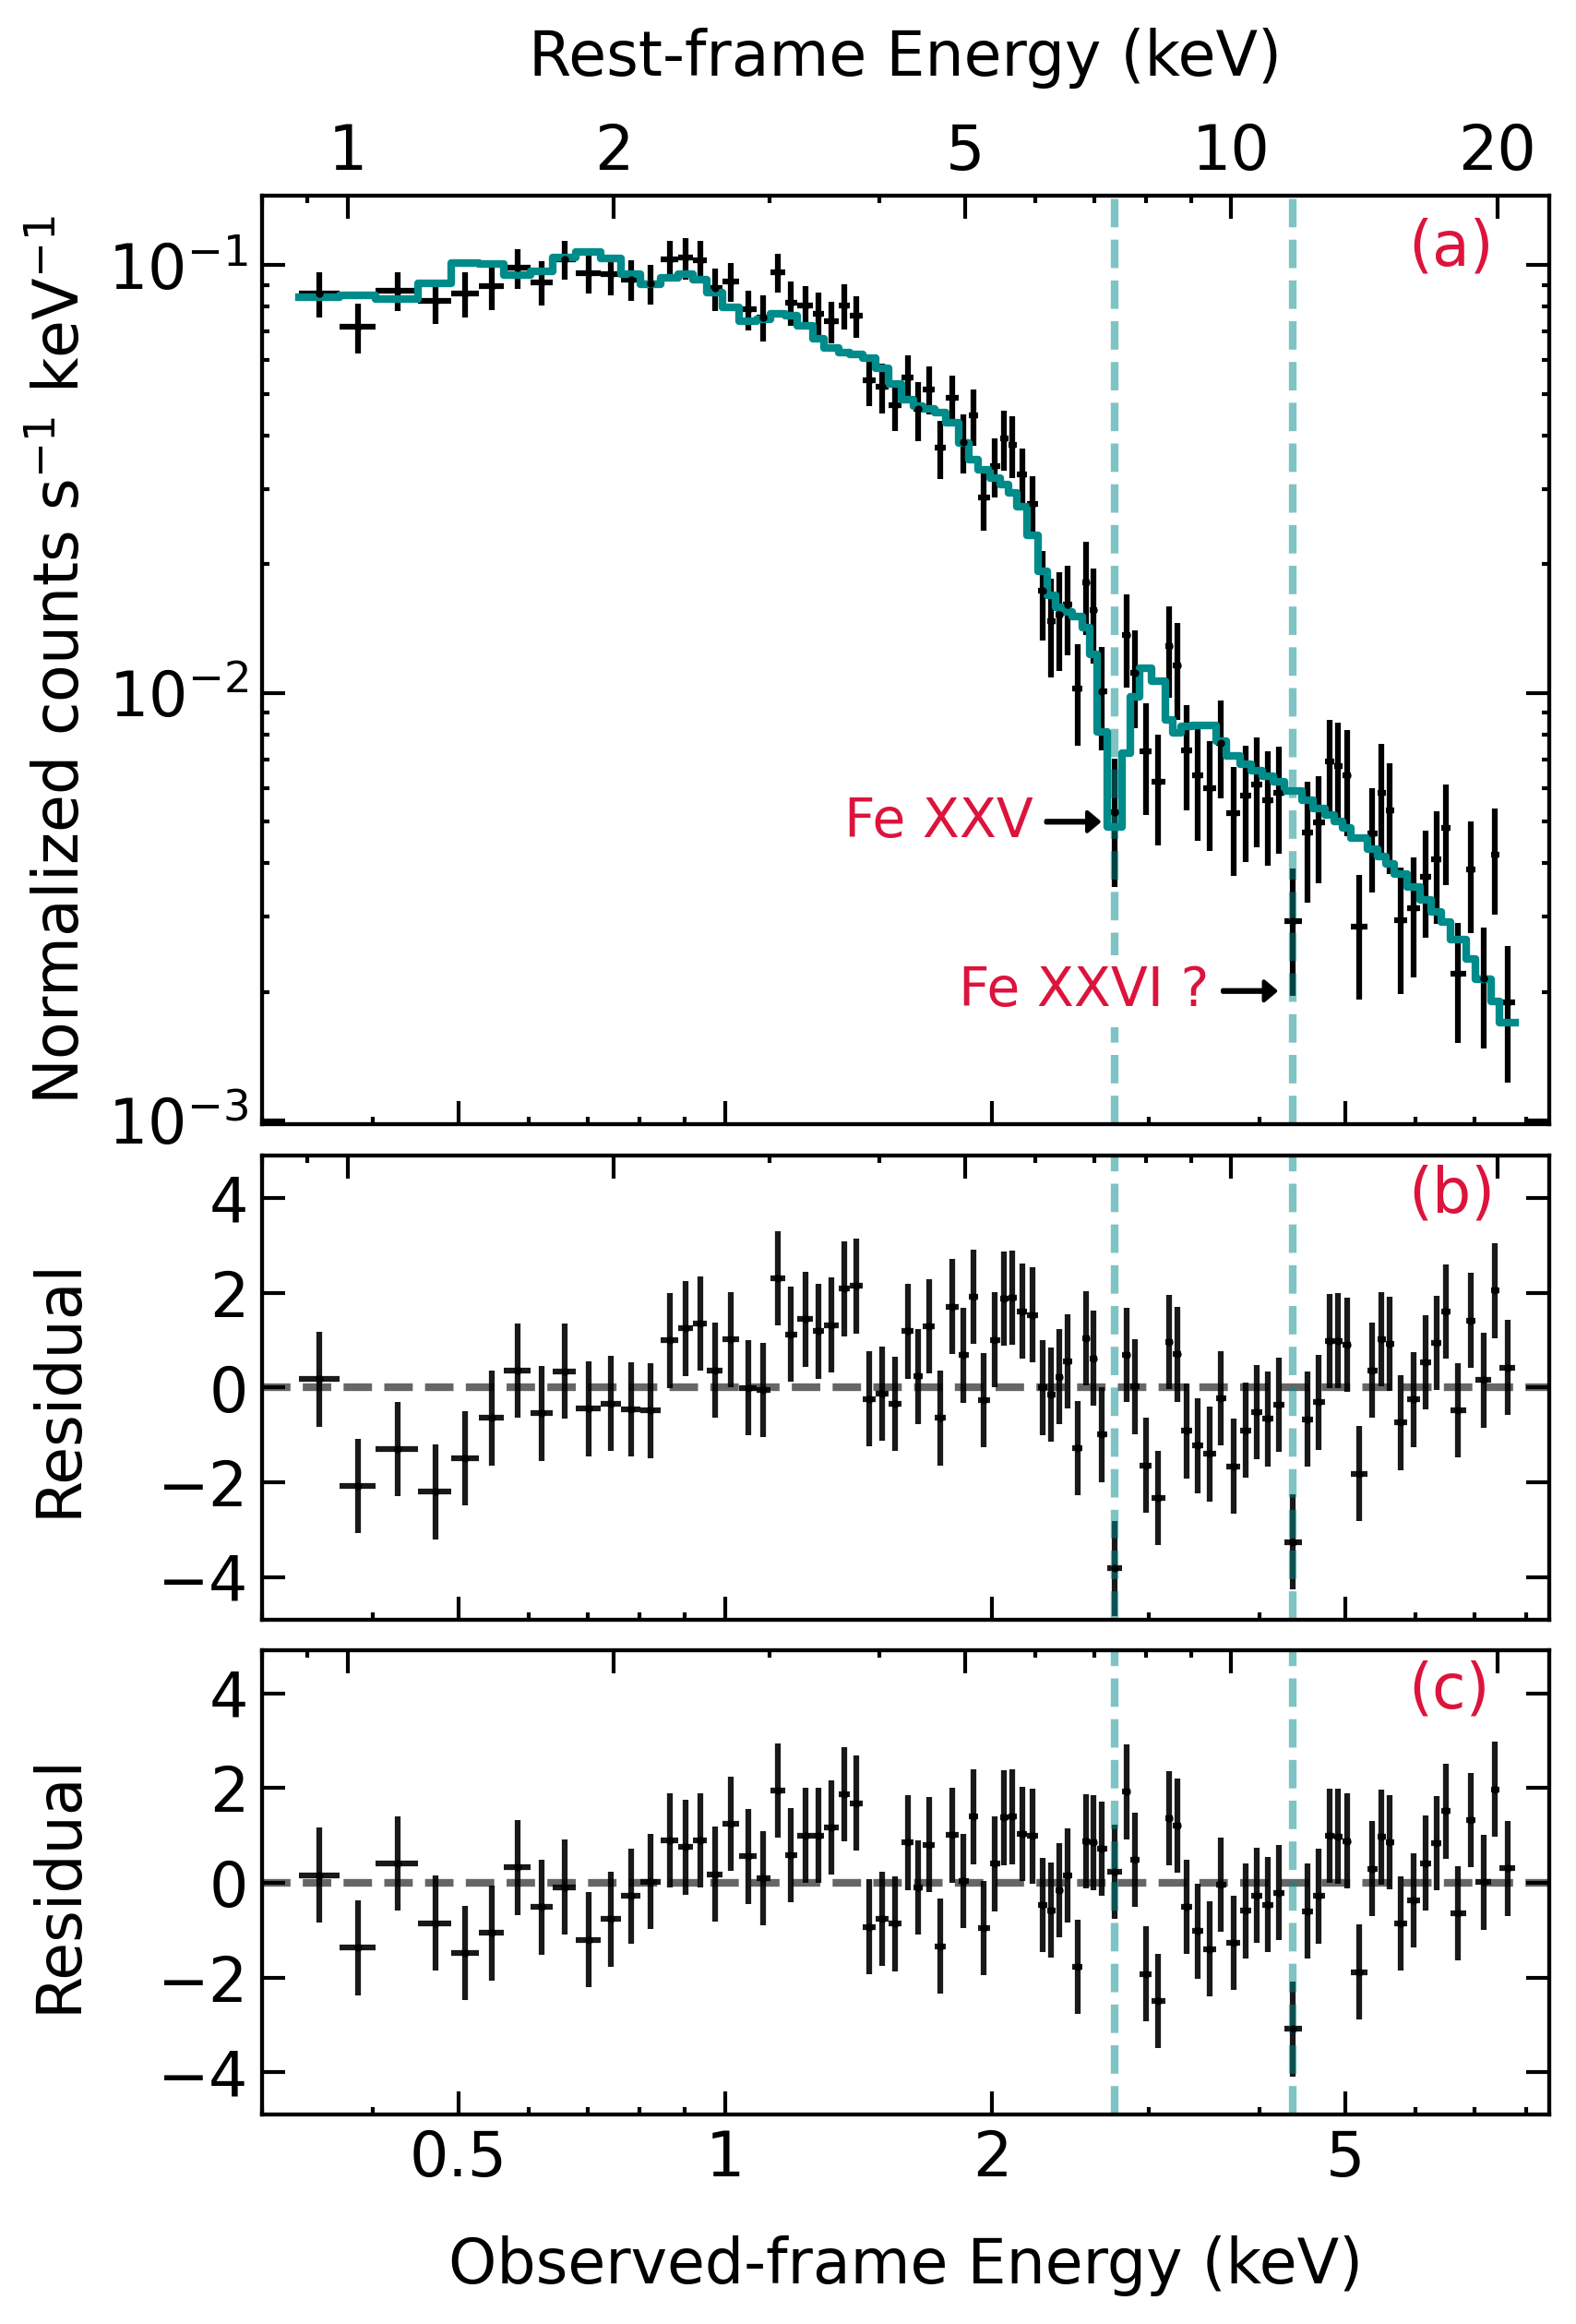
XMM 2002 EPIC-pn spectrum of Q2237. Panel a: XMM 2002 data (black) and best-fit model (solid blue line) using a power law absorbed by Xstar analytic model warmabs. The dashed blue lines indicate the UFO signatures. Panel b: XMM 2002 best-fit residuals for a single power law. Panel c: XMM 2002 best-fit residuals against a power law absorbed by warmabs. The latter model self-consistently accounts for the absorption line at Erf ~ 7.4 keV. The data are grouped to obtain at least 20 cts/bin, with the minimum energy width set to one third of the CCD energy resolution. The best-fit parameters are summarized in Table 5. Due to background-dominated bins above 8.0 keV, we restricted the fitting to the 0.3–8 keV observed-energy range (0.8–22 keV rest-frame energy range).

XMM 2002 observation

Two narrow absorption lines

  • Erest≃ 7.4 keV
    MC significance:  97.9% confidence level
    • Consistent with the absorption line detected in the stacking of Chandra spectra from all images and epochs
  • Erest≃ 11.8 keV
    MC significance: 87% confidence level
    • Energy is consistent with lines in the Chandra sample

We test the UFO scenario through the Xstar analytic model warmabs, which self-consistently accounts for X-ray absorption by a (possibly outflowing) medium, ionized by the very same AGN emission.

XMM 2002 data are best reproduced by a rather thick (NH ~ 2.8 × 1023 cm-2), highly ionized absorber (log (ξ/erg s-1cm) ~ 2.5), outflowing at v ~ 0.1c. The wind is consistent with the absorption line at ~ 7.4 keV, but fails to explain the one at ~ 11.8 keV. We note that the latter is consistent with the bulk of the lines detected in Chandra data (Table 1).

From the properties of the outflowing medium an assuming as launching radius the distance at which the escape velocity equals the outflow velocity, we find a mass-outflow rate of ~ 5 Mo yr-1 (Crenshaw et al. 2003). The outflow kinetic power is ~10% of the quasar's bolometric luminosity, assessed from the 1450A luminosity of Assef et al. (2011) assuming a conversion factor of 4, as reported in Richards et al. (2006). Such ratio is well above the threshold predicted by models for efficient wind-driven feedback (e.g., Di Matteo et al. 2005; Hopkins & Elvis 2010), making this outflow actually capable of impacting the host-galaxy evolution.


XMM 2018 observation

Sixteen years after the first XMM observation (~6yrs in the quasar's rest frame), we find no evidence for UFOs. However, absorption is still a key ingredient in the Einstein Cross's spectra. In fact, we detect a rather thick (NH ~ 1023 cm-2),  partial-covering (CF~50%)  absorber showing a low-ionization state (log (ξ/erg s-1 cm) < 2.2 at 90% confidence level).

Such upper limit on its ionization allows us to speculate on the medium's location. Converting the ionization parameter ξ in the distance r from the ionizing source, we find r > 4.7 pc. Thus, the absorber is consistent with being part of the broad-line region or the molecular torus (e.g., Burtscher et al. 2013)

References:

Burtscher, L., Meisenheimer, K., Tristram, K. R. W., et al. 2013, A&A, 558, A149
Crenshaw, D. M., Kraemer, S. B., & George, I. M. 2003, ARA&A, 41, 117
Dai, X., Chartas, G., Agol, E., Bautz, M. W., & Garmire, G. P. 2003, ApJ, 589, 100
Di Matteo, T., Springel, V., & Hernquist, L. 2005, Nature, 433, 604
Hopkins, P. F., & Elvis, M. 2010, MNRAS, 401, 7


Aim of this work

Combining Chandra and XMM-Newton complementary strengths, we perform the first systematic and comprehensive, temporally and spatially resolved X-ray spectral analysis of Q2237+030. By taking advantage of the many available X-ray exposures tailored to study microlensing events, we aim at studying the source spectral variability and investigate whether it can be ascribed to a variable absorber and, possibly to UFOs, over ~20 years (observed frame).

Scientific context

AGN feedback is thought to be responsible for establishing the so-called AGN-galaxy co-evolution by triggering kpc-scale outflows. Theoretical models often identify ultra-fast outflows (UFOs) as the first link in the chain of AGN wind-driven feedback (e.g. King & Pounds, 2015). UFOs are well characterized in local AGN but much less is known in quasars at the cosmic time when star formation and AGN activity peaked (z ~ 1–3, e.g. Madau & Dickinson, 2014). It is, therefore, necessary to search for evidence of UFOs in high-redshift sources to test wind-driven AGN feedback models (e.g. Chartas et al. subm.).

UFOs manifest themselves through absorption lines at Erest > 7 keV, produced by highly-ionized iron. Given their energies, data with good-quality counting statistics are needed to properly constrain them. In this regard, gravitationally lensed quasars offer an unparalleled opportunity to observe these phenomena in otherwise too faint high-z sources. In fact, the magnification provided by the gravitational lens is a unique tool to obtain good quality data in a sustainable amount of observational time.


References:

King, A., & Pounds, K. 2015, ARA&A, 53, 115
Madau, P. & Dickinson, M. 2014, ARA&A, 52, 415

UFO duty cycle in Q2237

We detect UFO features in five (three) epochs at a significance higher than 90% (95%) confidence level out of the 11 Chandra exposures analyzed to this purpose. Similarly, we detect UFOs (>95% confidence level) in one of the two XMM observations.

We thus find the wind duty cycle, as the number of times we have detected UFOs over the 13 observations analyzed to this purpose, to be DCw ~ 46% (31%) at 90% (95%) confidence level.

This is, to our knowledge, the first evaluation of such a quantity in a high-z quasar.
Nonetheless, we cannot exclude the presence of UFO signatures that are too weak to be detected in HSS spectra showing the least number of counts. 
For this reason, our estimates of DCw have to be considered as the wind-duty-cycle lower limit over the 13 observations that provide data with high-enough statistics. We also note that, although strictly related to the S/N of the spectra, our estimation of this parameter represents the best that can be achieved with present-day data.

Paper & contacts

ADS link to paper

Email: elena.bertola2@unibo.it