As more and more large spectroscopic surveys become available, an automated approach in spectral classification becomes necessary. Due to the significance of massive stars, it is of paramount importance to identify the phenomenological parameters of these stars (e.g., the spectral type ) which can be used as proxies to their physical parameters (e.g mass, temperature).
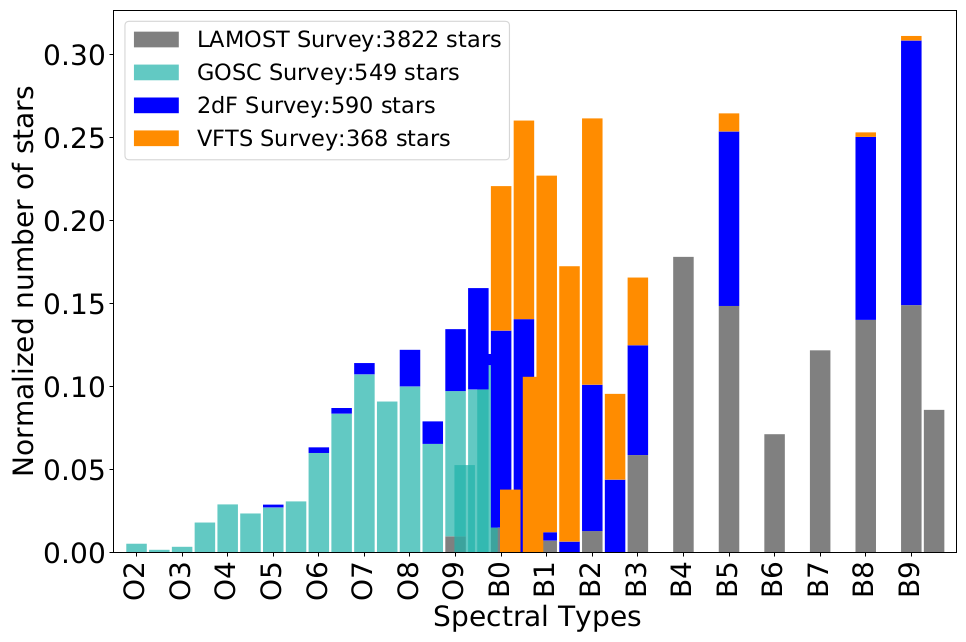
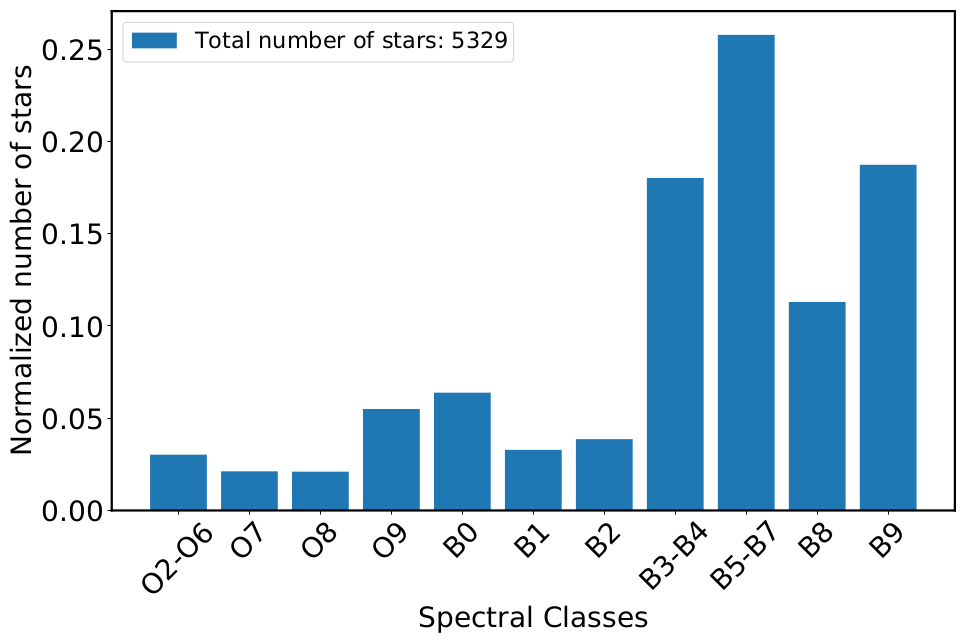
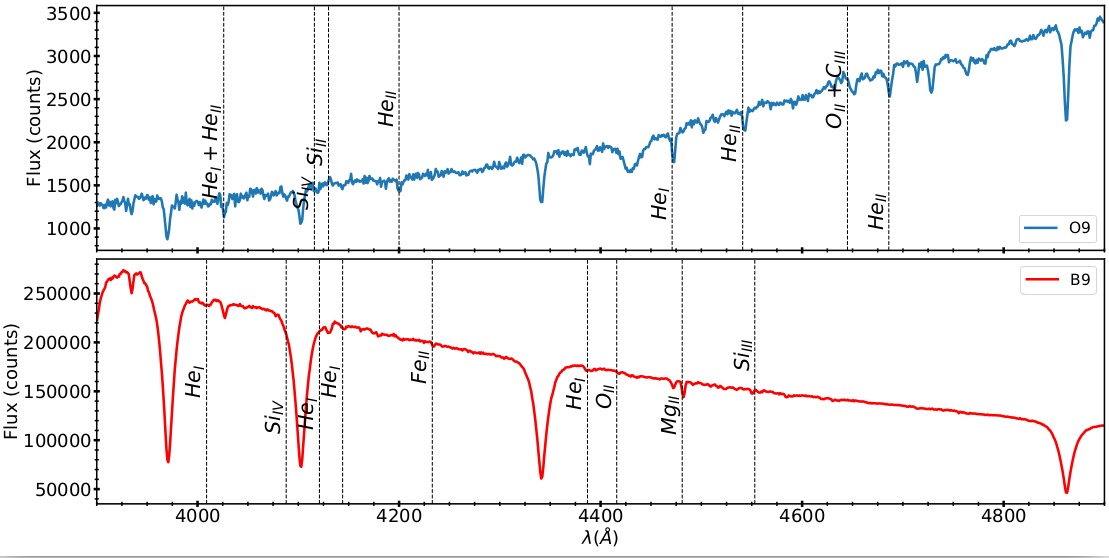
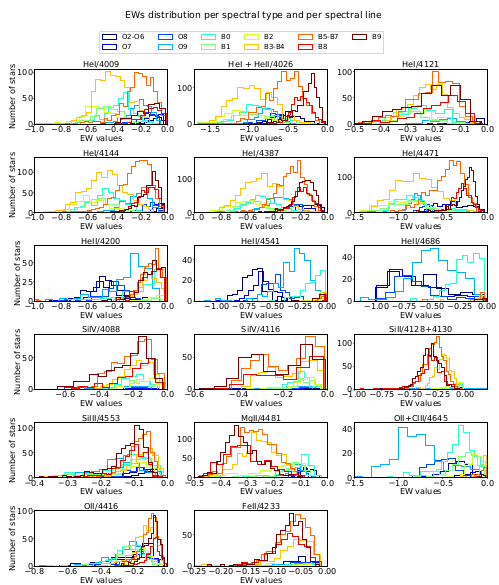
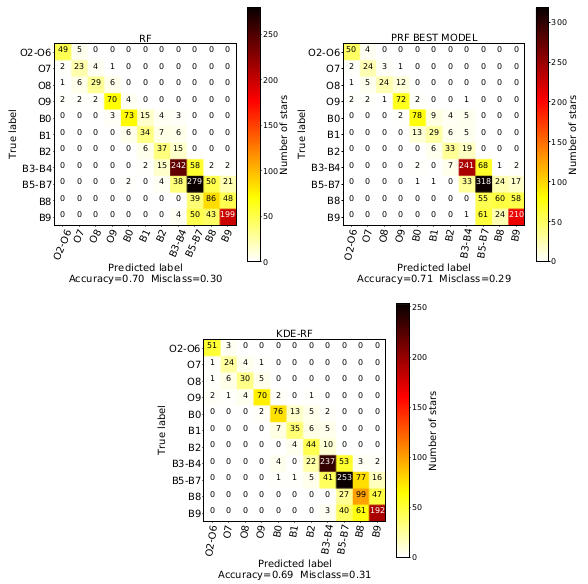
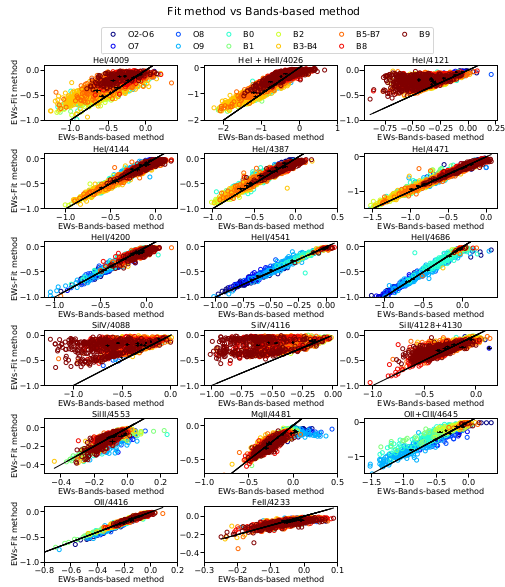
In this work, we use the Random Forest (RF) algorithm to develop a tool for automated spectral classification of the OB-type stars into their sub-types. We use the regular RF algorithm (Louppe, 2014 ), the Probabilistic RF (PRF) (Reis et al., 2019 ) which is an extension of RF that incorporates measurement uncertainties, and we introduce the KDE - RF method which is a combination of the Kernel-Density Estimation and the RF algorithm. We train the algorithms on the Equivalent Width (EW) of 17 characteristic absorption lines measured in the spectra from large Galactic and extragalactic surveys with available spectral-type classification. Furthermore, aiming to build a model not relying on prior Luminosity Class (LC) classification, we took into account all the available LCs (I-V), per spectral type, from each survey (the results presented in the abstract focus on Main Sequence stars but the overall performance is only a few percent worse). We find that the overall accuracy score is ~70 % with similar results across all approaches. The similarity in the performances of our models indicates the robustness and the reliability of the RF algorithm when used for spectral classification of early-type stars. This is strengthened also by the fact that our analysis employs two different methods for measuring EW: one based on spectral line fitting and the generally used bands-based method. Both methods reach very similar performance. Last but not least, the overall work has been developed based on real-world data and not on simulations.