A first look at the massive quenched galaxy population at 3<z<4 in the latest COSMOS catalogue

Katriona Gould 1 , Gabriel Brammer 1 , Francesco  Valentino 1 , John R. Weaver 1

  • 1 Cosmic Dawn Center, Niels Bohr Institute, Copenhagen University

Abstract

The identification of numerous massive red galaxies with suppressed star formation up to z~4 has recently cast doubt on our understanding of how quenching works. Whilst it was thought that these objects were the result of an instantaneous burst of star formation, there is growing evidence to suggest that there are multiple paths to quenching, only one of which leads to the curious population of bright post-starburst galaxies that contaminate searches for truly quiescent galaxies at z>3. The only way to truly understand the problem of quenching is to catch galaxies in the act of turning off their star formation and transitioning from active to quiescent, and to do so for a statistically significant sample of massive objects. The high-redshift universe is the ideal place for this, given that a galaxy will be transitioning for a larger fraction of the universe's age at this time, and therefore it is more likely to catch transitioning objects than in the local universe. Here we present the first results from a systematic search for transitioning and quenched galaxies at 3

6. Future work: how did they quench

We will infer star formation histories for all galaxies in our sample with the state of the art non-parametric SED fitting code Dense Basis (Iyer et al., 2017). 

Non-parametric star formation histories allow greater flexibility, introduce less biases and can recreate more realistic mass formation compared to parameterised star formation histories such as delayed tau models. 

We aim to deduce:

1. The quenching timescales for all galaxies in our sample

2. How many galaxies may have undergone a star burst prior to quenching. 

3. Whether any galaxies in our sample are truly quiescent based on their star formation history. 

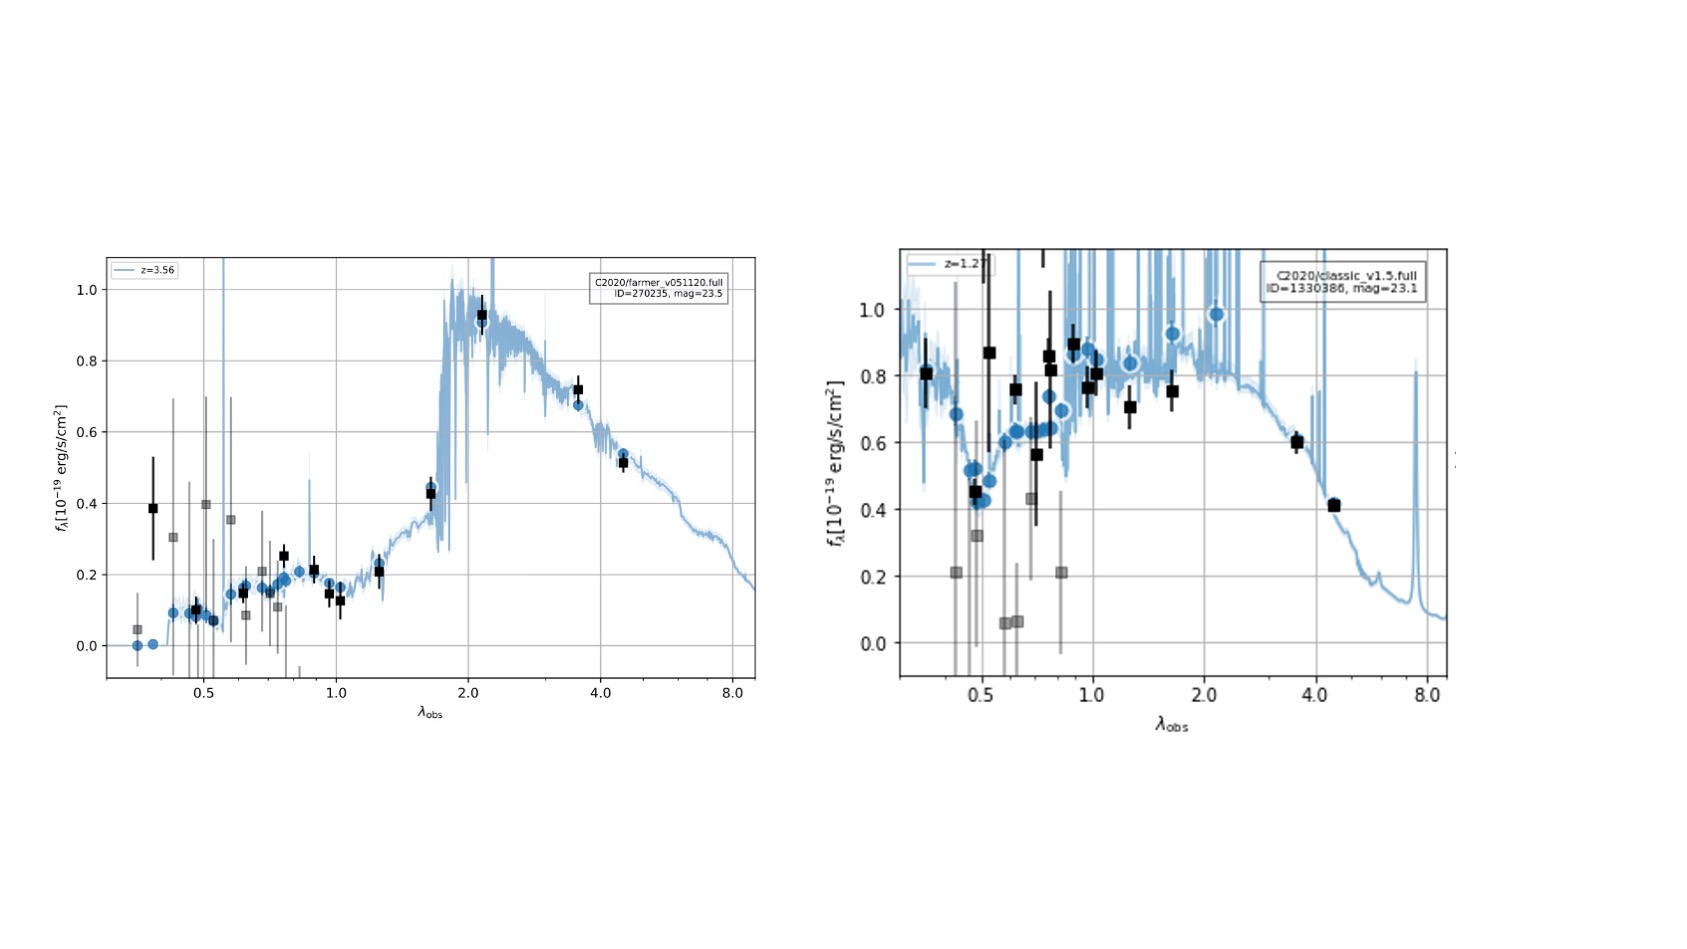
Below is one example of a massive quiescent galaxy from this work fit with Dense Basis, which has a quenching timescale on the order of ~500 million years. However, in general we find that this sample has a median quenching timescale much shorter than this, of ~ 250 million years. 

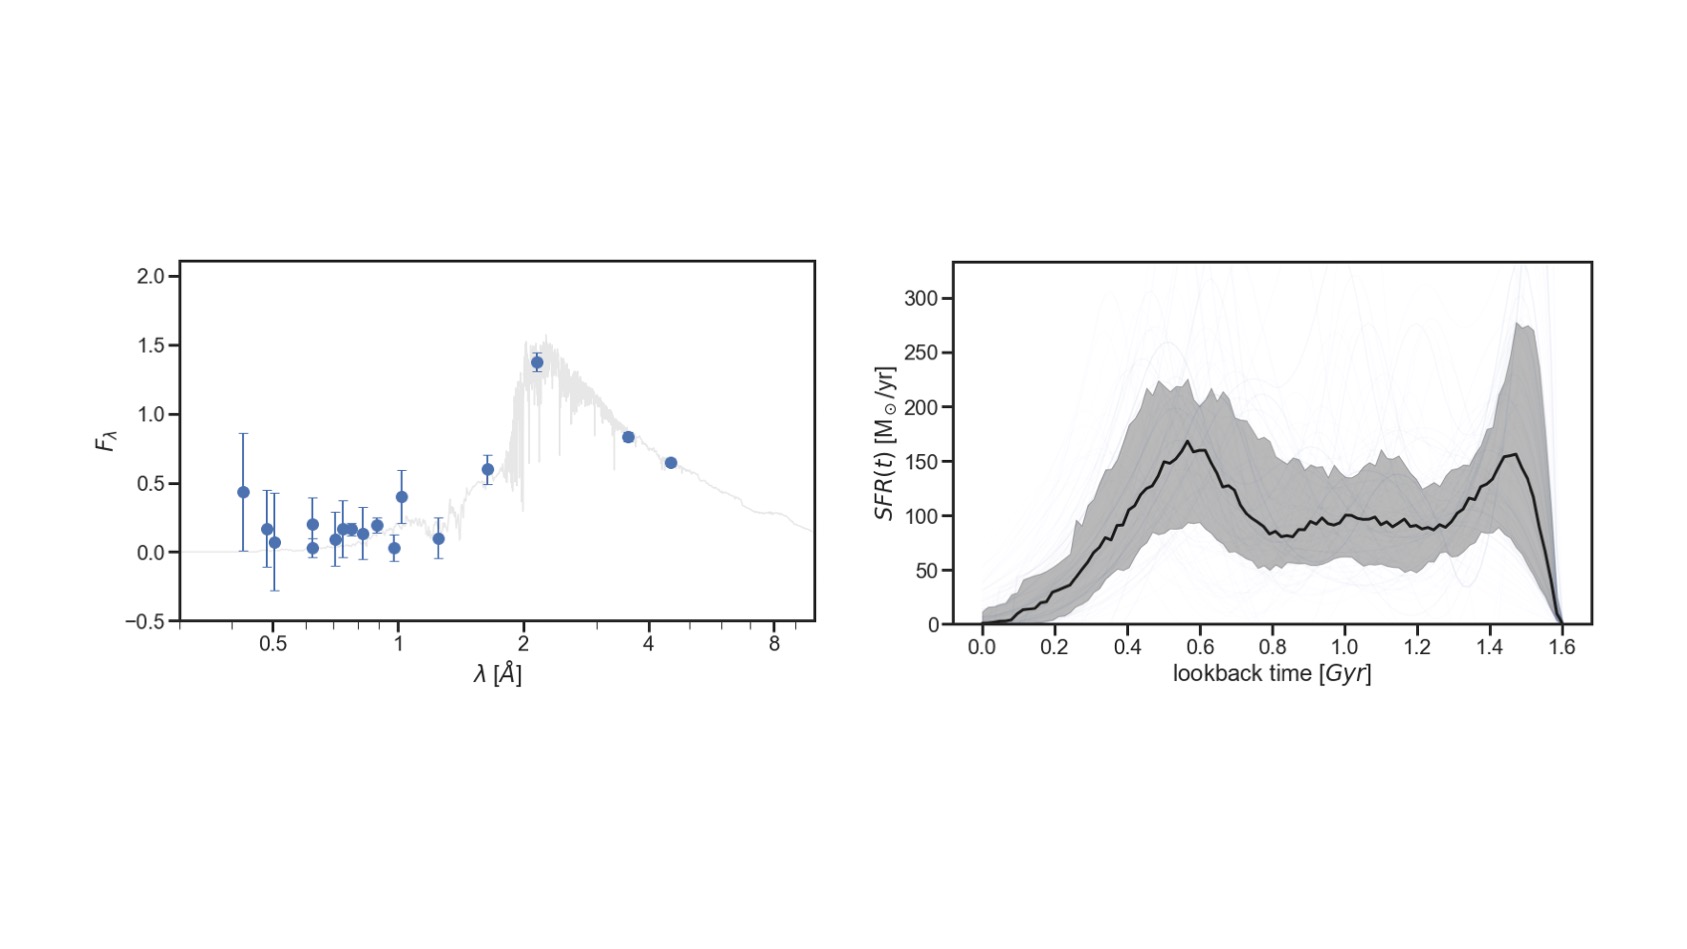
Left: SED (grey) fit to COSMOS2020 photometry (blue) with Dense Basis. Right: Inferred star formation history.

2. COSMOS2020: A new insight into the high redshift universe

COSMOS2020 provides photometry and galaxy properties (redshift, mass, star formation rates and more) for almost 1.7 million objects over 2 square degrees of UltraVISTA. 

This catalog has measured objects with two independent photometry methods: classical apertures and profile fitting photometry using the Tractor (Lang et al., 2016, Weaver et al., in prep).

Along with two redshift codes run on both photometry catalogs, this allows independent checks and increased robustness, which is especially useful for finding candidate high redshift galaxies.

Left: COSMOS2020 field combined izYJHKs image with areas covered by different surveys or instrument overlaid in color. Dashed areas represent the deepest areas observed. Right: Depth per band in magnitudes for each band (coloured), compared to the previous version of COSMOS (in grey).  

In addition to the classic aperture based photometry method, profile fitting photometry is performed by fitting objects with a suite of model galaxy types. 

While more computationally more expensive than apertures, profile fitting provides superior de-blending and accompanying statistics which is especially useful in characterizing ultra-faint, distant galaxies.

Two galaxies deblended using profile fitting photometry: The left, middle and right panels respectively show the two blended galaxies with 2" apertures in green, the profile fits, and the residual from the fit, in both optical (upper panel) and mid-infrared (lower panel) bands. 

1. Early deaths of giants

  • Massive (log(M*/Msun)>10.6) galaxies that ceased their star formation have been spectroscopically confirmed out to epochs as early as 1.5 billion years after the Big Bang (z~4) (e.g. Valentino et al., 2020)
  • Studies have found a diverse population of massive galaxies in this epoch: searches for the first "dead" galaxies have so far uncovered many that appear to have recently quenched their star formation (e.g. D'Eugenio et al., 2020, Forrest et al., 2020). 
  • There is no clear consensus on how many there are: there are disagreements in number densities between observations themselves and also with simulations, which cannot recreate the numbers of dead galaxies beyond z~3.7 


  • A systematic census of the quenched population at 3<z<4 in the deepest and widest optical+near-infrared extragalactic catalogue ever (COSMOS2020) (Weaver,...,Gould et al, submitted) will help us to understand:  

3. Candidate massive quiescent galaxies

We choose to select our sample from the model based photometry catalog and fit redshifts, stellar masses and rest frame UVJ colours with Eazy (Brammer et al., 2008). This is to maximise the chance of detecting these rare galaxies in the case of blending. 

We select a parent sample of 3<z<4 massive log(M*/Msun)>10.6 galaxies with a number of sanity cuts to ensure removal of disasterous photometry (i.e. models moving from initial source position) or unphysical masses/fluxes or stars. 


Parent massive galaxy sample (grey) and quiescent sample (red) masses and redshifts. Typical error bars for the quiescent sample are shown in black. All log(M*/Msun)>10.6 galaxies in COSMOS2020 in the same redshift range are also shown in blue. 

Quiescent galaxies are selected on the basis of the rest frame UVJ colours  (Whitaker et al., 2013) with the bottom edge of the selection box extended to include recently quenched galaxies, which is motivated by the recent literature which finds the majority of quenched galaxies at z>3 to have bluer U-V colours (e.g. D'Eugenio et al., 2020). Although this will not guarantee the selection of every massive quiescent galaxy, this method ensures that the sample is highly pure. 

Rest frame UVJ colours for the parent (light grey) and quiescent (dark grey) sample, with the extended Whitaker+2013 quiescent box shown in black. Also shown are massive quiescent galaxies in COSMOS from recent works (Schreiber et al., 2018, Forrest et al., 2020, Valentino et al., 2020 and D'Eugenio et al., 2020). Those which have no spectroscopic redshift available are marked with a red cross. 

4. Profile fitting based photometry reveals hidden galaxies

Profile fitting based photometry turns out to be more robust than apertures, correctly identifying galaxies that are measured incorrectly with apertures. 

We compare our sample masses and redshifts from Eazy + profile fitting photometry to Eazy + aperture photometry: 

In general we find excellent agreement between the two photometry methods, however, ~13% of galaxies are fit at both lower redshift and mass with the aperture catalog. 

This is due to a systematic offset in one of the optical narrow bands measured with apertures, and so we reject the aperture photometry catalog redshifts and masses and keep these galaxies in our sample. 

We furthermore find that the chi-squared fit with eazy for the profile fitting based photometry is lower than eazy + apertures, confirming this. 

Redshift comparision for the parent massive galaxy sample selected with model based photometry and classical aperture based photometry. 

Stellar masses for the massive quiescent galaxy sample selected with model based photometry compared to the same objects in the aperture photometry catalog, coloured by their redshift ratio. Galaxies which are at lower masses in the aperture catalog are also at lower redshift. 

Left: Eazy SED fit to model based photometry of a candidate massive quiescent galaxy at z~3.6 Right: Same object but with Eazy fit to photometry measured with apertures, which puts the galaxy incorrectly at z~1.3. 

5. Number densities

Assuming conservatively that 20% of our sample are interlopers or not truly quiescent, we obtain a number density of 1.38x10-05 +- 2.25x10-06 MPc3, not taking into account cosmic variance. 

We show this below in comparision to other massive quiescent galaxy samples. Our numbers are in agreement with the value derived from the spectroscopic sample from Schreiber et al., 2018

Number densities of massive quiescent galaxies in our sample compared to other values from the literature (figure adpated from Valentino et al., 2020).