Resolving the AGN Torus Using Broadband X-ray and Radio Observations

Mislav Balokovic 1

  • 1 Yale University

Abstract

As a result of NuSTAR and Swift observations of over a hundred obscured AGN in the local universe, recent studies placed interesting constraints on some basic parameters of the obscuring torus directly from the X-ray band. In particular, the covering factor was found to peak around the typical Seyfert X-ray luminosity and decrease toward both lower and higher luminosities. However, detailed analyses of particular AGN reveal that structural parameters of the torus may depend on the choice of the fitting model, variability in intrinsic luminosity or line-of-sight column density, and contamination from non-nuclear emission. I will show that in modeling spatially unresolved single-epoch AGN spectra in the X-ray band, these effects can be sources of systematic uncertainties that exceed statistical uncertainties on the key structural parameters of the obscuring torus. Using a detailed study of the low-luminosity AGN NGC 1052 as an example, I will demonstrate how broadband X-ray modeling of reprocessed emission from the torus can be supplemented by very long baseline interferometry observations at multiple frequencies for further constraints on the obscuring torus structure. Combining the two techniques informs the development of X-ray spectral models for AGN and may provide vital clues for interpretation of high-resolution observations (spectral or spatial) at these and other wavelengths in the near future.

The Obscuring Torus in Low-Luminosity AGN, Such as NGC 1052

   Broader Context of Torus Covering Factor Studies

  • In the orientation-based Unified Model paradigm, the ratio of obscured to unobscured AGN depends on the average covering factor of the obscuring torus (Ctor).
  • Observationally, a number of studies have found that the covering factor of the torus is a function of luminosity or the Eddington fraction. It appears to be highest in the typical Seyfert regime and lower toward both higher and lower luminosities (e.g., Ricci et al. 2017, Gonzalez-Martin et al. 2017).
  • On the theoretical side, this may be explained by 1) stronger radiative feedback clearing the environment at high luminosities, and 2) lack of radiative support for a geometrically thick torus at the low-luminosity end (e.g., Elitzur & Shlosman 2006, Honig & Beckert 2007).
  • Constraining the torus covering factor based on X-ray spectroscopy is novel and typically requires high-quality broadband X-ray data. Current results on the dependence of the covering factor on luminosity are impacted by small number statistics and limited data quality for low-luminosity AGN (see figure below from Balokovic 2017; also Marchesi et al. 2019).

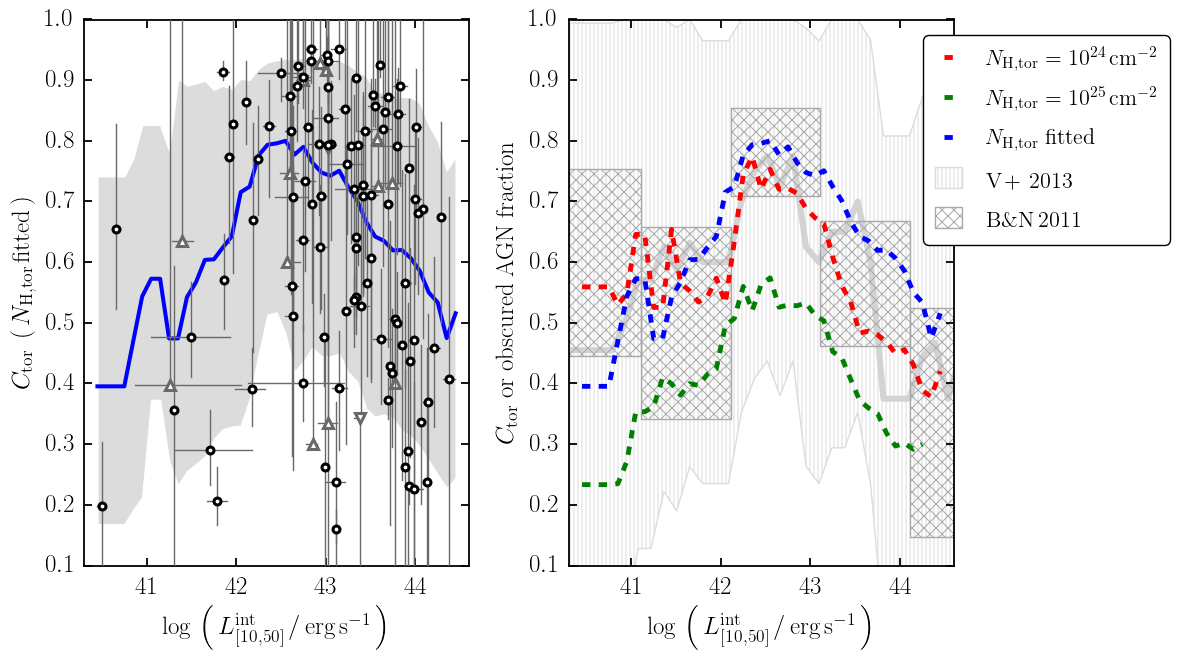
Left: Torus covering factor based on X-ray spectroscopy for a large sample of nearby obscured AGN selected using Swift/BAT and observed with NuSTAR, from Balokovic (2017). Black circles mark best fits and grey triangles mark limits for individual AGN. The blue line and the grey shaded area represent the running median and its 68% confidence interval. Right: Colored lines represent different choices for the assumed torus average column density, all three revealing the same non-monotonic dependence of the torus covering factor on the intrinsic X-ray luminosity. Grey lines, shaded area and hatched boxes show the obscured AGN fraction (proxy of the covering factor) from Vasudevan et al. (2013) and Brightman & Nandra (2011).

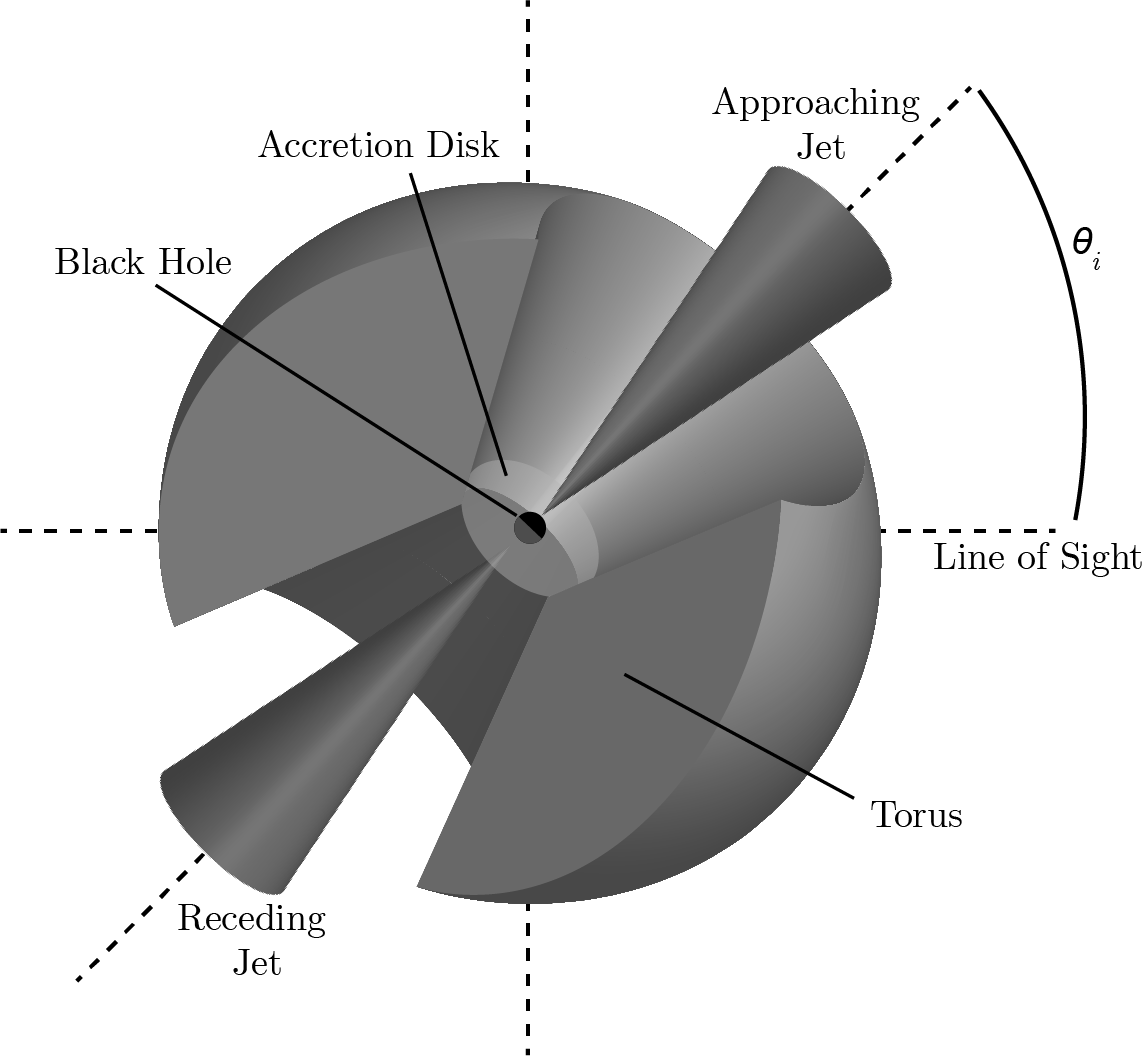
   Additional Leverage on the Torus Covering Factor in NGC 1052

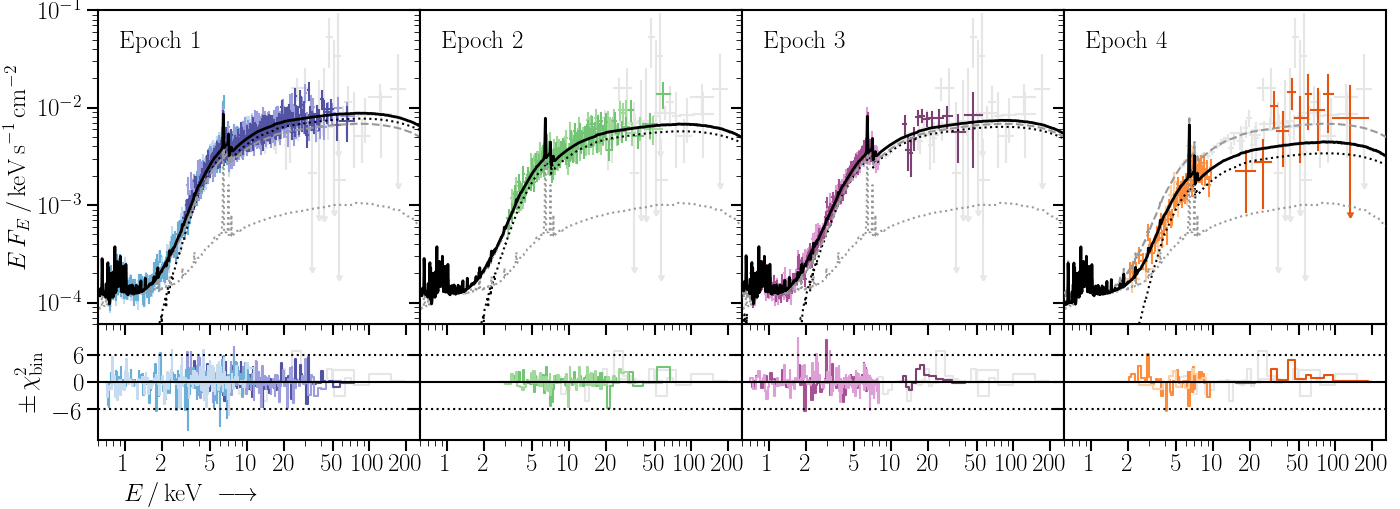
  • To improve the existing constraints on the low-luminosity end, we conducted a multi-epoch broadband X-ray spectroscopy of the nearby AGN NGC 1052.
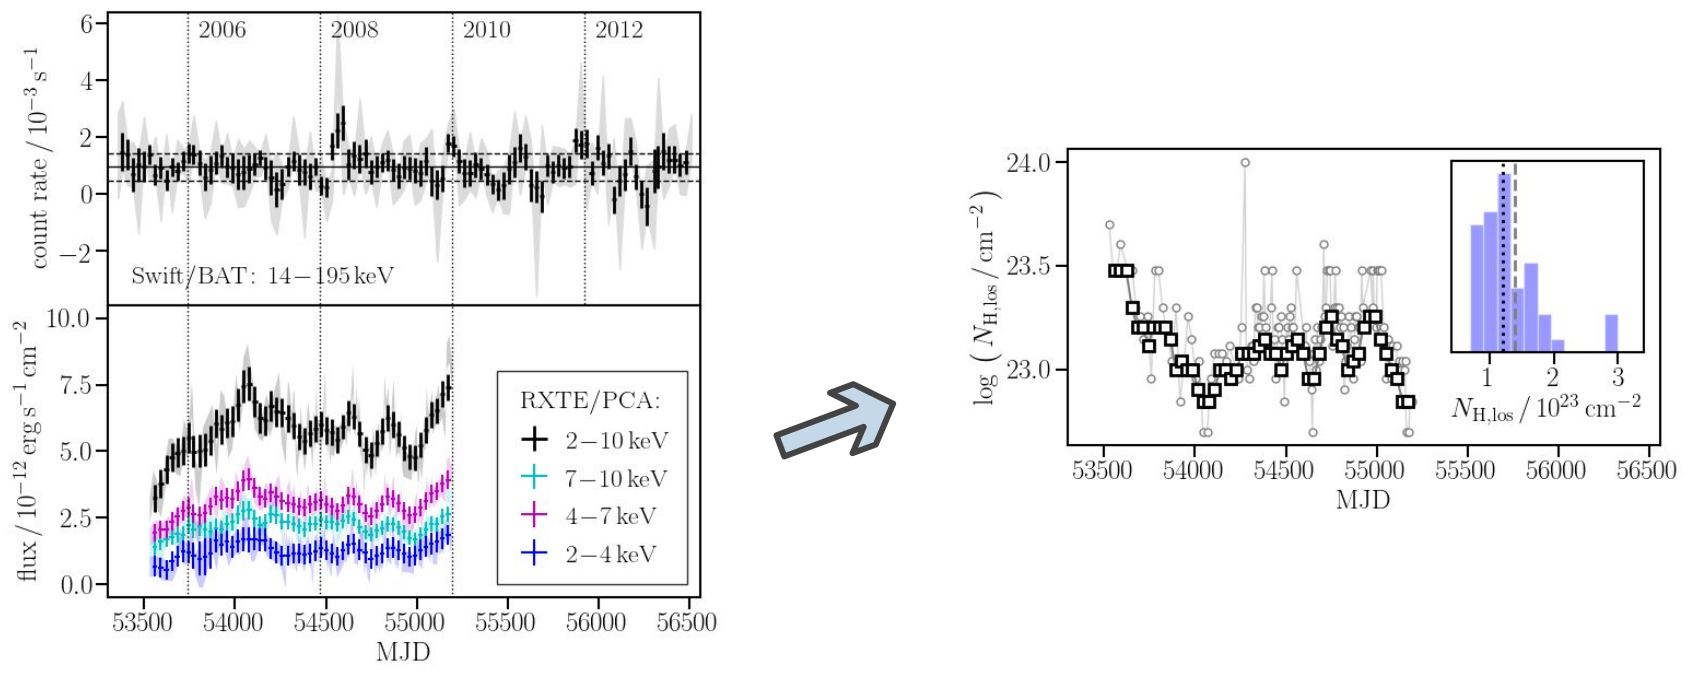
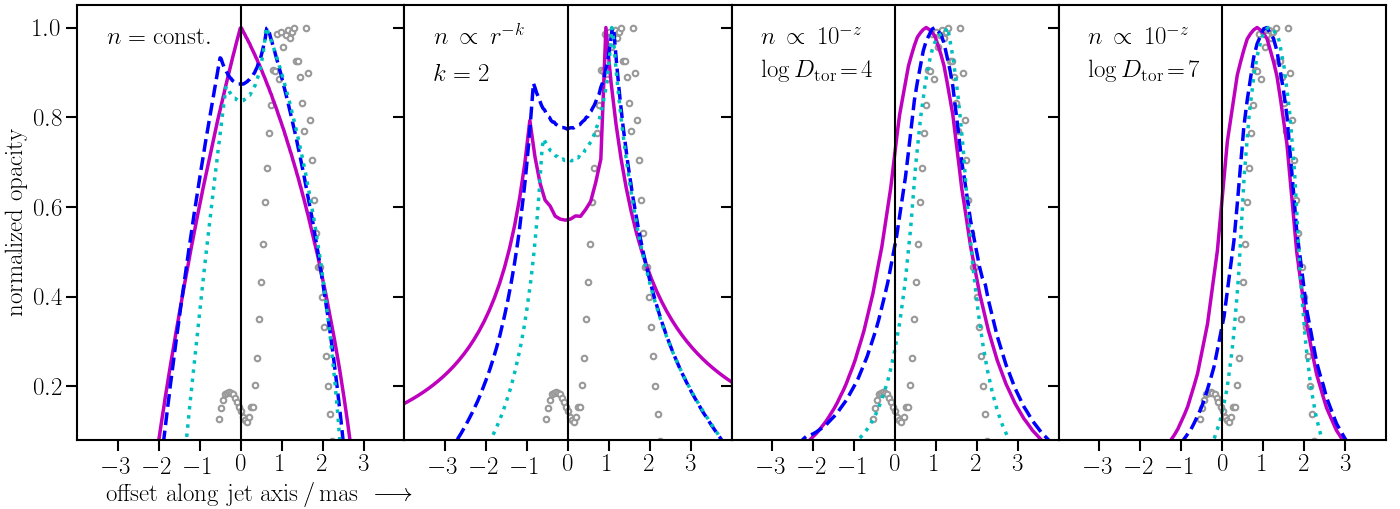
  • We can enhance the spectroscopic results with the variability of the line-of-sight obscuring column and with the milliarcsecond (mas) scale radio opacity measurements from very long baseline interferometry (VLBI).
  • Panels on the right follow analysis steps from the paper available on arXiv: 2105.01682 (accepted for publication in ApJ).

Self-consistent Multi-epoch Broadband X-ray Spectroscopy

  • Torus constraints primarily depend on the Fe Kalpha line (6.4 keV) and the Compton hump (~30 keV), so we employed 4 epochs of NGC 1052 observations in which these features were covered simultaneously (see figure caption below for details).
  • All epochs have the same torus reprocessing component represented by the borus02 model (Balokovic et al. 2018) assumed to be constant over time, and a variable line-of-sight component.
  • Results: torus covering factor 80-100% and average column density of the torus 1-2 x 1023 cm-2, consistent across several different assumptions.

Each panel shows one epoch of broadband X-ray observations of NGC 1052, from left to right: 1) XMM-Newton & NuSTAR in 2017, 2) NuSTAR in 2013, 3) Suzaku in 2007, and 4) BeppoSAX in 2000. Spectra plotted in grey in all upper panels show long-term averaged spectra from Swift/BAT, INTEGRAL, and RXTE. Thick black lines show the best-fit model for each epoch. Grey dashed lines show the average, while grey dotted lines show the non-variable components dominated by the reprocessing in the torus at >2 keV. Lower panels show the residuals for each epoch.

Variability of the Line-of-Sight Obscuring Column Density

  • RXTE/PCA provided 4.5 years of monitoring in sub-bands of the 2-10 keV band sensitive to the line-of-sight column density variations. Using the best-fit model, we converted the fluxes into line-of-sight column density series (see the figure below).
  • The narrow distribution of the line-of-sight column density (NH,los) and its median closely match the spectroscopically derived average column density of the torus (NH,tor), suggesting a very uniform torus lacking Compton-thick lines of sight.

Left: Long-term light curves for NGC 1052 from Swift/BAT (top panel) and RXTE/PCA (bottom panel). Note that while the former is relatively constant, variations in the 2-10 keV band and its sub-bands (shown in color) is significant over the 4.5-year period of intensive monitoring. Right: The conversion of RXTE/PCA light curves to line-of-sight column density (NH,los) variations, and its histogram shown in the inset with vertical lines showing the median. In all panels, underlying lighter colors show original data points, while darker colors show three-month averages. 

Radio Opacity at Sub-pc Scale

  • Using multi-frequency VLBI observations, Sawada-Satoh et al. (2008) spatially resolved the torus by measuring free-free absorption against the jet emission on sub-pc scale. At the distance of NGC 1052, 1 mas corresponds to 0.1 pc.
  • As the equivalent of our X-ray model failed to reproduce the radio opacity profile, we tested several other assumptions for torus density (see the figure below), finding that a model with a steep gradient in the direction along the jet axis can match both radio and X-ray data.
  • Parameterizing the gradient with the vertical density contrast ratio over one torus radius (Dtot), we constructed a new X-ray spectral model for torus reprocessing. Its current parameter space appears too limited  (log Dtot<5, while radio data suggest log Dtot~7) for a joint fit to both datasets, which we leave for future work.

Normalized opacity as a function of projected distance along the jet axis for several simple torus models (colored curves) compared to measurements based on VLBI observations of NGC 1052 jets (Sawada-Satoh et al. 2008; grey circles). Density distribution assumed for the models is given in the upper left corner of each panel, with r and z referring to the radial coordinate and the vertical coordinate perpendicular to the equatorial plane, respectively. In each panel we show model curves for the following cases: model most similar to that fitted to the X-ray data (solid magenta line), model with a zero-density central cavity with a radius of 25% of the torus size (blue dashed line), and the same model with inclination angle of 70 instead of 80 degrees adopted for the X-ray analysis (cyan dotted line). In all cases, torus radius is adjusted to match the data around 50 % opacity at the outer edge around the offset of +2 mas.

Link to Full Paper & Contact

The analysis shown in this poster is described in more detail in a paper available on arXiv (2105.01682) and in the process of publication in ApJ. Its title and abstract are given below. If you have any questions about this work, please feel free to contact me using the OnAir platform or over e-mail at mislav.balokovic@yale.edu.