Broad-Band X-ray study of the Hyper-Eddington AGN IRAS 04416+1215

Alessia Tortosa 1

  • 1 Universidad Diego Portales, Santiago

Abstract

I will present the analysis of simultaneous XMM-Newton and NuSTAR observations of a Hyper-Eddington AGN, namely IRAS 04416+1215. Optically-thick geometrically-thin accretion disks explain several key features of the observed Spectral Energy Distributions of many AGN with moderate Eddington ratios. At higher accretion rates, the disk becomes thin or slim and the nature of the accretion flow changes dramatically, with processes like photon trapping and advection becoming important. The main goal of this study is to investigate the properties of the X-ray corona as well as the structure of the accretion flow and of the circumnuclear environment in this regime of extreme accretion.
IRAS 04416+1215 is part of the best sample available for genuinely of super-Eddington sources, i.e. Super-Eddington Accreting Massive Black Holes (SEAMBHs), which contains exclusively objects with black hole masses estimated from reverberation mapping. It has the highest Eddington ratio (λEdd = 427) in the sample and one of the highest Eddington-ratio in the local Universe. IRAS 04416+1215 shows the typical spectral shape of the NLS1 galaxies, a steep spectral slope and strong features of reprocessed radiation, as well as a soft excess below 1 keV and a dip around 7 keV. It also shows the presence of three absorbing structures whose estimate of the minimum and maximum distances suggests two different and interesting interpretations.

Timing Analysis

Temporal properties

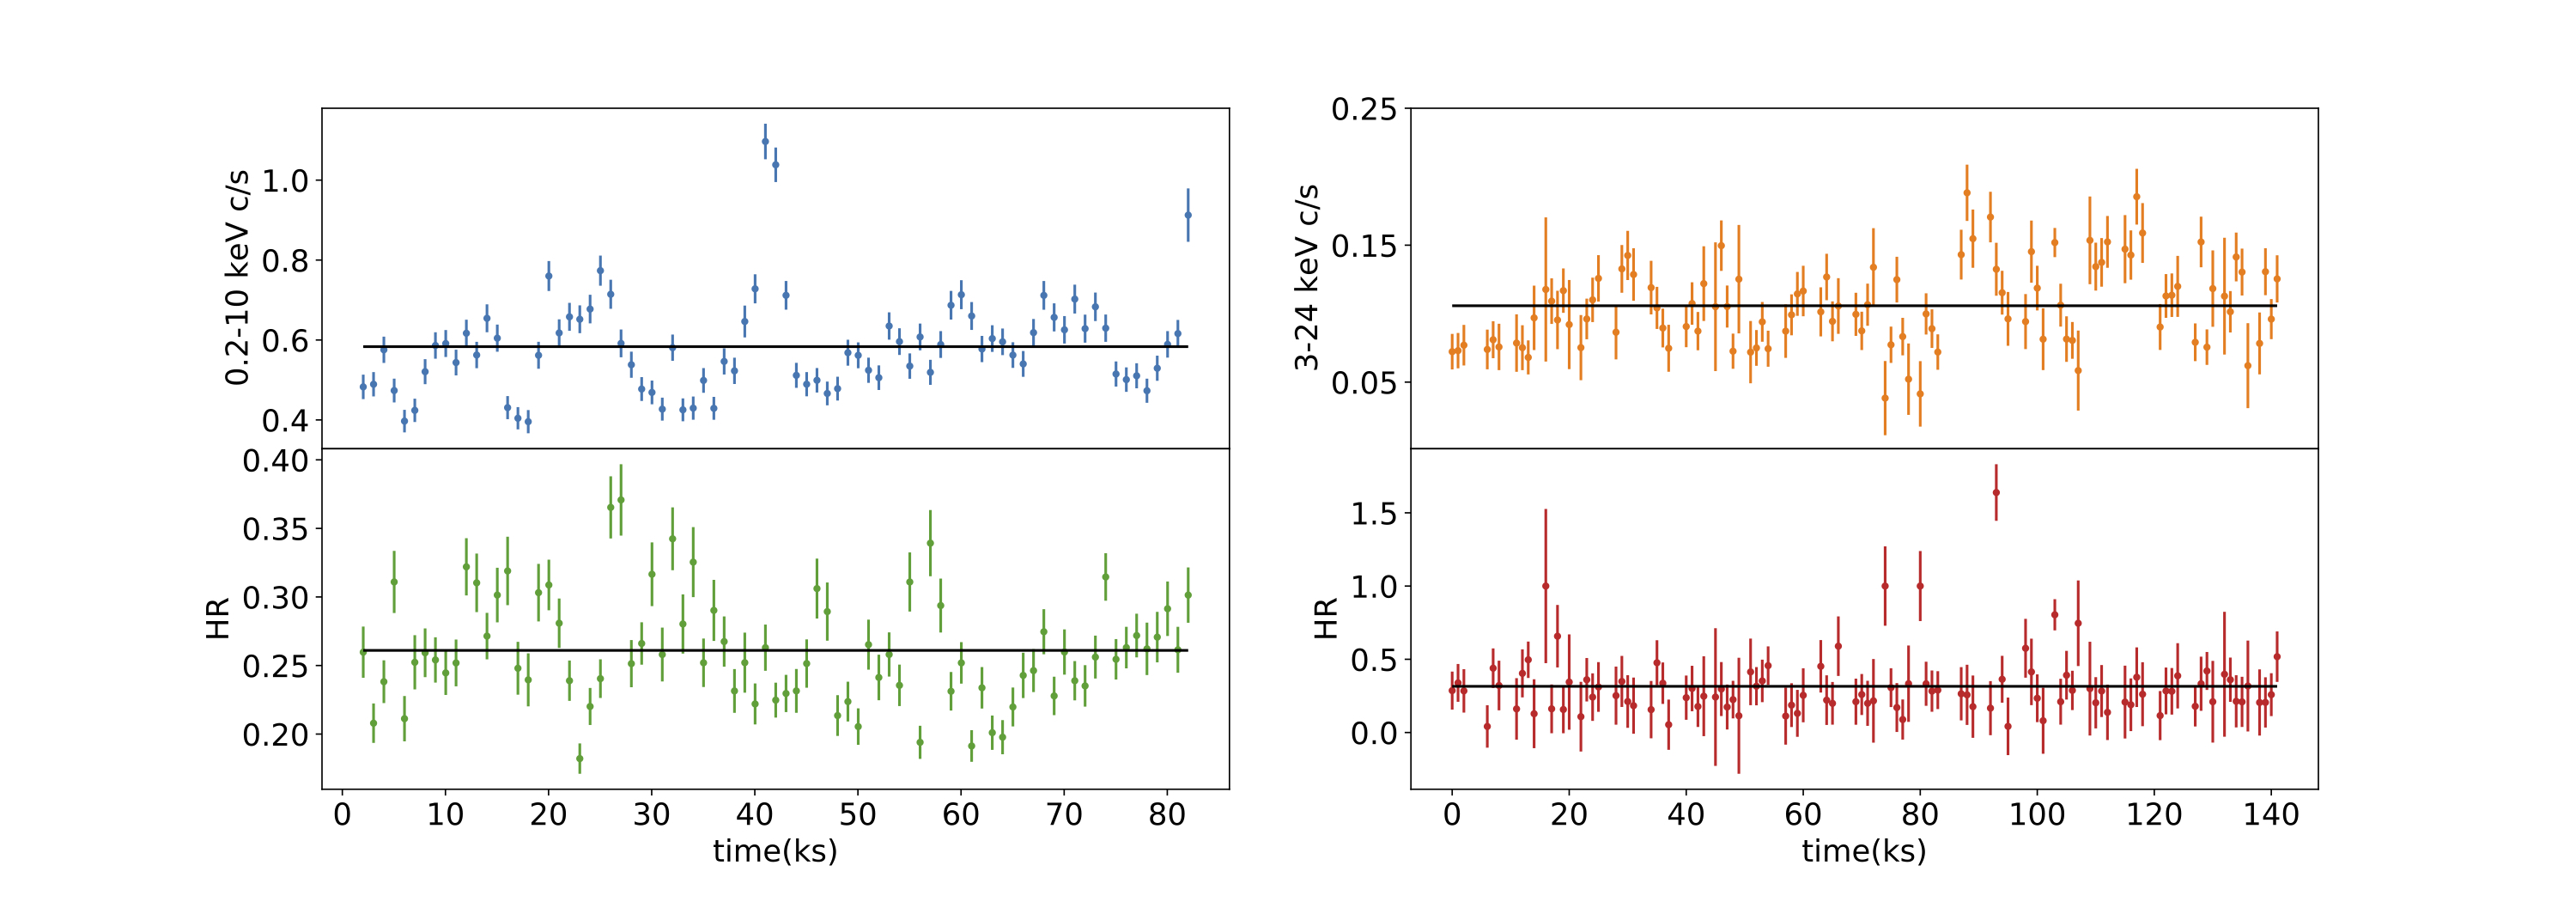
Figure 1: Top left panel: IRAS 04416+1215 XMM-Newton EPIC-pn background subtracted light curves (blue) in the: 0.2–10 keV energy band (blue). Bottom left panel: ratio between the XMM-Newton EPIC-pn background subtracted light curves in the 2.5–10 keV and 0.2–2.5 keV energy bands (green). Top right panel: NuSTAR FPMA+B background subtracted light curve in the 3–24 keV energy band (orange). Bottom right panel: ratio between the NuSTAR background subtracted light curves in the 10–24 keV and 3–10 keV energy bands (red). All the light curves are extracted using a binning time of 1000 s.

The XMM-Newton EPIC-pn light curves showed the presence of rapid variability with a rapid increase followed by a decrease of the count rate by a factor two in less than two hours during the observation. This feature is present in the light curves extrapolated in different energy bands, but it does not affect the ratio between the flux in the 2.5-10 keV and the 0.2-2.5 keV band (see left panels of Fig. 1). The NuSTAR light-curves show no evidence of strong flux and spectral variability (see right panels of Fig. 1). To check whether flux variability affects the spectral analysis we extracted, together with the total time-averaged EPIC-pn spectrum, two spectra applying two different cuts in count-rate (c/s ≥ 0.6, and c/s < 0.6) and we looked for any spectral differences in these spectra by fitting all of them in the 0.3–10 keV energy band using our best-fitting model. For both the spectra with the two different cuts in count-rate the values of the parameters are consistent within the errors with the values obtained by fitting the total time averaged EPIC-pn spectrum. 

Variability Spectrum

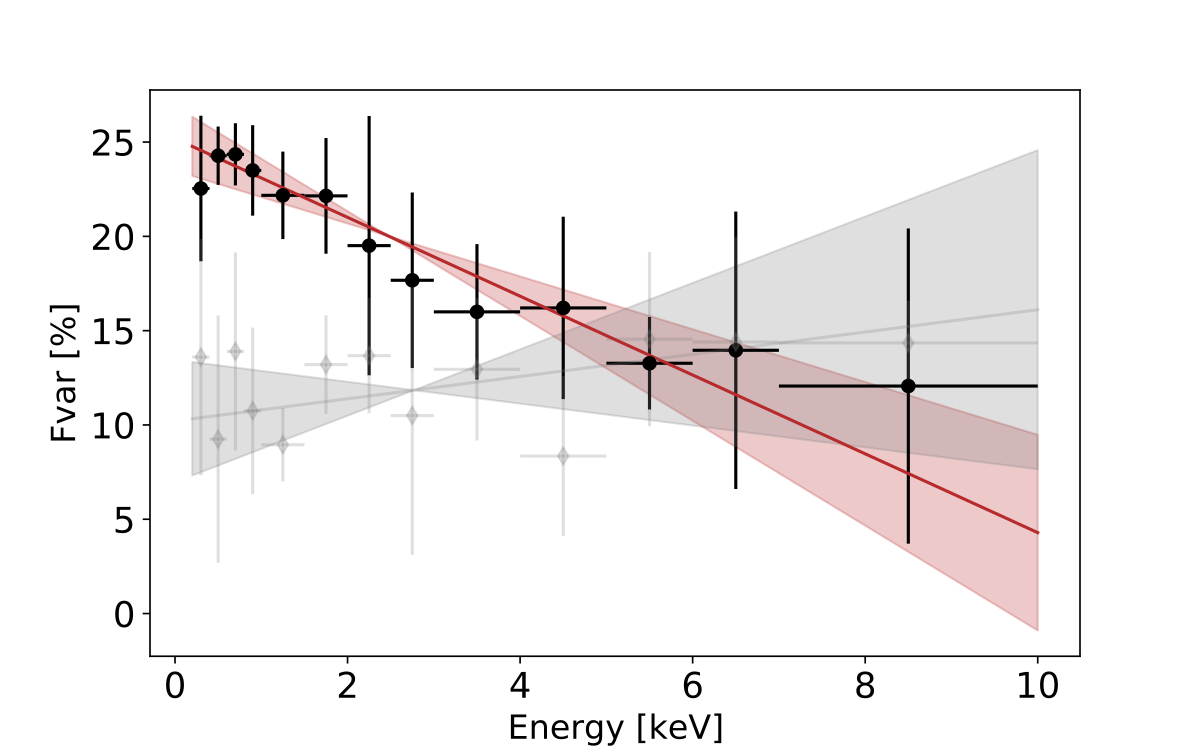
Figure 2: Fractional variability spectra for the EPIC-pn observation of IRAS 04416+1215 (black) and median of the fractional variability spectra of the XMM-Newton observations of the BASS sample of Seyfert 1 with log(MBH/M⊙) ∈ [6.5 − 7.0] (gray). The red (and gray) solid lines and the shaded regions represent the linear fit and the 3-σ error on the fitting relation, respectively.

We looked at the variability spectrum of IRAS 04416+1215 using the fractional root mean square variability amplitude (Fvar, Vaughan et al., 2003) for the XMM-Newton observation. We computed Fvar using the background-subtracted EPIC-pn light curves with a temporal bin of 1000 seconds and with an increasing energy binning. We fitted the variability spectrum with a simple linear relation: y = ax + b obtaining the following slope and intercept values: a = −2.09 ± 0.23 & b = 25.19 ± 0.37.

The X-ray variability spectrum of IRAS 04416+1216 shows a different trend respect to the median of the Seyfert 1 sample from the BAT AGN Spectroscopic Survey (BASS, grey in the plot) with almost the same black hole mass as IRAS 04416+1215, with a higher variability in the soft band, suggesting that the most variable components are the ones found at low energy, such as the soft excess and/or ionized absorption (see Fig. 2).

Spectral Analysis

Figure 3: Data, best-fit model (top panel) and residuals ratio (bottom panel) for XMM-Newton EPIC-pn (black) and NuSTAR FPMA (blue) and FPMB (magenta) spectra of the of the hyper-Eddington source IRAS 04416+1215 considering the best- fitting model including the xillver reflection.

Table 1: Fitting parameters for the X-ray broad-band XMM-Newton plus NuSTAR spectra of IRAS 04416+1215 (z=0.0889) using the best-fitting model (xspec model: zTbabs * mtable(xout-mtable-v100.fits) * mtable(xout- mtable-v1000.fits) * mtable(xout-mtable-v1000.fits) * zTbabs * (power- law+zgauss+bbody)). Errors are at 90\% confidence levels.

We carried out a detailed spectral analysis of the broad-band data obtained from the simultaneous observation of the source by XMM-Newton and NuSTAR using a large variety of spectral models. The best-fitting model is composed of a soft-excess, three ionized outflows, neutral absorption and a reflection component, which was modelled with xillver in xspec. We found that the reprocessed radiation is dominating (Rrefl > 8.01) over the primary continuum, which shows a slope of Γ = 1.77, as in the case of other sources with high accretion rate. Indeed, when the accretion rate is close or above the Eddington limit, the accretion disc can be radiation-pressure dominated and not perfectly flat, but clumpy or it can have the shape of deep rings or sheets. In this case the reflection component can be be stronger and the reflection fraction can be >1.

We searched for possible degeneracies between the fitting parameters, performing Monte Carlo Markov Chain (MCMC) using the xspec-emcee code by Jeremy Sanders. This is an implementation of the emcee code (Foreman-Mackey et al. 2013), to analyze X-ray spectra in xspec. We used 50 walkers with 10,000 iterations each, burning the first 1,000. The walkers started at the best fit values found in xspec, following a Gaussian distribution in each parameter, with the standard deviation set to the delta value of that parameter. Thanks to the NuSTAR unprecedented hard-band sensitivity, we obtained a very good constraint of the high energy cutoff, which is ~ 45 keV

Figure 4: 68%, 90% and 99% contour plots resulting from the MCMC analysis of the xillver model applied to the broad-band XMM-Newton and NuSTAR 0.35–24 keV spectra of IRAS 04416+1215. We show the outputs for photon index (Γ), iron abundance (AFe), cut-off energy (Ecut[keV]), ionization parameter (log(ξ/erg cm s−1)) and reflection fraction (Rrefl).

X-ray Winds

Table 2: Column density, ionization fraction, observed redshift, Doppler shift, velocity (where c is the speed of light) and radial location for each absorber. We also reported the reduced chi square and the F-statistic null hypothesis probability when adding each absorbing component to the fitting model described above.

Table 3: Upper and lower limits on the mass outflow rate , on the momentum rate of the outflow and on the kinetic power of the outflow for the absorbers compared with the mass accretion rate the momentum of the radiation and the observed outflowing bolometric luminosity, respectively.

From the analysis of the location (see Tab.2) and the energetic (see Tab. 3) of the X-ray winds, two main scenarios arise:

  • The three winds are co-spatial absorbers, the disc emitted luminosity does not have enough power to accelerate the winds because, due to the extremely high accretion rate, much of the luminosity is advected inside the disc and the winds receive a relatively low acceleration from radiation pressure alone, suggesting that the outflows observed in IRAS 04416+1215 could be accelerated by magnetohydrodynamic processes;
  • Multi-phase and multi-scale X-ray winds consistent with being a warm absorber (WA), an ultrafast outflow (UFO) and an entrained-ultrafast outflow (E-UFO) producing an important feedback on the environment surrounding the AGN

X-ray Corona

Figure 5: kTe vs Γ contour plot (left panel), Rrefl vs Γ contour plot (midle panel) and Rrefl vs kTe (right panel) resulting from the MCMC analysis of the xillverCp model applied to the broad-band XMM-Newton and NuSTAR 0.35–24 keV spectra of IRAS 04416+1215. The black star represents the best fit value of the parameters.

The coronal plasma electron temperature is expected to be related to the cut-off energy by Ecut = 2 − 3 kTe (Petrucci et al. 2000, 2001). Following this relation applied to the value of the cutoff energy from the best fitting model (i,e, 45 keV) we derived the coronal temperature, which is kTe ∼ 15 − 22 keV. Moreover, to directly measure the coronal temperature parameter, assuming that the primary emission is due to the Comptonization of thermal disc photons in a hot corona, we used the xillverCp versions of the tables in which the reflection spectrum is calculated by using a more physically motivated primary continuum, implemented with the analytical Comptonization model nthcomp (Zdziarski et al. 1996; Życki et al. 1999), instead of a simple cutoff power law. In this model the seed photon temperature is fixed at 50 eV. We found a photon index Γ = 1.88±0.04 and a coronal temperature kTe= 2.95 ± 0.25 keV.

Compactness-Temperature Diagram

Figure 6: Theoretical compactness-temperature diagram. The black solid line represents the line below which the electron-electron coupling time scale is shorter than the Compton cooling time scale, the black dot-dashed line represents the line below which the electron-proton coupling time scale is shorter than the Compton cooling time scale while the black dotted line represents the line below which the dominant process is the Bremsstrahlung. The blue and green solid curves are the pair run-away lines respectively for a disc-like (Svensson 1984) or a spherical corona (Stern et al. 1995). The dotted gray curves are the compactness-temperature distribution for different values of the fraction of thermal and non-thermal electrons (see Fabian et al. 2017). The two magenta stars indicate the position of IRAS 04416+1215 considering the temperature parameter extrapolated using both the coronal temperature value from the fit with xillverCp table (left star) and from the relation with the cut-off energy (right star). The cyan and the orange stars indicate the position of Ark 564 (Kara et al. 2017) and GRS1734-292 (Tortosa et al. 2016). The purple stars indicate the position of two luminous high-redshift quasars (2MASSJ1614346+470420 and B1422+231, Lanzuisi et al. 2019). The red points represent the median values of the of compactness-temperature diagram for the BASS hard X-ray selected sample from Ricci et al. (2018).

IRAS 04416+1215 has a very well constrained value of the coronal temperature, one of the lowest coronal temperature measured so far by NuSTAR. Depending on the modelling we found a coronal temperature between ∼ 3 keV and ∼ 22 keV. The location of IRAS 04416+1215 in the compactness-temperature diagram (see Fig. 6) suggests that, unlike most of the AGN, its X-ray emission is not created in a pair-dominated thermal plasma. However, considering a scenario in which the corona is made of an hybrid plasma, composed of both thermal and non-thermal electrons, the non-thermal electrons that exceed the temperature of ∼ 1MeV can emit photons which give rise to a pair run-away situation. In this case, the primary continuum emission would seem to originate in a thermal coronal plasma with low-temperature which is not pair-dominated. A possible explanation for this very low value of the coronal temperature of IRAS 04416+1215 can be found considering that, in Super- Eddington accretions flows, the comptonizing corona could originate from radiation-pressure driven optically thick (τ>3) outflows which act like a corona above the disc at relatively low temperatures