The fraction of late-type galaxies in galaxy clusters up to z~1

Oğuzhan ÇAKIR 1 , Sinan  Aliş 1 , E. Kaan  Ülgen 1 , F. Korhan  Yelkenci 1 , Süleyman Fişek 1

  • 1 İstanbul University, İstanbul

Abstract

We present the late-type galaxy fractions in galaxy clusters in the redshift range 0.1 < z < 1.0. Our sample contains ~1000 galaxy clusters with richnesses λ>15. We classified late-type galaxies based on both photometric and spectroscopic data. We analyzed f_late as a function of cluster richness and cluster-centric radius. Our results are consistent with previous studies and especially the well-known Butcher-Oemler effect and morphology-density relation. Finally, we give the f_late as a function of cluster redshift for the richest systems as f_late = (0.26±0.03)×(1+z)^(1.30±0.20).

The fraction of late-type galaxies

Once member galaxies are determined, we classify them analyzing their SED by implementing LePhare algorithm (Arnouts et al., 1999; Ilbert et al., 2006). There are 66 extrapolated SED templates derived from templates that of Coleman et al. (1980) and Kinney et al. (1996). As a by-product LePhare gives SED template solutions as a parameter called "MODE". Using this parameter, we separated members as early-types (Ell) to be MODE≤22, whereas late-types (Sp, Irr, SB) to be MODE>22. We then compute the fraction of both populations for each cluster as follows

f_{ETG} = \frac{N_{Ell}}{N}
f_{LTG} = \frac{N_{Sp+Irr+SB}}{N}

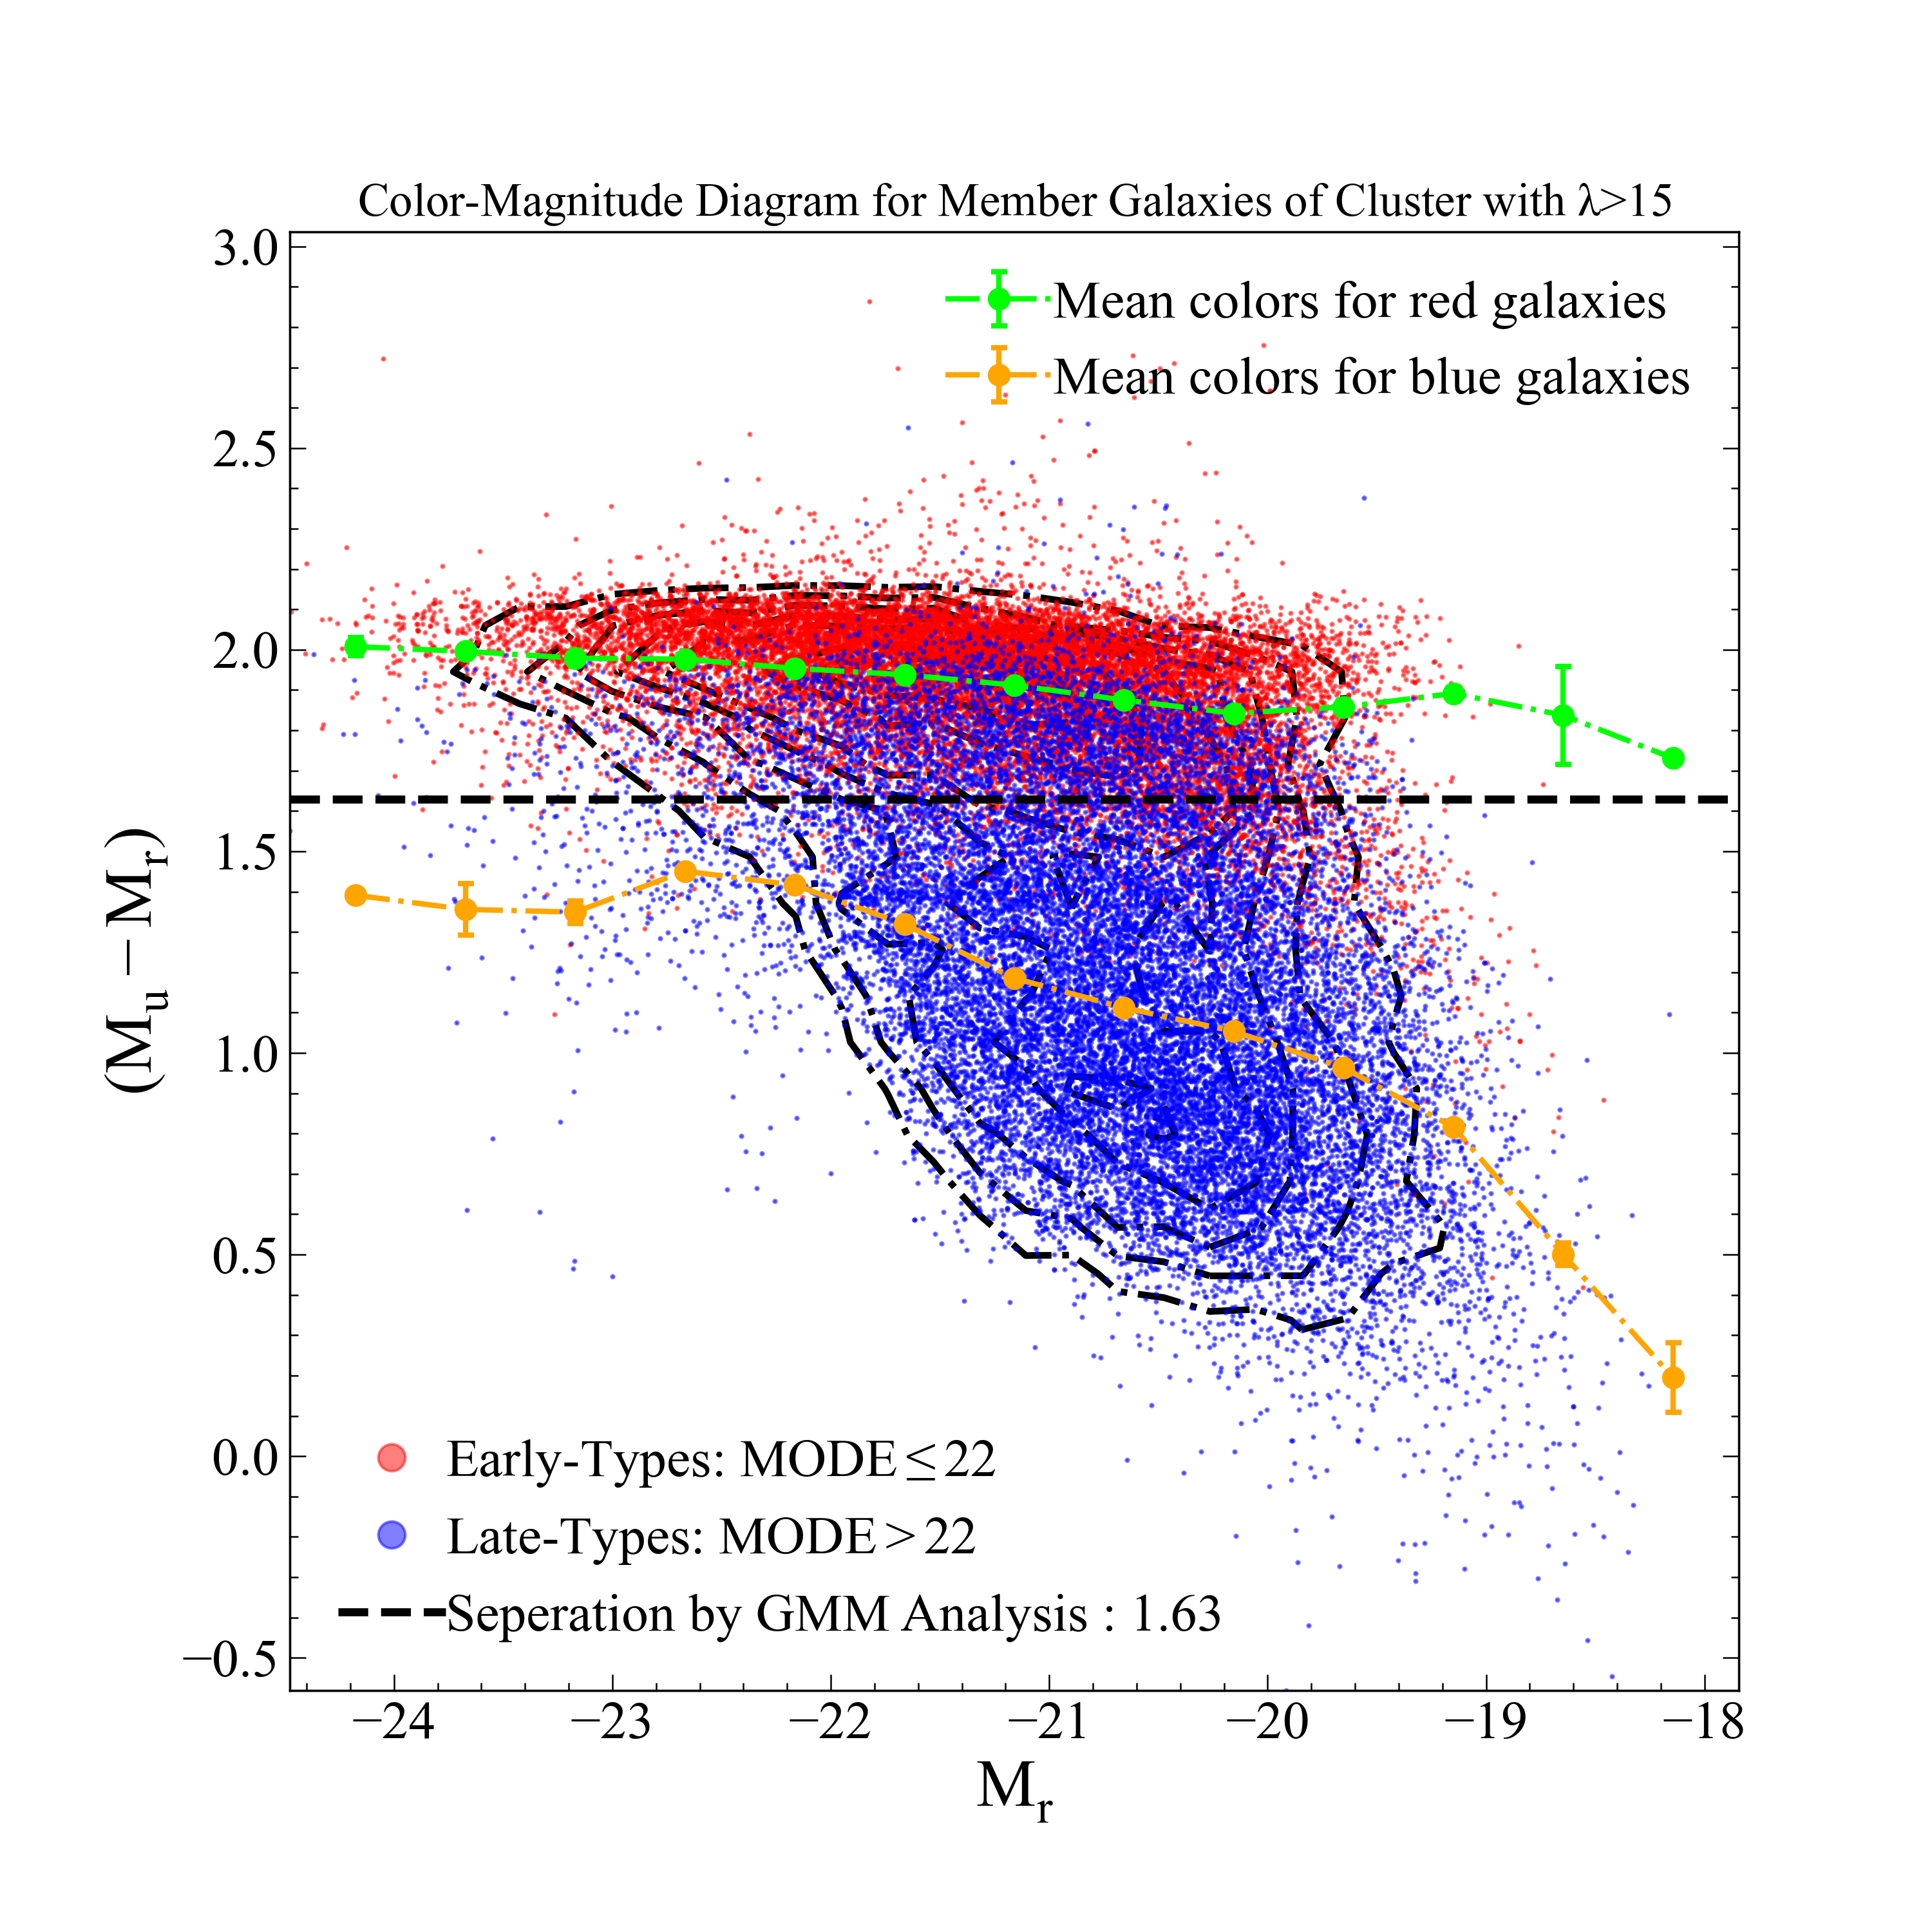
Figure 3 : Color-magnitude diagram for member galaxies. Red and blue dots indicate the galaxies defined as early-type and late-type, respectively. Dashed horizontal line is the color separation for red/blue galaxies obtained by GMM analysis. Green and orange dots show the mean (Mu-Mr) color for binned magnitudes for early-type and late-type galaxies, respectively.

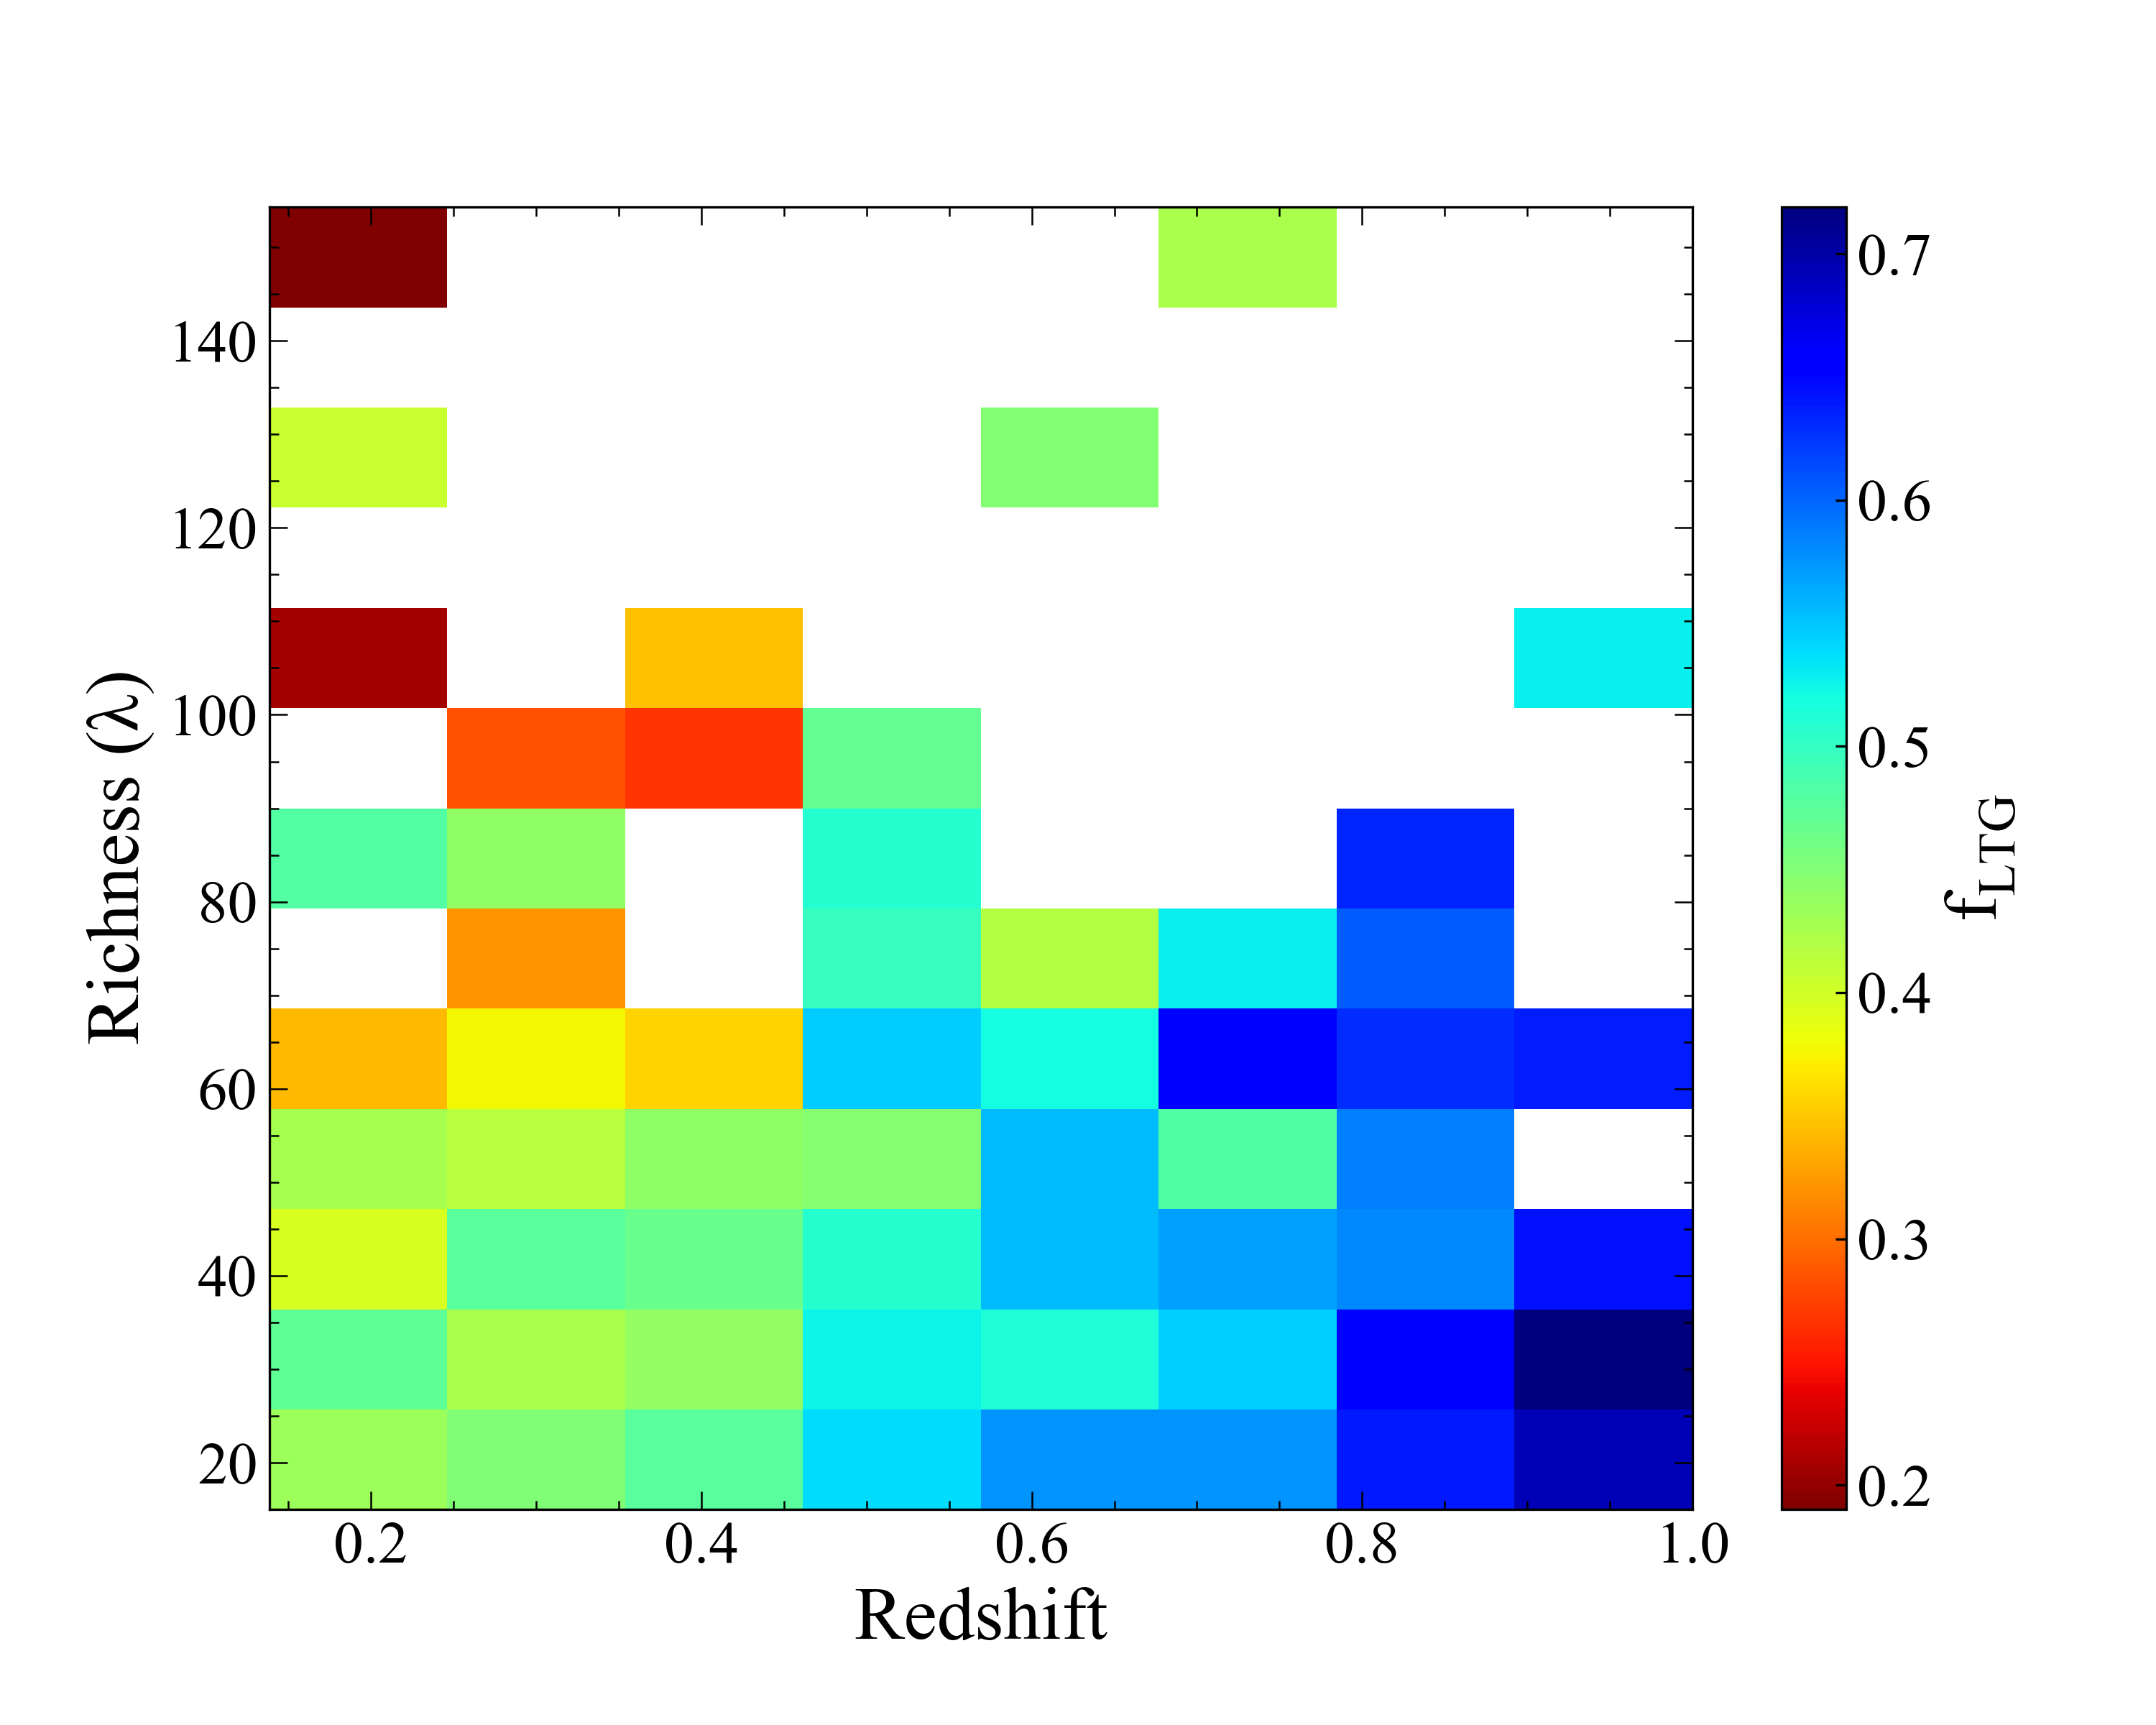
Figure 4 : Richness and redshift distribution of the clusters with λ>15 as a 2D histogram. The color codes represent the fraction late-type galaxies, the bluer the color, the higher fraction of late-type galaxies.

Results

In general, evolution of fraction is in agremeent with literature that clusters at lower redshifts (z<0.5) have lower fraction of late-type galaxies than higher counterparts, regardless cluster richnesses.  As we take into account richnesses, especially for z<0.5 the decrease in the late-type fraction becomes more dramatic for rich clusters with ΔfLTG~0.2,  whereas ΔfLTG~0.1 for poor clusters. In order to quantify the trend, we apply a power law as fLTG (1+z)n. For richer clusters, we obtain fLTG = (0.29 ± 0.02) (1+z)(1.28±0.16).

Figure 5 : Late-type galaxy fraction as a function of redshift for different richness cuts. For both cases, the red line indicates the best-fitting evolutionary fit of the form of fLTG=α(1 +z)n.

Alongside with cluster richnesses, we also examine the fraction evolution as a function of the distance to the cluster center. For this purpose, we define two regions in the clusters; core that represents the inner 0.5 Mpc, and outskirts spanning between 0.5 and 1 Mpc. Regardless how rich the cluster is, the late-type fraction decreases through redshift for both core and outskirts. In addition, as the richness increases, core and outskirts as well seem to be dominated by early-type galaxies at earlier epochs. 


Figure 6 : Fraction of early-type (red circles) and late-type galaxies (blue circles) as a function of redshift for two different richness bins and clustercentric radius bins. From top to bottom, poor (15<λ≤30) and rich (λ>30) clusters and from left to right, cluster cores (rcl<0.5 Mpc) and outskirts (0.5<rcl<1 Mpc) are shown, respectively.

Some studies shows that the evolution of fETG,Red (in other words fLTG,Blue) depends on galaxy mass. Li et al. (2012) showed that there is a strong correlation between fETG and galaxy mass. Jian et al. (2018) presented that the Butcher-Oemler effect is seen in clusters, however depends on galaxy mass. The effect is more obvious for less-massive galaxies. Therefore, we investigate the dependency between late-type fraction and galaxy mass.

In order to estimate stellar masses, we use Code Investigating GALaxy Emission (CIGALE; Burgarella et al., 2005; Noll et al., 2009; Boquien et al., 2019) SED-fitting code. We use the delayed star formation history with star-forming time scale τ ranging from 0.1 to 20 Gyr by assuming BC03 (Bruzual & Charlot, 2003) single stellar population with solar metallicity and Chabrier initial mass function (Chabrier, 2003), dust attenuation model given by Calzetti et al. (2000) with E(B-V) values between 0 and 0.5.

We compute the mass completeness for the sample following the recipe given by Pozzetti et al. (2010) as log(Mlim(z~0.1))=~9.2, log(Mlim(z~0.4))=~10.0 and log(Mlim(z~0.7))=10.7.

Overall, we see a redshift evolution for all mass bins with a decreasing slope. However, towards to higher masses, there is a clear trend between mean fLTG and galaxy mass as <fLTG> ~0.7 at logM*~9.5, whereas <fLTG> ~0.4 at logM*~11 that agrees with mass quenching scenario (Peng et al. (2010b)).

Figure 7 :  Fraction of late-type galaxies as a function of redshift for different mass bins. Red, blue and black dots and lines represent galaxies at rich clusters, poor clusters and field, respectively.

Data

Cluster Sample

In this work, we use a main sample of 3284 galaxy clusters spanning in a range between 0.1< z <1 from the CFHTLS-W1 region that detected by the WaZP cluster-finder algorithm (Aguena et al., 2021). In order to investigate the effect of the environment well, we apply a cut on the main cluster sample as richness (λ)>15. After this cut, ~1000 clusters meet the condition. We then define poor clusters/groups as the clusters with 15<λ≤30, whereas rich clusters as the clusters with λ>30. 

Figure 1 : Richness distribution of the whole cluster sample.

Figure 2 : Redshift distribution of the clusters with λ>15. The red line represents the poor cluster sample (15<λ≤30), whereas the black line represents the rich cluster sample (λ>30).

Member Sample

Determining the memberships of galaxies of clusters is an important issue in order to study different populations.  The membership list was constructed with the approach described in Castignani & Benoist (2016). In their recipe, photometric redshifts, magnitudes, and cluster-centric radii of galaxies are used to determine the membership probabilities. For our cluster sample (λ>15), there are ~40000 members matched from the list aforementioned. 

Last article

Acknowledgements

This work is supported by the TUBITAK project 117F311 through the ARDEB-1001 Program. SA acknowledges support from Istanbul University with project BEK-46743.

References 

Aguena M., et al., 2021, MNRAS, 502, 4435

Arnouts S., Cristiani S., Moscardini L., Matarrese S.,Lucchin F., Fontana A., Giallongo E., 1999, MNRAS, 310, 540

Bahcall N. A., “Clusters and Superclusters of Galaxies”, in Formation of Structure in the Universe, eds. J.P. Ostriker and A. Dekel (Cambridge University Press, Cambridge), p. 135 (1998), (astro-ph/9611148)

Boquien M., Burgarella D., Roehlly Y., Buat V., Ciesla L., Corre D., Inoue A.K., Salas H., 2019, A&A, 622, A103

Bruzual G., Charlot S., 2003, MNRAS, 344, 1000

Burgarella D., Buat V., Iglesias-Paramo J., 2005, MNRAS, 360, 1413

Butcher H., Oemler A. J., 1978, ApJ, 226, 559

Butcher H., Oemler A. J., 1984, ApJ, 285, 426

Calzetti D., Armus L., Bohlin R. C., Kinney A. L., Koornneef J., Storchi-Bergmann T., 2000, ApJ, 533, 682

Castignani G., Benoist C., 2016, A&A, 595, A111

Chabrier G., 2003, PASP, 115, 763

Coleman G. D., Wu C. C., Weedman D. W., 1980, ApJS, 43, 393

Dressler A., 1980, ApJ, 236, 351

llbert O., et al., 2006, A&A, 457, 841

Jian H.-Y., et al., 2018, PASJ, 70, S23

Kinney A. L., Calzetti D., Bohlin R. C., McQuade K., Storchi-Bergmann T., Schmitt H. R., 1996, ApJ, 467, 38

Li, I. H., Yee, H. K. C., Hsieh, B. C., & Gladders, M. 2012, ApJ, 749, 150

Noll S., Burgarella D., Giovannoli E., Buat V., Marcillac D., Muñoz-Mateos J. C., 2009, A&A, 507, 1793

Peng, Y.-j., Lilly, S. J., Kovac, K., et al. 2010b, ApJ, 721, 193

Pozzetti L., et al., 2010, A&A, 523, A13


Introduction

Galaxy clusters are very good probes to investigate the impacts of environment on the galaxy evolution since they are host to hundreds or even thousands of galaxies that can interact with each other (e.g. mergers) as well as with intracluster medium (ICM, e.g. ram-pressure stripping). Galaxies can be divided into different populations such as early/late-type or red/blue galaxies morphologically or based on their colors. Early-type galaxies (abbr. ETG) have usually redder colors which means that they halt their star forming activity, whereas late-type galaxies (abbr. LTG) are bluer than early-type galaxies and still forming stars. Therefore, early-type galaxies are also called 'red and dead' galaxies. Dressler stated in his seminal paper (Dressler, 1980) that the most dense regions in the universe are dominated by early-type galaxies (i.e. the morphology-density relation).  Hence, galaxy clusters are mainly dominated by early-type galaxies with a ratio of (NETG/NLTG) ~ 4-5 (Bahcall, 1998). However, Butcher and Oemler (1978, 1984) stated that in the core region of clusters at intermediate redshift (z~0.5) have more blue galaxies with respect to their counterparts at low redshifts.