Evolved massive stars in the Magellanic Clouds

Ming Yang 1 , Alceste Bonanos 1 , Biwei Jiang 2 , Jian Gao 2 , Panagiotis Gavras 3 , Grigoris Maravelias 1 , Man I  Lam 4 , Shu Wang 4 , Xiaodian Chen 4 , Yi Ren 2 , Frank Tramper 1 , Zoi Spetsieri 1

  • 1 IAASARS, National Observatory Of Athens, Athens
  • 2 Department of Astronomy, Beijing Normal University, Beijing
  • 3 Rhea Group for ESA/ESAC, Madrid
  • 4 National Astronomical Observatories, Chinese Academy of Sciences, Beijing

Abstract

We present two clean, magnitude-limited (IRAC1 or WISE1≤15.0 mag) multiwavelength source catalogs for the Large and Small Magellanic Cloud (LMC and SMC). The catalogs were built by crossmatching (1'') and deblending (3'') between the source list of Spitzer Enhanced Imaging Products (SEIP) and Gaia Data Release 2 (DR2), with strict constraints on the Gaia astrometric solution in order to remove the foreground contamination. It is estimated that about 99.5% of the targets in our catalog are most likely genuine members of the LMC and SMC. The LMC catalog contains 197,004 targets in 52 different bands, while SMC catalog including contains 45,466 targets in 50 different bands, ranging from the ultraviolet to the far-infrared. Additional information about radial velocities and spectral and photometric classifications were collected from the literature. For the LMC, we compare our sample with the sample from Gaia Collaboration et al. (2018), indicating that the bright end of our sample is mostly comprised of blue helium-burning stars (BHeBs) and red HeBs with inevitable contamination of main sequence stars at the blue end. For the SMC, by using the evolutionary tracks and synthetic photometry from MESA Isochrones & Stellar Tracks and the theoretical J-Ks color cuts, we identified and ranked 1,405 red supergiant (RSG), 217 yellow supergiant (YSG), and 1,369 blue supergiant (BSG) candidates in the SMC in five different color-magnitude diagrams (CMDs), where attention should also be paid to the incompleteness of our sample. For the LMC, due to the problems with models, we applied modified magnitude and color cuts based on previous studies, and identified and ranked 2,974 RSG, 508 YSG, and 4,786 BSG candidates in the LMC in six CMDs. The comparison between the CMDs from the two catalogs of the LMC SMC indicates that the most distinct difference appears at the bright red end of the optical and near-infrared CMDs, where the cool evolved stars (e.g., RSGs, asymptotic giant branch stars, and red giant stars) are located, which is likely due to the effect of metallicity and star formation history. A further quantitative comparison of colors of massive star candidates in equal absolute magnitude bins suggests that there is essentially no difference for the BSG candidates, but a large discrepancy for the RSG candidates since LMC targets are redder than the SMC ones, which may be due to the combined effect of metallicity on both spectral type and mass-loss rate as well as the age effect. The effective temperatures (Teff) of massive star populations are also derived from reddening-free color of (J-Ks). The Teff ranges are 3500≤Teff≤5000 K for an RSG population, 5000≤Teff≤8000 K for a YSG population, and Teff≥8000 K for a BSG population, with larger uncertainties toward the hotter stars.

Memberships of the LMC and SMC

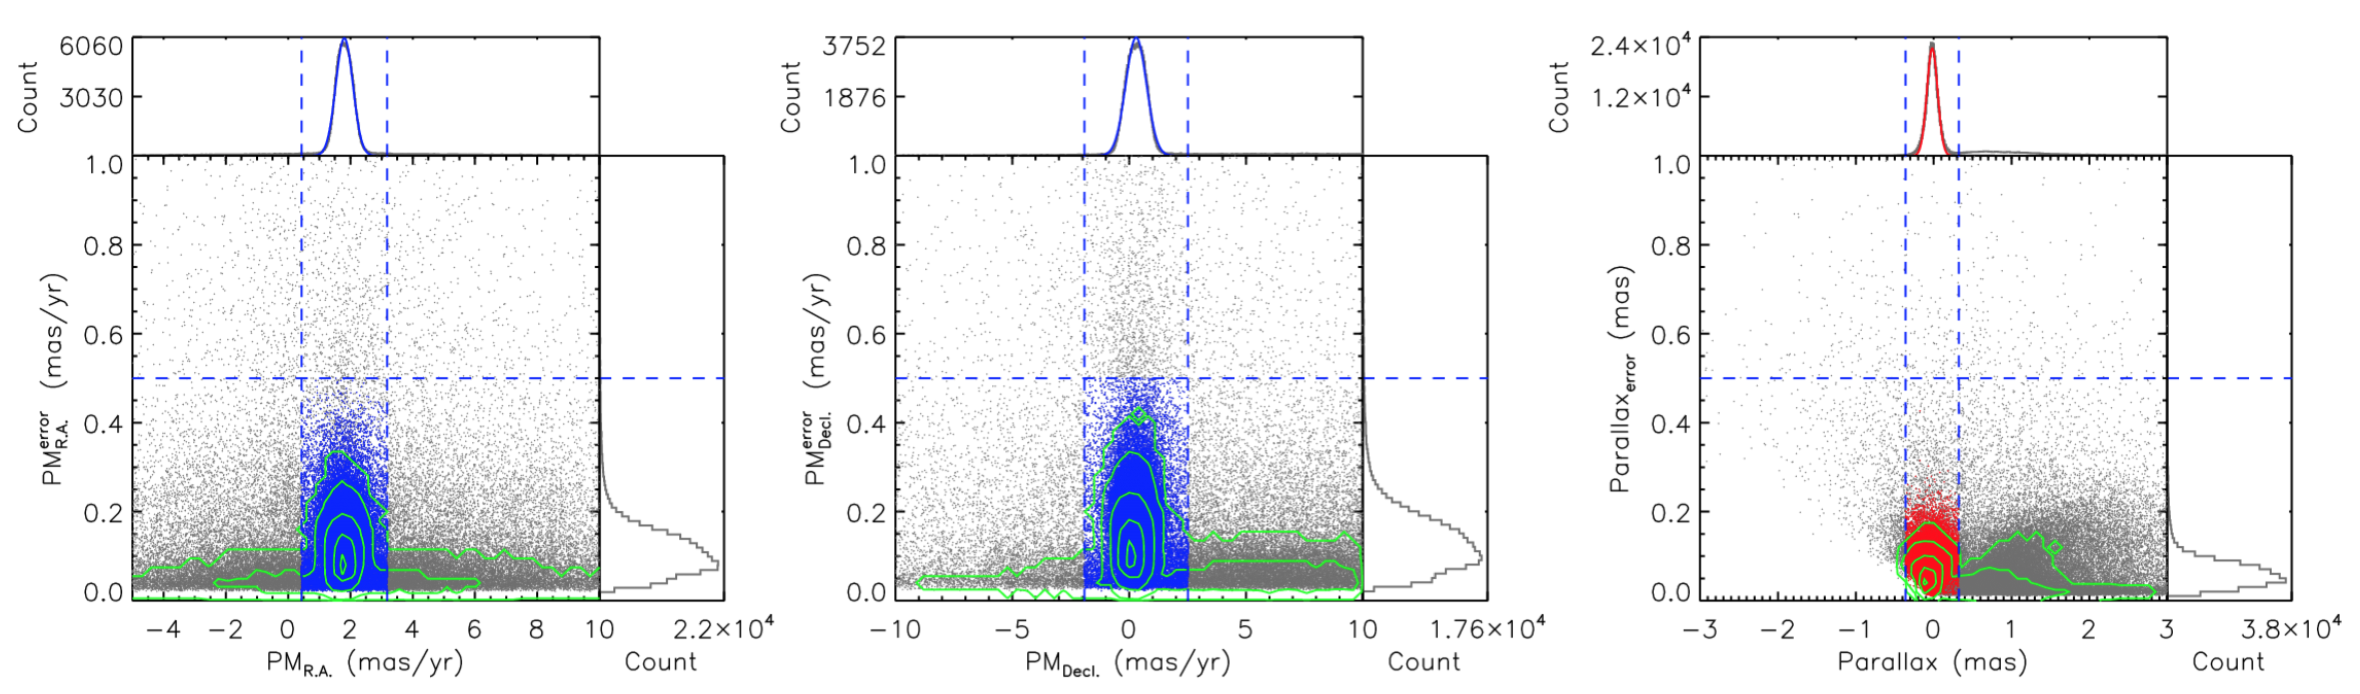
Figure 1. Example of evaluation of the Gaia astrometric solution in the LMC. Membership of the LMC (red) is determined by ±5σ limits (vertical dashed lines) of simultaneous Gaussian profile fittings of PMR.A. (blue), PMDecl. (blue), and parallax (red). For parallax, an additional elliptical constraint is also applied with the 5σ limits of PMR.A. and PMDecl. taken as the primary and secondary radii as also shown in Figure 2, respectively. 

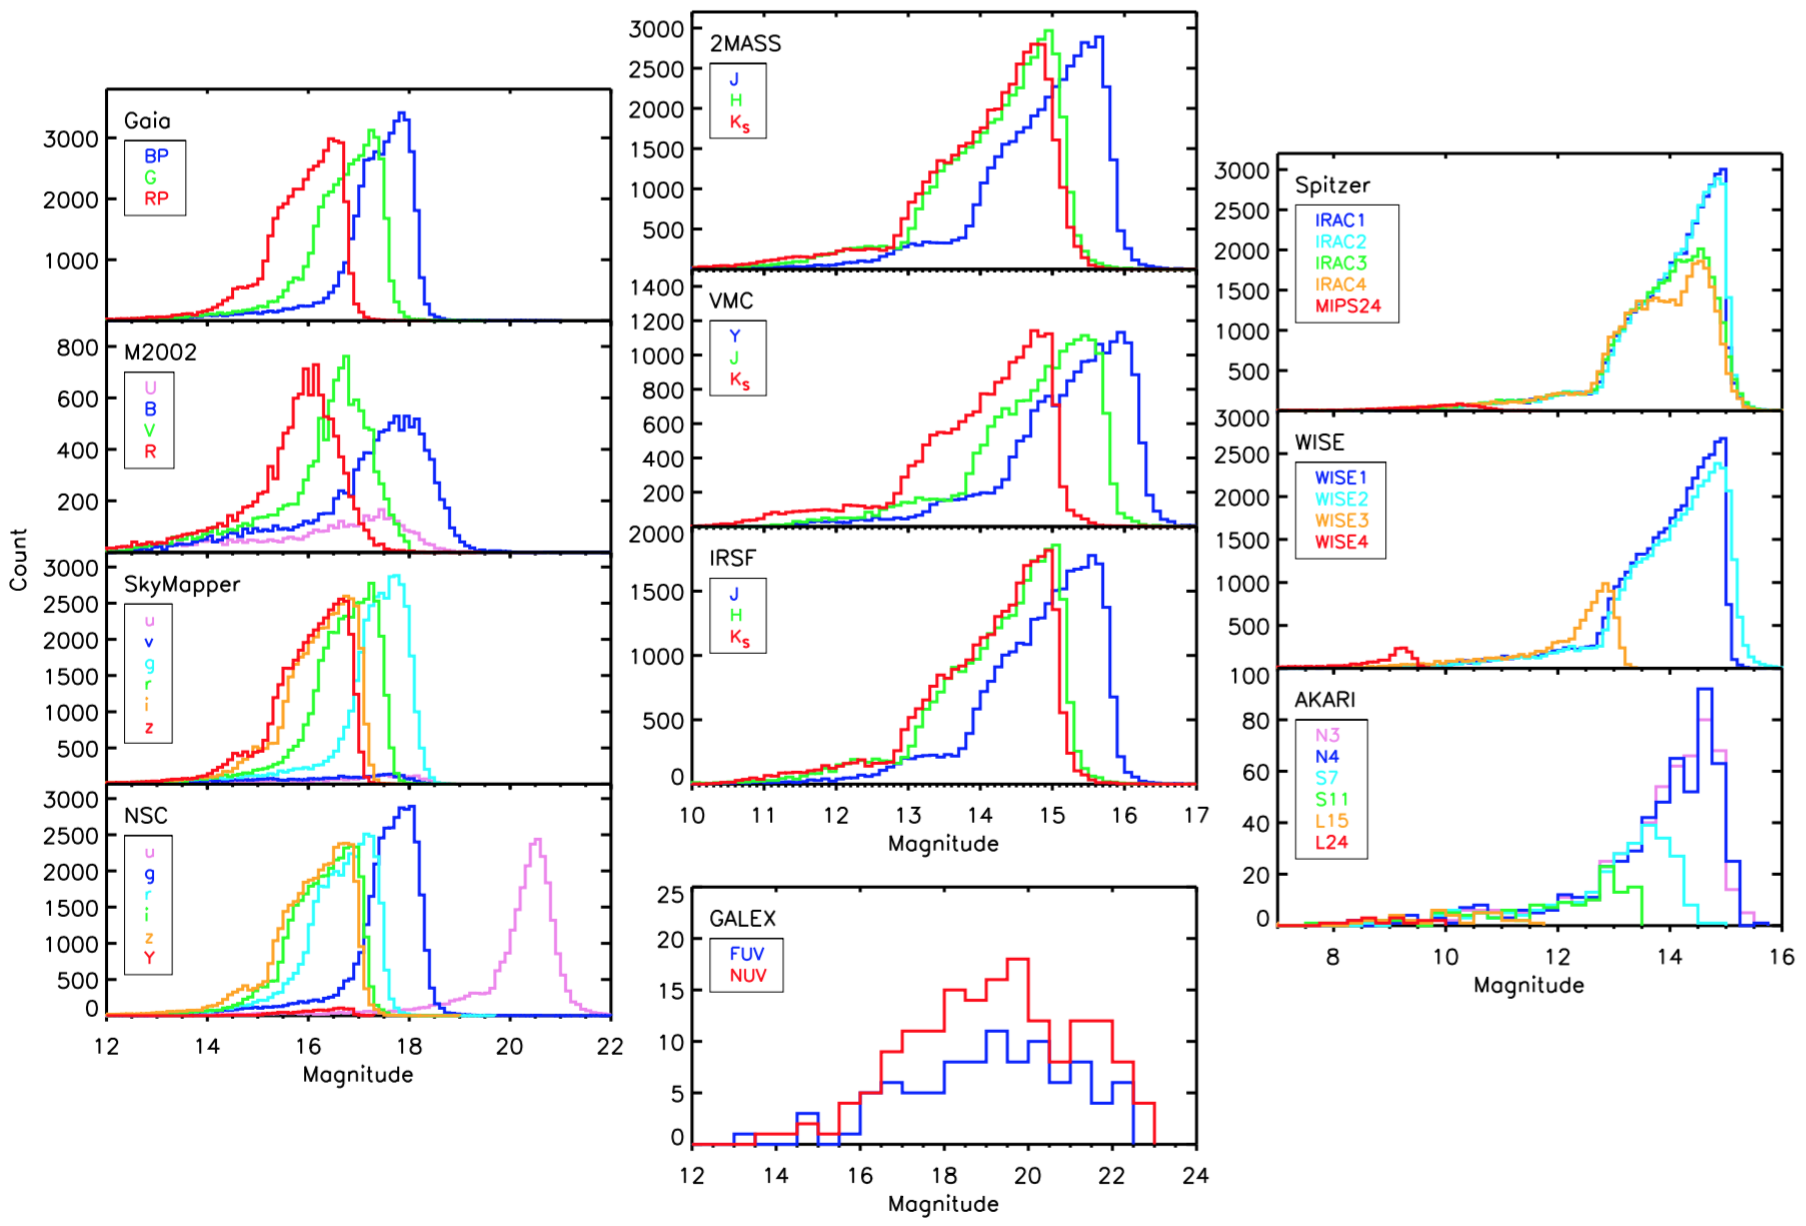
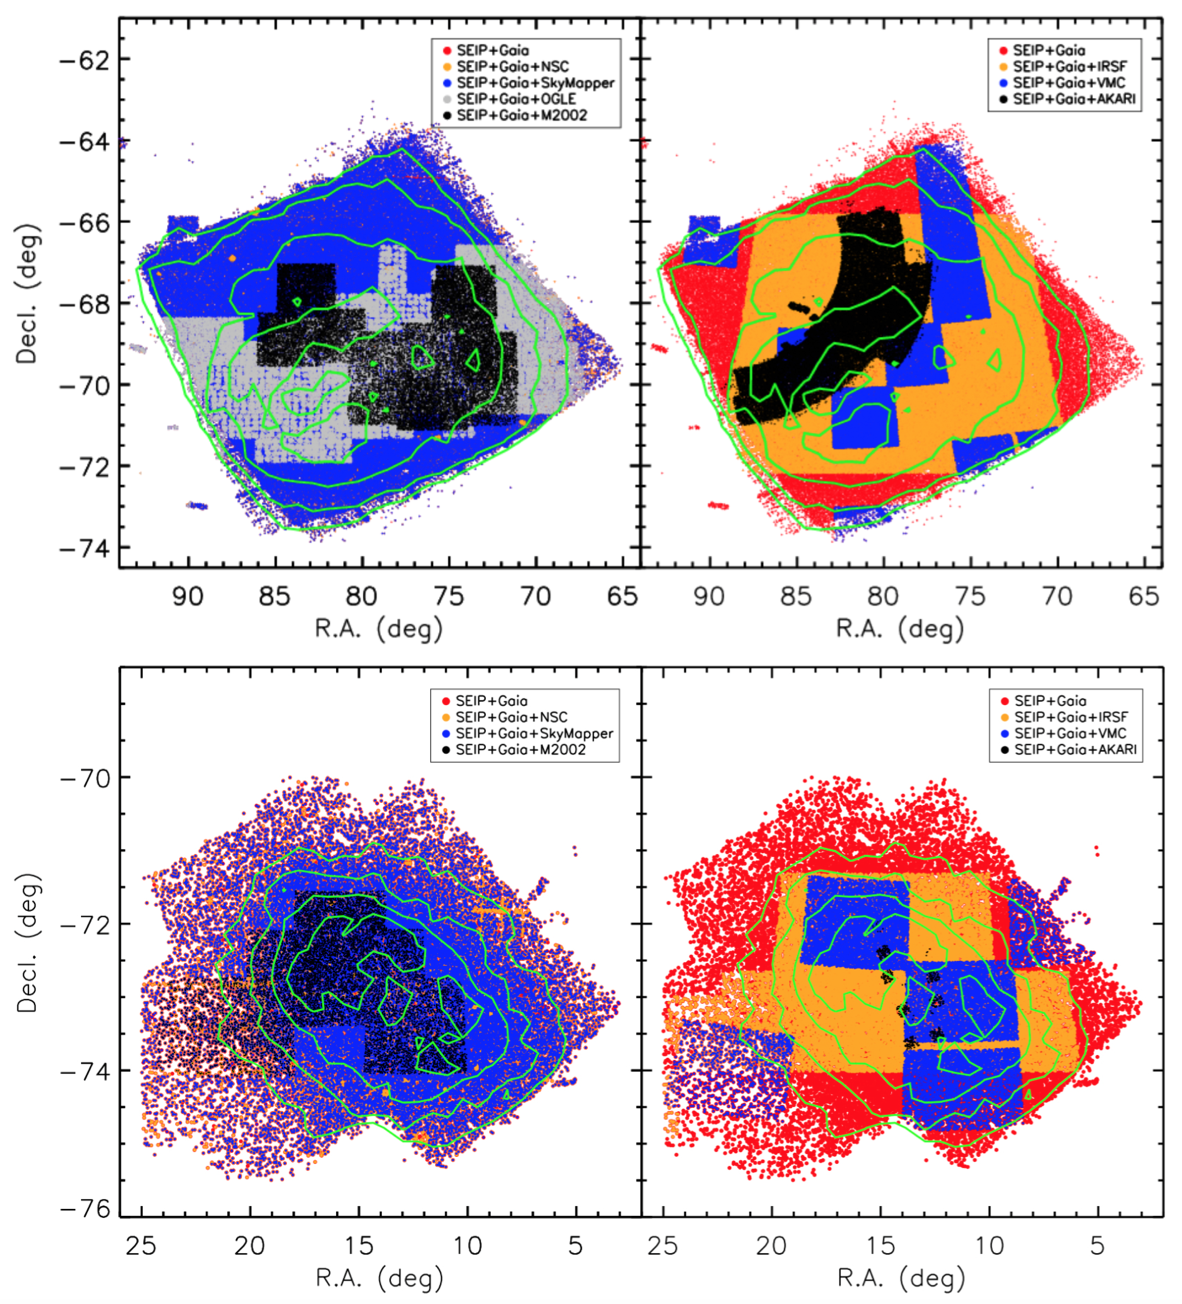
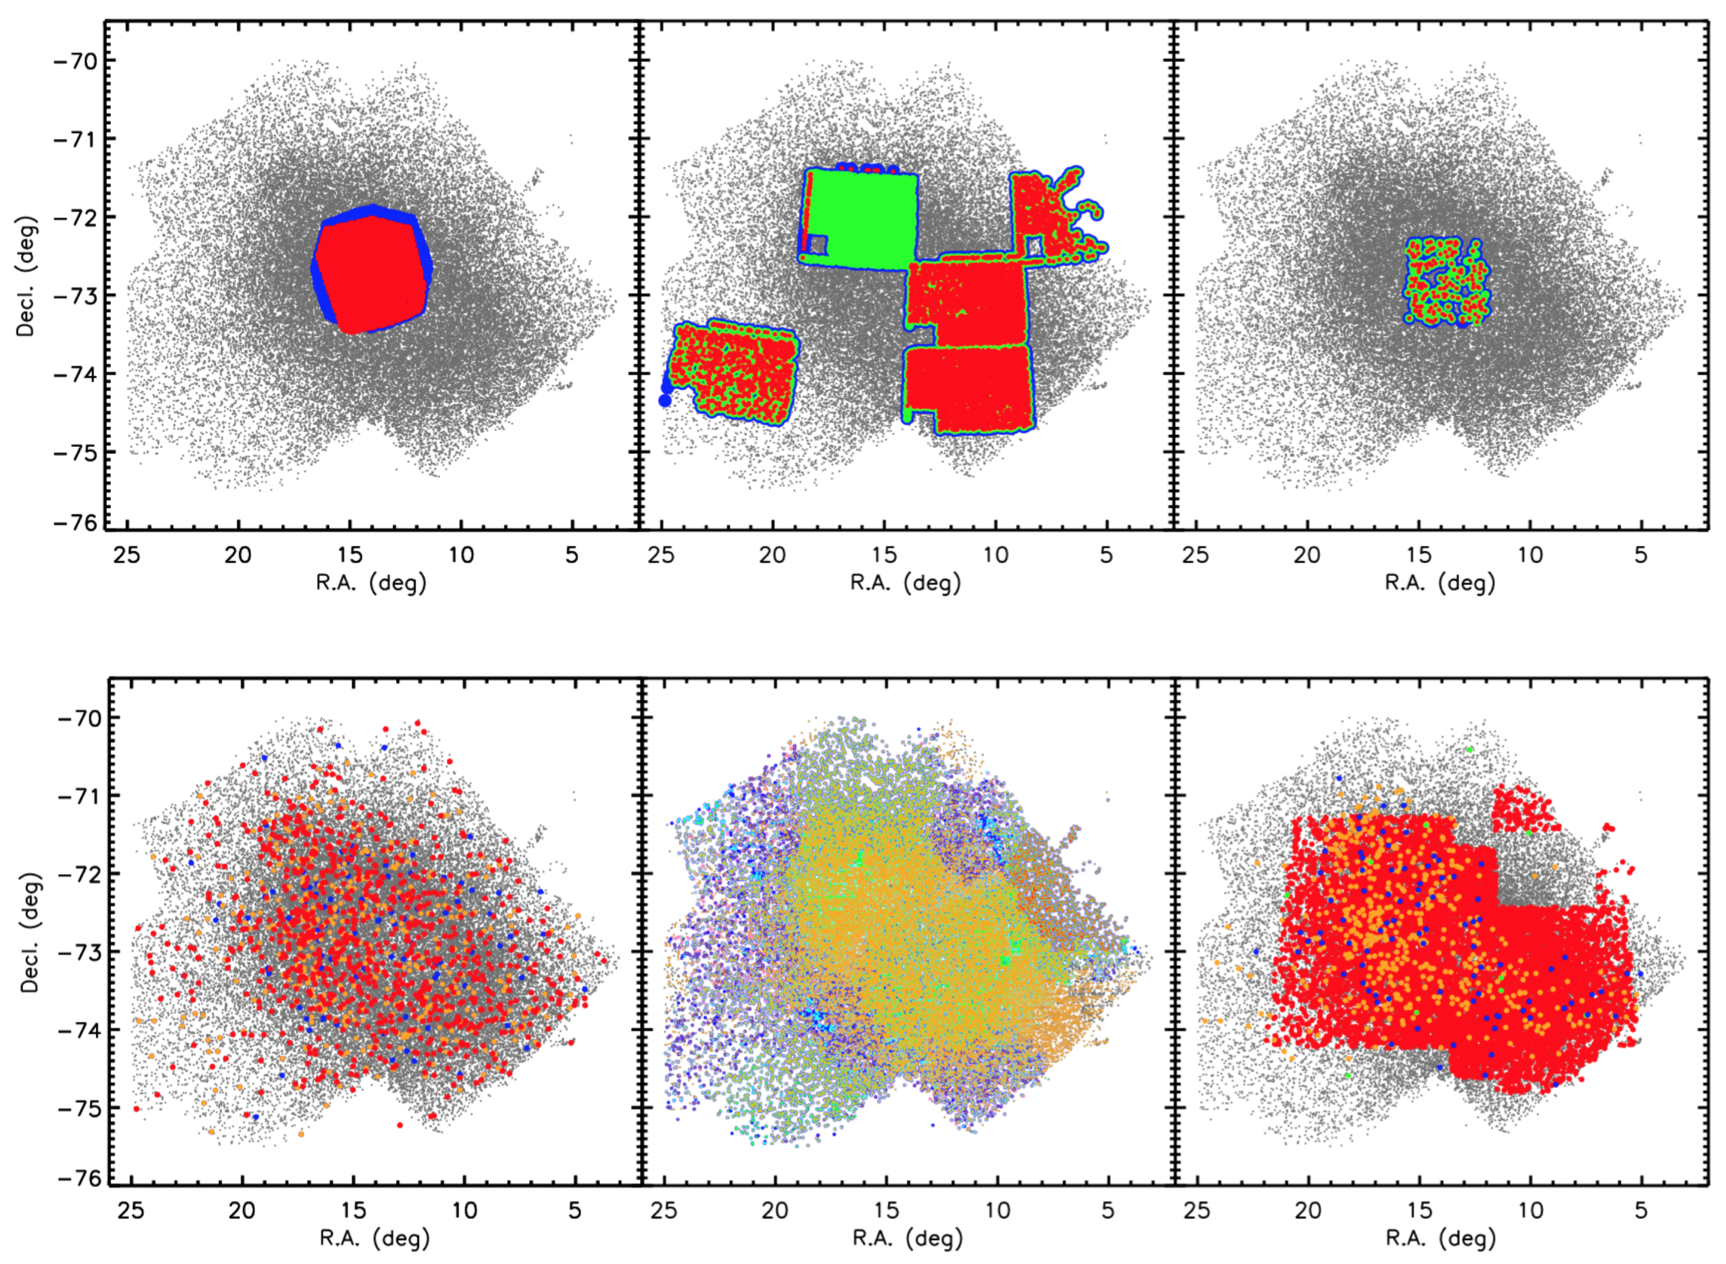
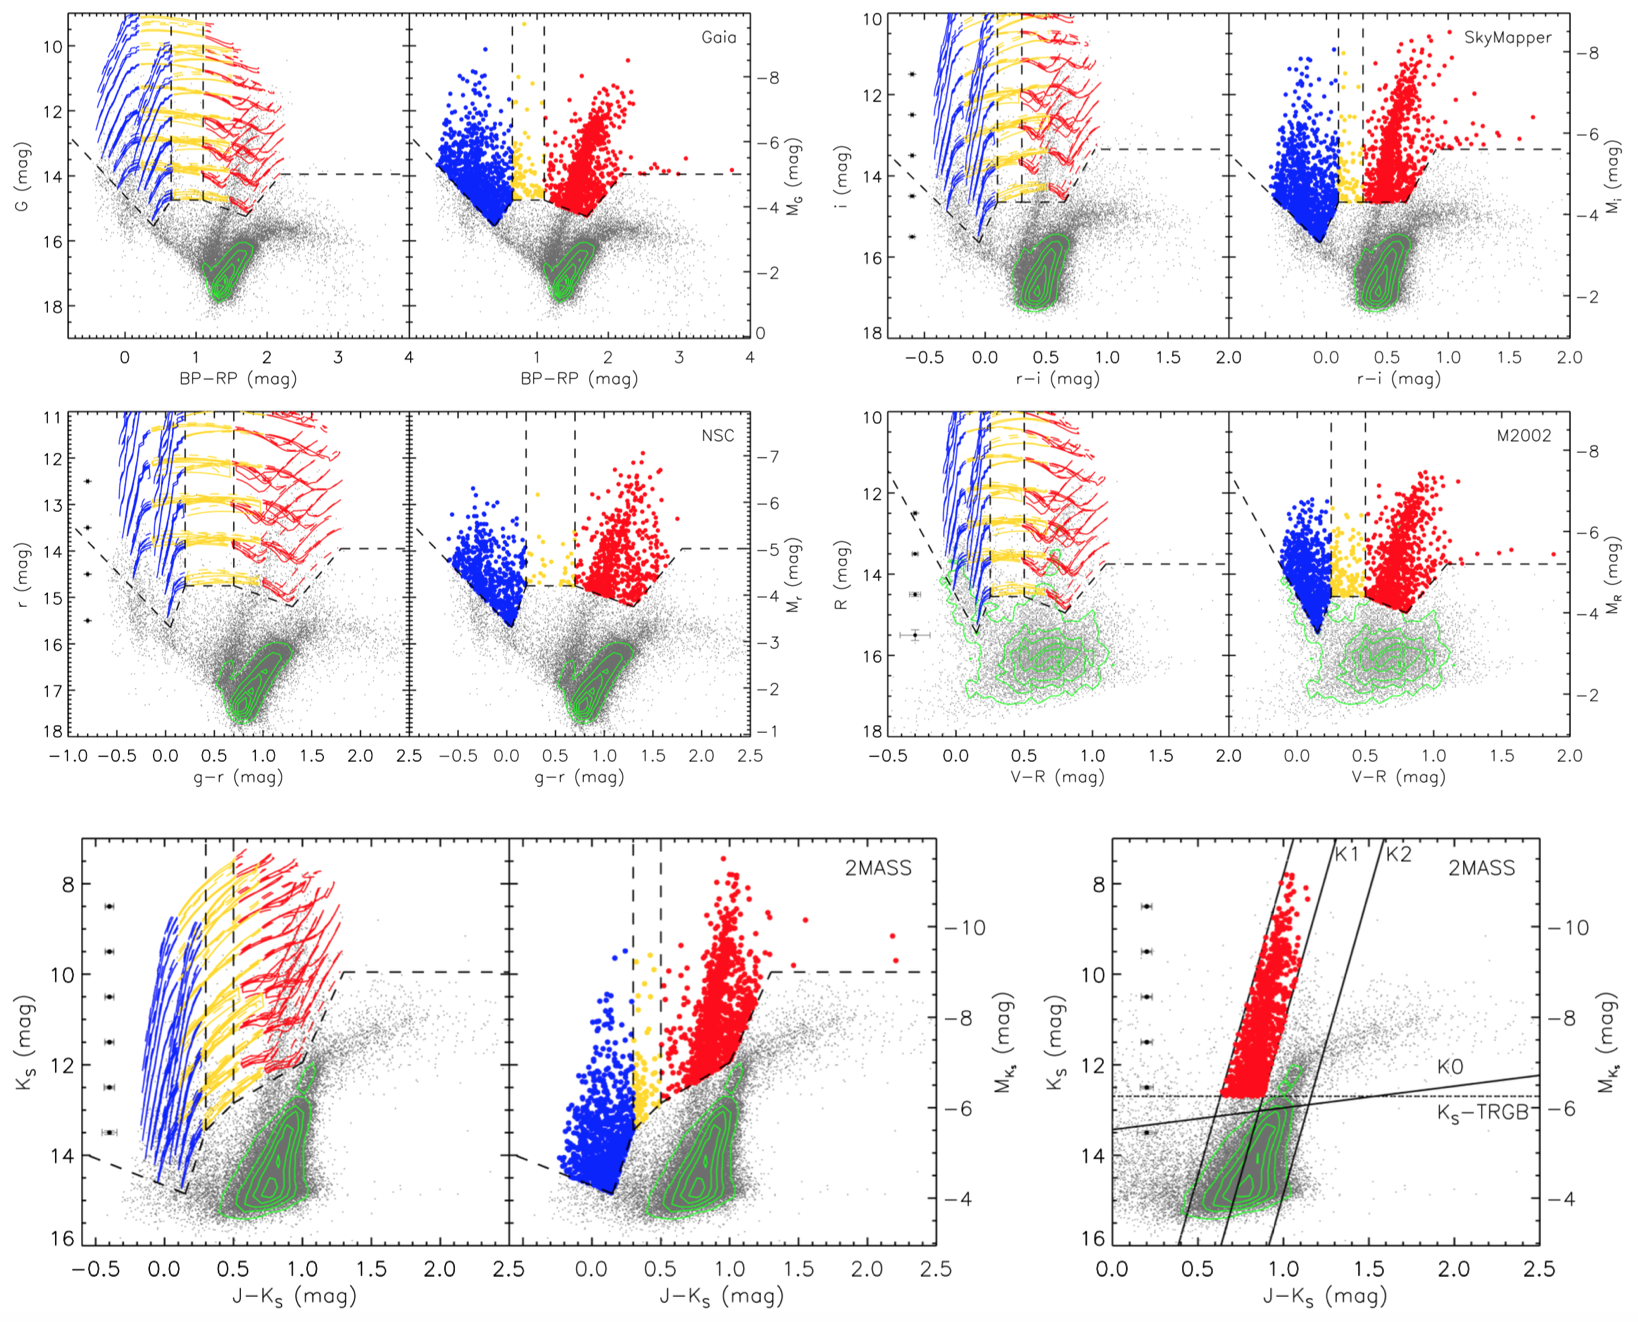
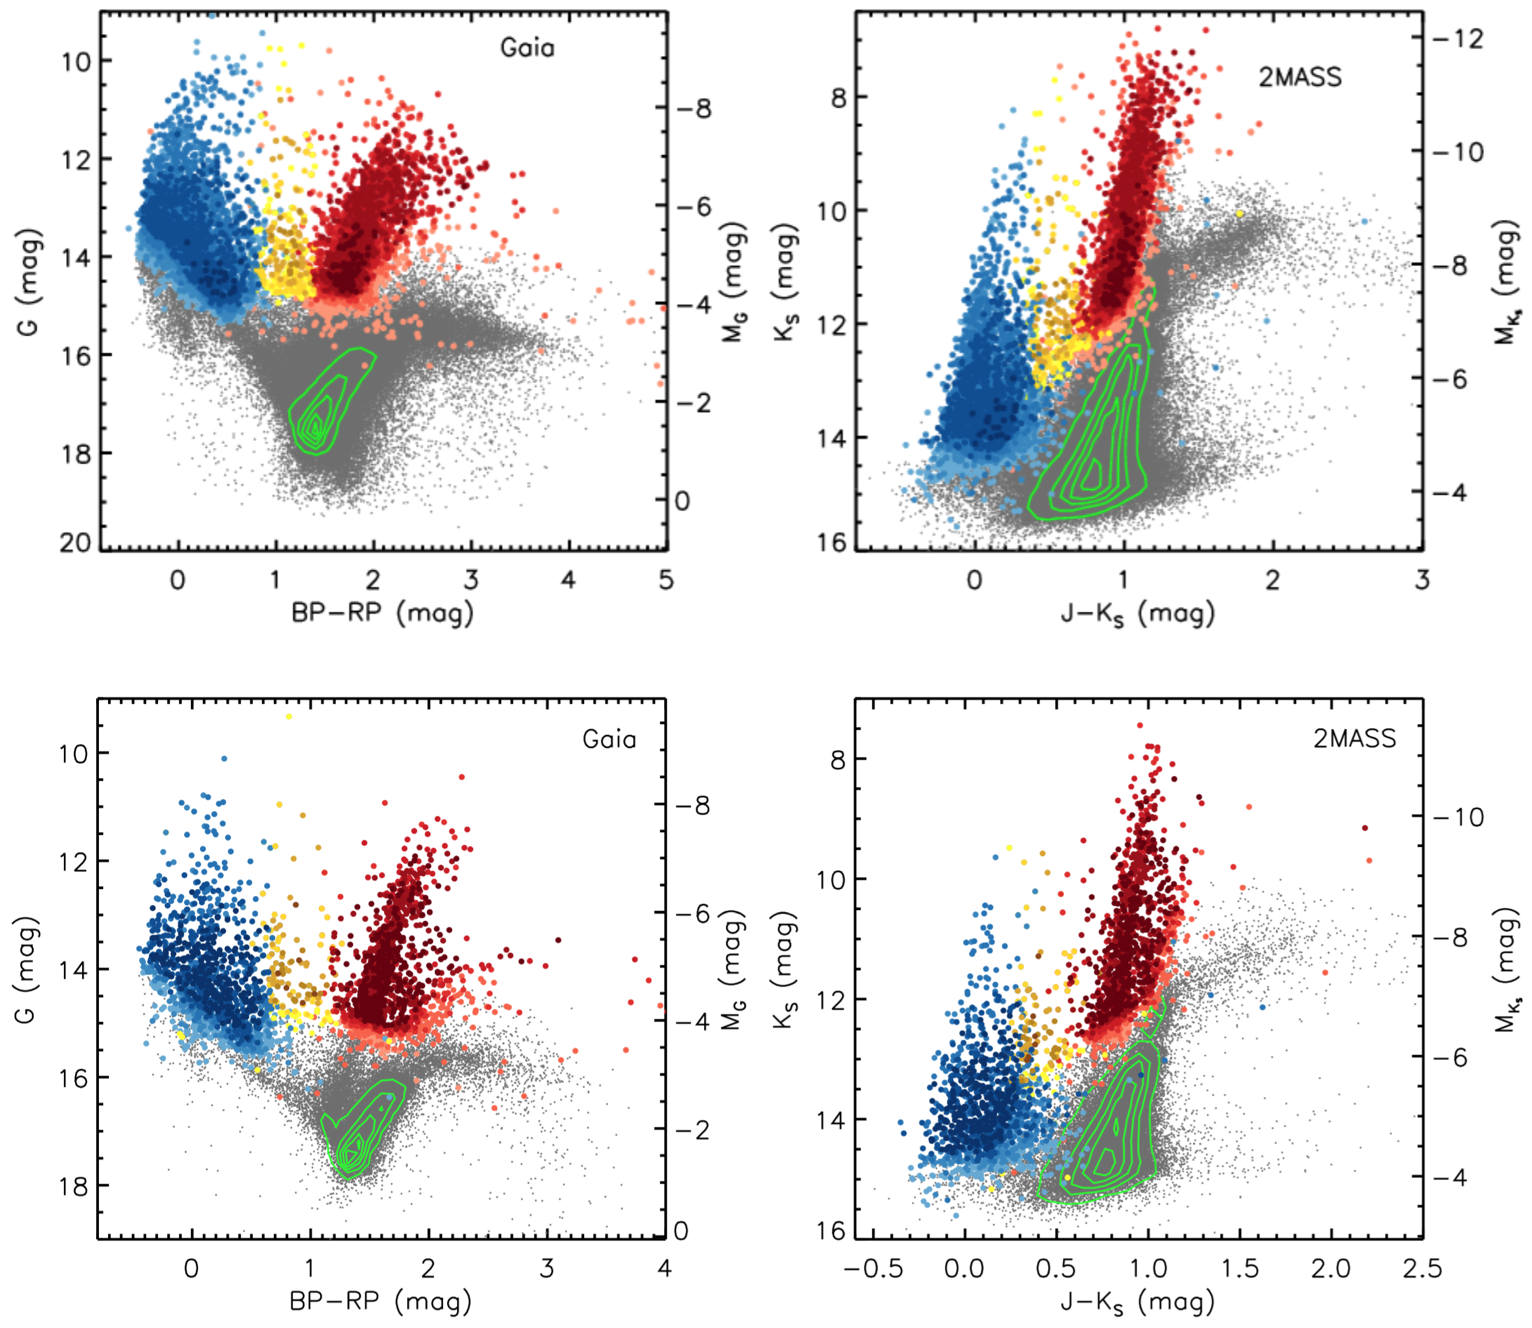
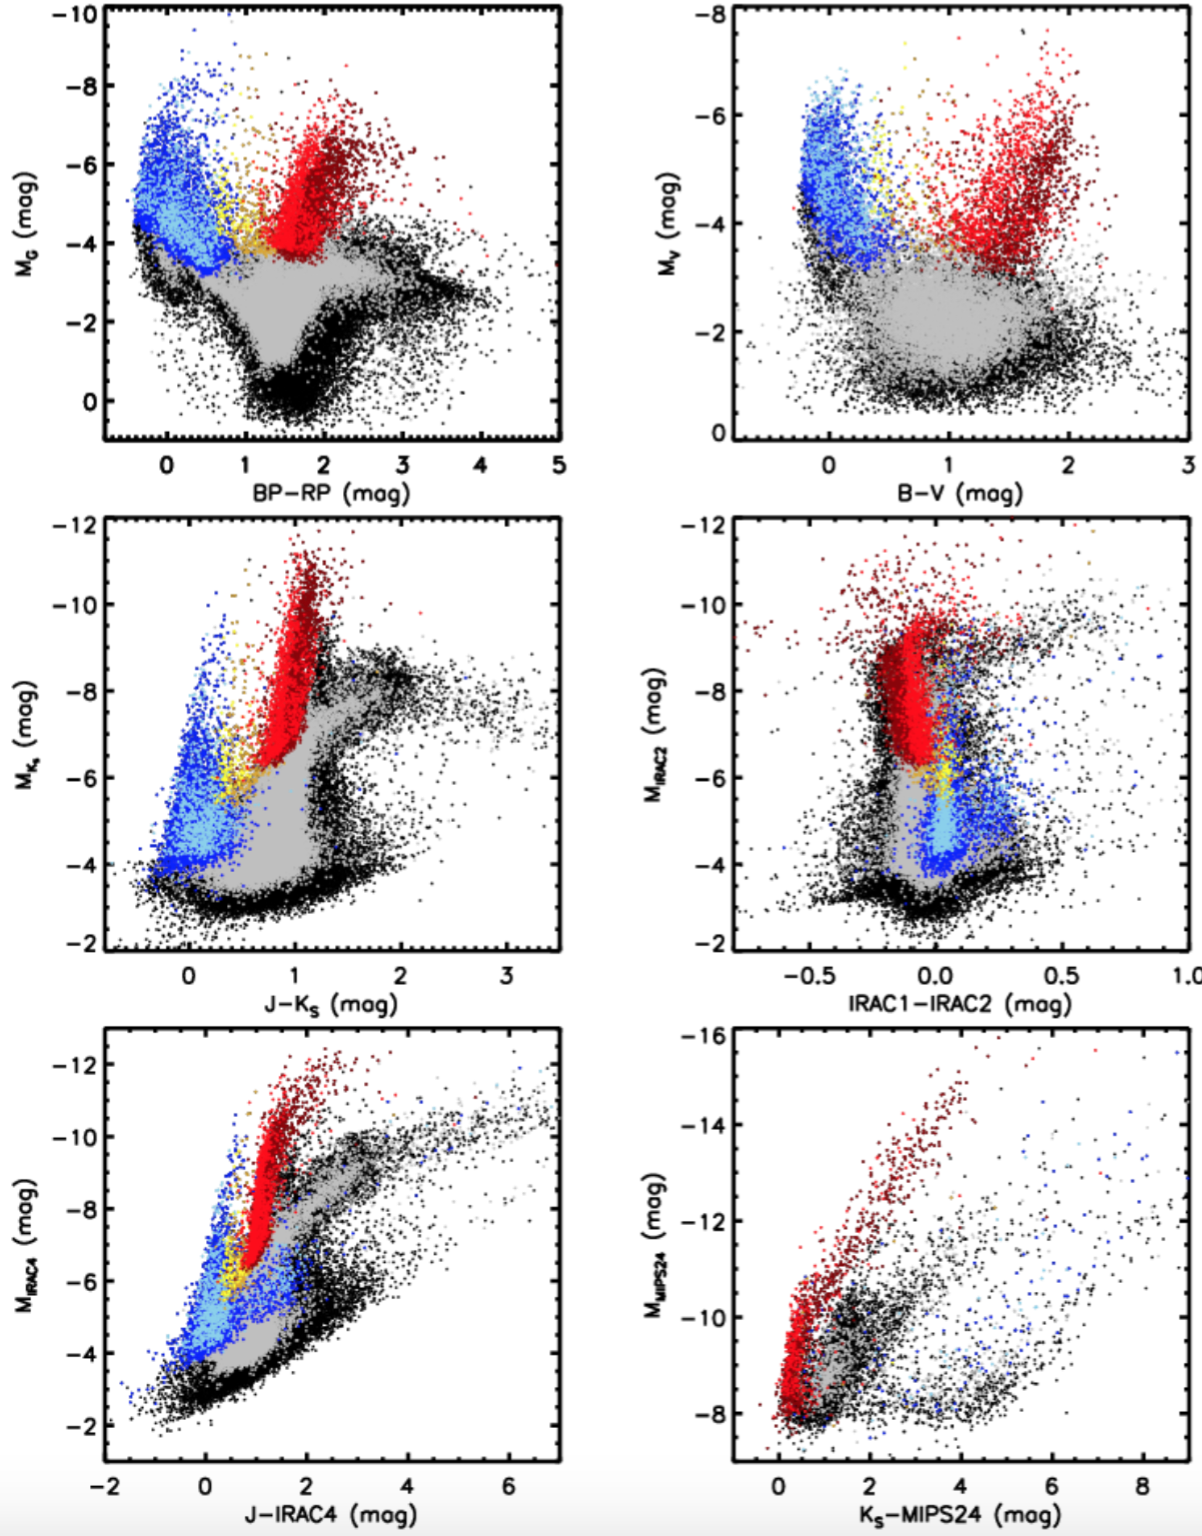
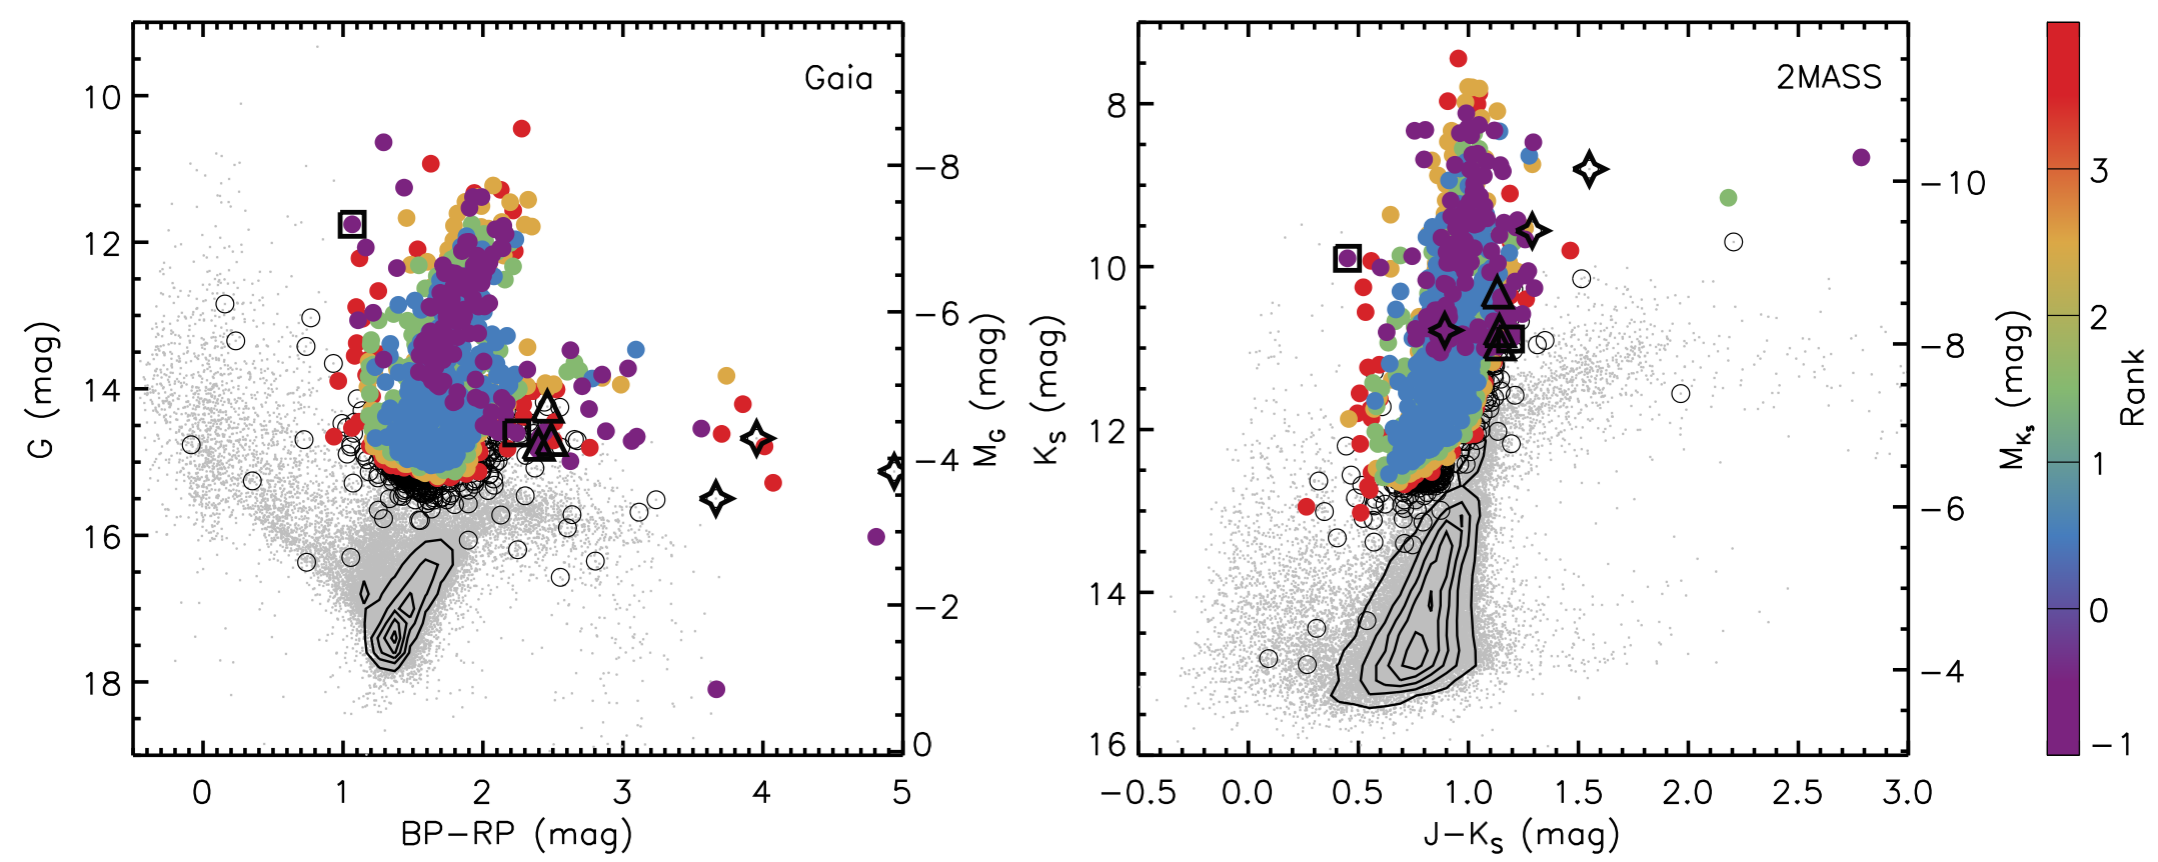
We present two clean, magnitude-limited (IRAC1 or WISE1 ≤ 15.0mag) multiwavelength source catalog for the Large and Small Magellanic Cloud (LMC and SMC). The catalogs were essentially built upon a 1′′ crossmatching and a 3′′ deblending between Spitzer Enhanced Imaging Products (SEIP) source list and Gaia DR2 photometric data, with limiting magnitude of IRAC1 or WISE1 ≤ 15.0 mag. We further constrained the proper motions (PMs) and parallaxes from Gaia DR2 to remove the foreground contamination. The membership of the LMC and SMC were defined by simultaneous Gaussian profile fittings in the PMR.A., PMDecl., and the parallax, where an additional elliptical constraint derived from PMR.A. and PMDecl. also was applied to parallax (the 5σ limits of Gaussian profile fitting in PMR.A. and PMDecl. were taken as the primary and secondary radii, respectively) as shown in Figure 1 and 2 taking the LMC as an example. There are 45,466 targets as in the SMC and 197,004 targets in the LMC, respectively. We estimated that about 99.5% of the targets in our catalogs were most likely to be genuine members of the LMC and SMC. Figure 3 illustrates the Gaia color-magnitude diagram (CMD) before (gray) and after (red) applying the astrometric constraints, where the large amount of foreground contamination is swept out. We also indicate the approximate positions of main sequence stars (MSs), blue helium burning stars (BHeBs), and red HeB stars (RHeBs) for the sample of Gaia Collaboration (2018) compared with our sample (the BHeBs and RHeBs were referred to as BSGs and RSGs in our sample). Since our sample was selected based on the infrared criterion (IRAC1 or WISE1 ≤ 15.0 mag), it presumably traces the relatively luminous, cooler evolved stars with a larger mass-loss rate (MLR), such as the BHeBs and RHeBs, than the MSs. However, there will inevitably also be a source of contamination from the MS massive stars at the blue end, which cannot be easily disentangled as shown in the diagram. See more details in Yang et al. (2019, 2021).

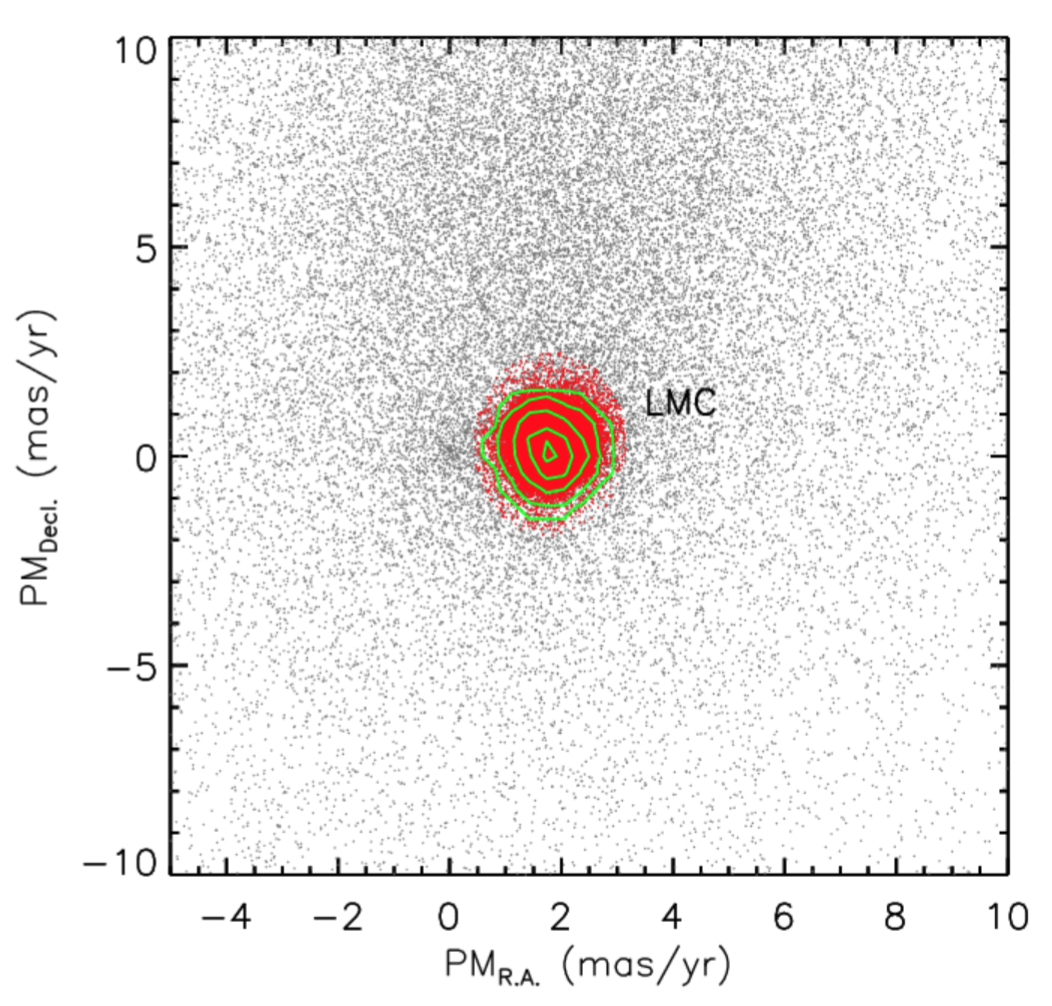
Figure 2. PMR.A. versus PMDecl. diagram, in which the selected LMC members (red) are clearly shown as a cluster. 

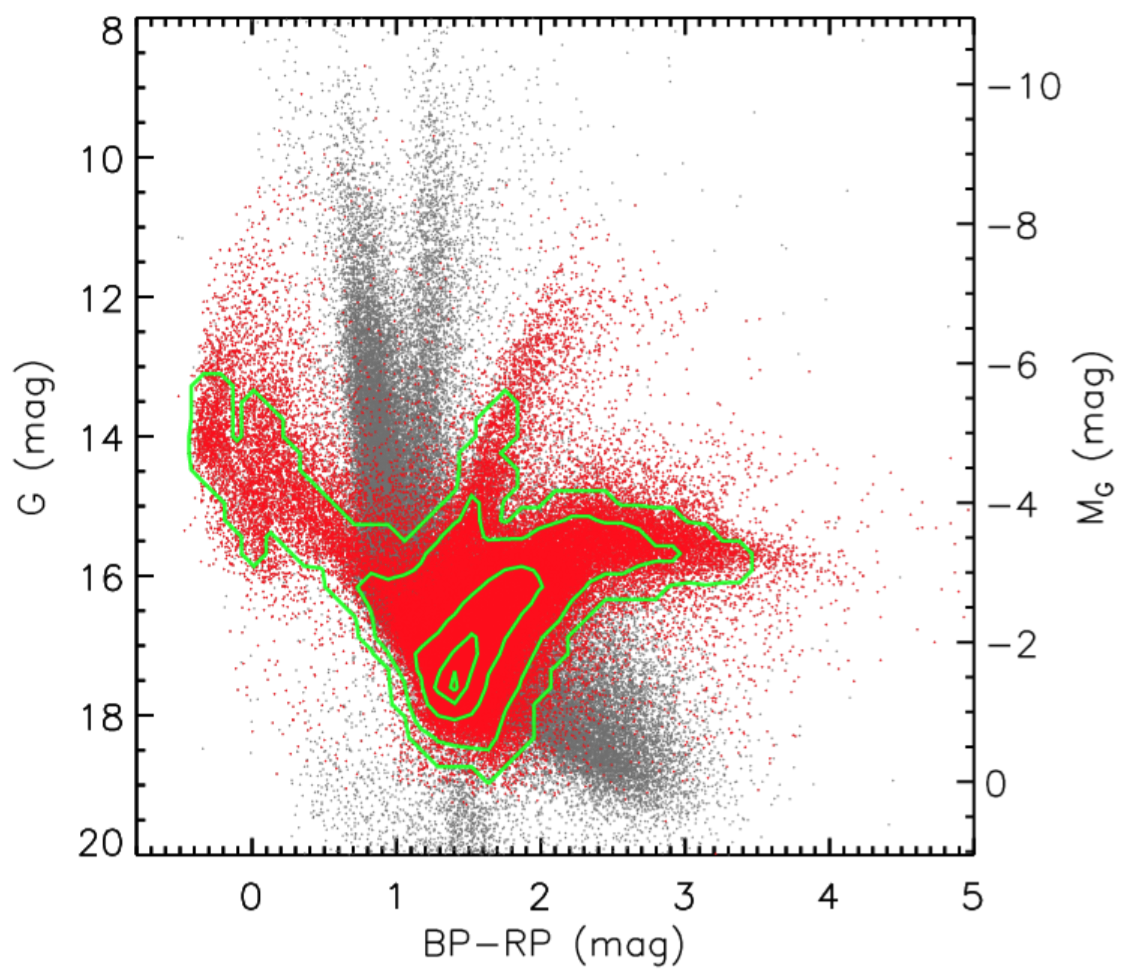
Figure 3. Diagram showing G vs. BP − RP for the Gaia data in the LMC before (gray) and after (red) the astrometric constraints, where the large number of foreground contamination is swept out.

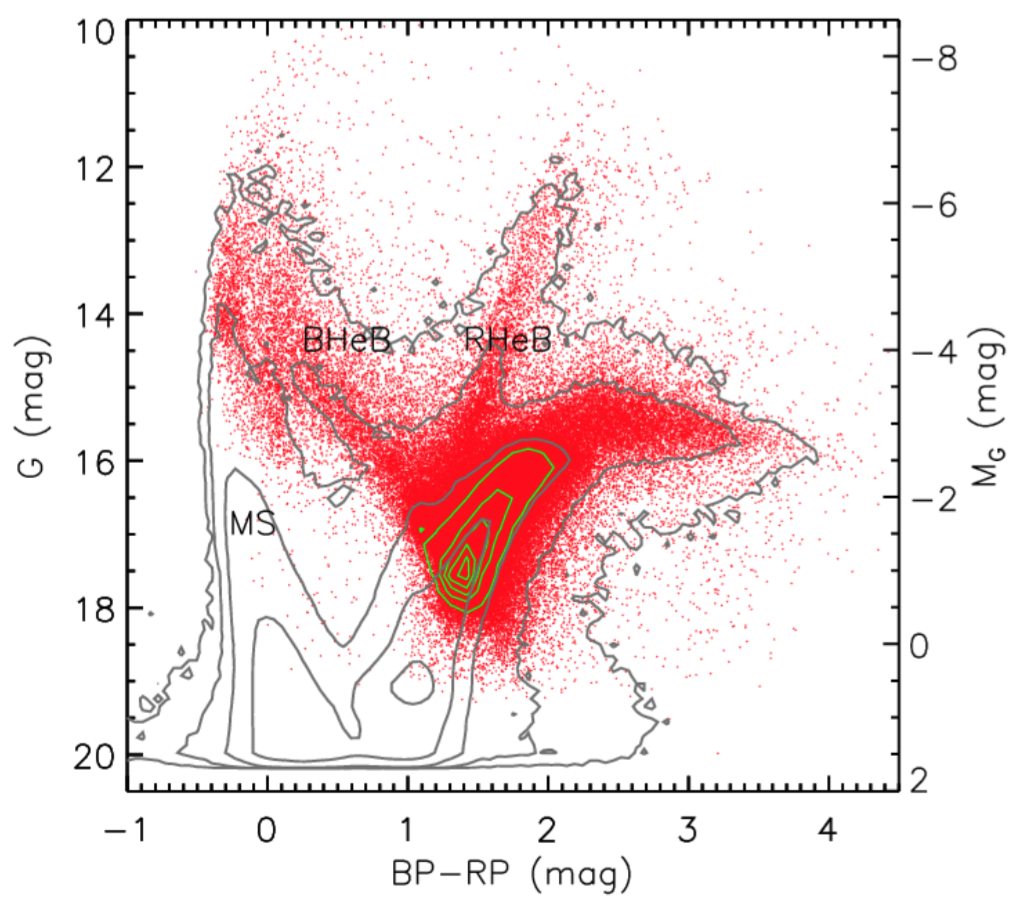
Figure 4. Comparison of Gaia CMDs between our sample and LMC sample from Gaia Collaboration (2018). The approximate positions of MSs, BHeBs, and RHeBs for the sample of Gaia Collaboration (2018) are indicated. 

The LMC and SMC Source Catalogs

Figure 5. Example of normalized transmission curves of filters (convolved with the instrument/telescope sensitivities) used in the SMC source catalog.  

Figure 6. Histograms of magnitude distribution in each dataset for the SMC source catalog. 

We retrieved additional photometric data (deblended with a search radius of 3′′) by using a search radius of 1′′ from different dataset ranging from the ultraviolet (UV) to far-infrared (FIR), e.g., from VISTA survey of the Magellanic Clouds system (VMC) DR4, IRSF Magellanic Clouds point source catalog (MCPS), the AKARI Magellanic Clouds point source catalog, HERschel Inventory of the Agents of Galaxy Evolution (HERITAGE) band-merged source catalog, SkyMapper DR1.1, NOAO source catalog (NSC) DR1, a UBVR CCD survey of the MCs by Massey (M2002), Optical Gravitational Lensing Experiment (OGLE) Shallow Survey in the LMC, GALEX source catalog for the All-Sky Imaging Survey (GUVcat_AIS). In total, there are 52 filters including two UV, 21 optical, and 29 IR filters for the LMC, and 50 filters including two UV, 19 optical, and 29 IR filters for the SMC (excluded the OGLE data), respectively. Figure 5 and 6 shows the transmission curves and histograms of magnitude distribution for each dataset. The spatial distributions of the additional optical (left) and IR (right) datasets are shown in Figure 7. Moreover, for the SMC, we also retrieved infrared and optical variability statistics derived from WISE, SAGE-Var, VMC, IRSF, Gaia, NSC, and OGLE as shown in Figure 8 (See more details in Yang et al. 2019).

Figure 7. Spatial distribution of the additional optical (left) and IR (right) datasets in the LMC (upper) and SMC (bottom). 

Figure 8. Spatial distribution of targets with IR (upper) and optical (bottom) variability statistics matched with our SMC source catalog within 1′′. Upper: targets from SAGE-Var, VMC DR4, and IRSF. Bottom: targets from Gaia, NSC, and OGLE. 

Evolved Massive Star Populations

Figure 9. Examples of color-magnitude diagrams of different datasets in the SMC. In each diagram, left panel: CMD overlapped with MIST evolutionary tracks of 7, 9, 12, 15, 20, 25, 32 and 40 M⊙ and color-coded as BSG (blue), YSG (yellow), and RSG (red) phases. Right panel: selected targets for each type of massive stars with the same color convention. The RSG region is empirically extended as shown by the horizontal dashed lines. The last diagram shows the theorectial color cuts from CB method to identify RSG and AGB populations in the 2MASS CMD.

Figure 10. Color-magnitude diagrams of  Gaia (left) and 2MASS (right) in the LMC (upper) and SMC (bottom) with RSG (red), YSG (yellow), and BSG (blue) candidates overlapping, where the colors are coded from dark (Rank 0) to light (Rank 5) based on the ranks. 

We utilized the evolutionary tracks and synthetic photometry from Modules for Experiments in Stellar Astrophysics (MESA) Isochrones & Stellar Tracks (MIST), which covers a wide range of ages, masses, and metallicities using solar-scaled abundance under a single computational framework to identify evolved massive star candidates on the CMDs of our multiwavelength source catalogs. The canonical values of 18.493 and 18.95 were used as the distance moduli of the LMC and SMC, respectively. For the SMC, we adopted the chemical composition of -1.0 to -0.7 dex for [Fe/H]. The nonrotation and rotation (V/Vcrit=0.40) models of 7 to 40 M⊙ were computed with no extinction and extinction of AV=1.0 mag, respectively. We chose the color-magnitude combinations based on the available synthetic photometry in MIST with relative percentage >90% at longer wavelengths (some dusty massive stars might not be identified in the shorter wavelengths due to higher extinction and reddening). The Yellow Void between blue supergiant stars (BSGs) and RSGs were also clearly shown in those models in order to identify YSGs as shown in Figure 9. Moreover, we also used theoretical cuts from from Cioni et al. (2006) and Boyer et al. (2011) (hereafter CB method) to classify RSGs and asymptotic giant branch stars (AGBs) in the NIR regime. For the LMC, however, we decided to use modified color and magnitude cuts based on the results of the SMC, due to a problem (the equivalent evolutionary phases do not properly fit the CMDs) with the models at LMC metallicity from MIST. Afterwards, we ranked (Rank 0 to 5) the candidates based on the intersection between different CMDs as shown in the Figure 10, where Rank 0 indicated that a target was identified as the same type of evolved massive star in all datasets and so on. In total, we identified 2,974 RSG, 508 YSG, and 4,786 BSG candidates in the LMC, and 1,405 RSG, 217 YSG, and 1, 369 BSG candidates in the SMC, respectively. The comparison between the source catalogs of the LMC and SMC indicates that the most distinct difference between these two galaxies appears at the bright red end of the optical and NIR CMDs, where the cool evolved stars are located. The LMC targets are redder than the SMC ones, which is likely due to the effect of metallicity and SFH. Meanwhile, there is essentially no difference for the BSG candidates. Moreover, the RSG is well separated from the AGB population even at faint magnitude, making RSGs a unique population connecting the evolved massive and intermediate stars, since stars with initial mass around 6 to 8 M⊙ are thought to go through a second dredge-up to become AGB stars. 

Figure 11. Comparison of all targets in the LMC (black) and SMC (gray) in multiple CMDs. Massive star candidates are color coded in blue (BSGs), yellow (YSGs), and red (RSGs), with dark and light colors indicating targets from the LMC and SMC, respectively. There is a prominent difference at the bright red end (RSG population) of the optical and NIR CMDs; this is illustrated by LMC targets which are shown in a redder color than the SMC ones. Meanwhile, this trend is reversed in the MIRAC2 versus IRAC1 – IRAC2 diagram with the LMC targets in a bluer color. 

Figure 12. Teff of massive star populations derived from reddening-free color of (J − KS)0. The Teff ranges are 3500 < Teff < 5000K for the RSG population, 5000 < Teff < 8000 K for the YSG population, and Teff > 8000K for the BSG population.

Figure 13. The populations of RSGs, AGBs, RGBs, and the TRGB are indicated on the zoomed-in regions of Gaia (upper left), SkyMapper (upperright), NSC(bottomleft), and 2MASS(bottom right). It can be seen that the separation between the RSG and AGB populations is relatively clear, even at faint magnitude. 

Red Supergiant Stars in the SMC

Figure 14. Color-magnitude diagrams of Gaia and 2MASS datasets in the SMC. Targets from the SMC source catalog are shown as gray dots. The valid RSG candidates are shown as solid circles and are color-coded ranging from Rank -1 to 3. Three Rank 4 spectroscopic RSGs are shown as open triangles, while the other three Rank 4 CMD RSG candidates are shown as open stars. Two unselected spectroscopic RSGs are shown as open squares. The rest of Rank 4 and 5 targets from the main RSG sample are shown as open circles. 

The most comprehensive RSG sample for the SMC to date was also constructed, including 1,239 RSG candidates. The initial sample was derived based on our source catalog for the SMC with conservative ranking. Additional spectroscopic RSGs were retrieved from the literature, and RSG candidates were selected based on the inspection of Gaia and 2MASS CMDs. We estimate that there are in total ~1800 or more RSGs in the SMC. We purify the sample by studying the infrared CMDs and the variability of the objects, though there is still an ambiguity between AGBs and RSGs at the red end of our sample. The investigation of color-color diagrams shows that there are fewer RSGs candidates (~4%) showing PAH emission features compared to the Milky Way and LMC (~15%). The degeneracy of mass loss rate (MLR), variability, and luminosity of the RSG sample is discussed, indicating that most of the targets with high variability are also the bright ones with high MLR. Some targets show excessive dust emission, which may be related to previous episodic mass loss events. We also roughly estimate the total gas and dust budget produced by entire RSG population as ~1.9×10⁻⁶ M⊙/yr in the most conservative case, according to the derived MLR from IRAC1-IRAC4 color. The Geneva evolutionary models are compared with our RSG sample, showing a good agreement and a lower initial mass limit of ~7 M⊙ for the RSG population. See more details in Yang et al. (2020).

Figure 15. KS vs. J-KS CMDs showing RSG and AGB candidates. Upper left: RSGs candidates are shown as solid circles. The O-AGB (pluses), C-AGB (crosses), x-AGB (asterisks), and RSG populations defined by theoretical J-KS color cuts are separated by K0, K1, K2, and KR lines (solid lines), respectively. The regions of BSG, YSG, and RSG populations defined by the MIST models are separated by the dashed lines. The optical and MIR spectroscopic RSGs are shown as open diamonds and open squares, respectively. The zoomed-out region is indicated by dash-doted lines. Upper right: zoomed-out region of 8.0 ≤ KS ≤ 12.0 mag and 0.8 ≤ J-KS ≤ 1.5 mag, where the distribution of the optical spectroscopic RSGs at the red end follows almost exactly the MIST tracks, but overlapped with O-AGB region defined by the theoretical cuts. Bottom left: same diagram as upper left, but with variable classifications from OGLE. Different types of variables are shown as different symbols. An overlapping of OSARGs, SRVs, and Miras can be seen in the lower half of the zoomed-out region. Bottom right: same zoomed-out region as upper right, where 24 C-OSARGs, 7 O-SRVs, and 3 O-Miras are optical spectroscopic RSGs (open diamonds). More interestingly, two O-Miras at the upper right are classified as both optical and MIR spectroscopic RSGs (open squares). 

Figure 16. IRAC4 vs. IRAC1-IRAC4 (left) and MIPS24 vs. MLR (right) diagrams color-coded with WISE1-band variability. The IRAC1-IRAC4 color is converted to the MLR by using a modified algorithm from Groenewegen & Sloan (2018), where the inset shows the comparison between the new (red solid line) and old (black dashed line) algorithms (x-axis is the IRAC1-IRAC4 color and y-axis is the MLR). The error bars show typical error of 0.35 dex. There is a linear relation (dashed line) between MIPS24 magnitude and MLR, while the dotted lines and dash-dotted lines indicate the 1σ and 3σ uncertainties, respectively. Some targets lying above the upper limit of 3σ may be related to episodic mass loss events during the RSGs phase. 

Figure 17. Left: Teff vs. reddening-free J-KS color ((J-KS )0) over the range of 3.57 ≤ LogTeff ≤ 4.35 and -0.16 ≤ (J-KS )0 ≤ 1.13 derived from the MIST models. A sixth-order polynomial fitting is shown as a dashed line, which works very well, except at the very red end. The inset shows the range of 3.5 ≤ Log Teff ≤ 3.8 and 0.4 ≤ (J-KS )0 ≤ 1.2, where a linear fitting is adopted shown as solid line instead of the polynomial fitting. Right: RSG sample (color-coded with WISE1-band variability) overlapped with color-coded non-rotation (solid lines) and rotation (V/VC = 0.40; dashed lines) Geneva evolutionary tracks of 7 to 40 M⊙ at Z = 0.002. The vast majority of targets selected by MIST model are following the Geneva tracks, and a few outliers can be explained by the combination of variability and reddening. Error bars show the typical errors of~0.017 dex in LogTeff and ~0.086 dex in Log(L/L⊙).