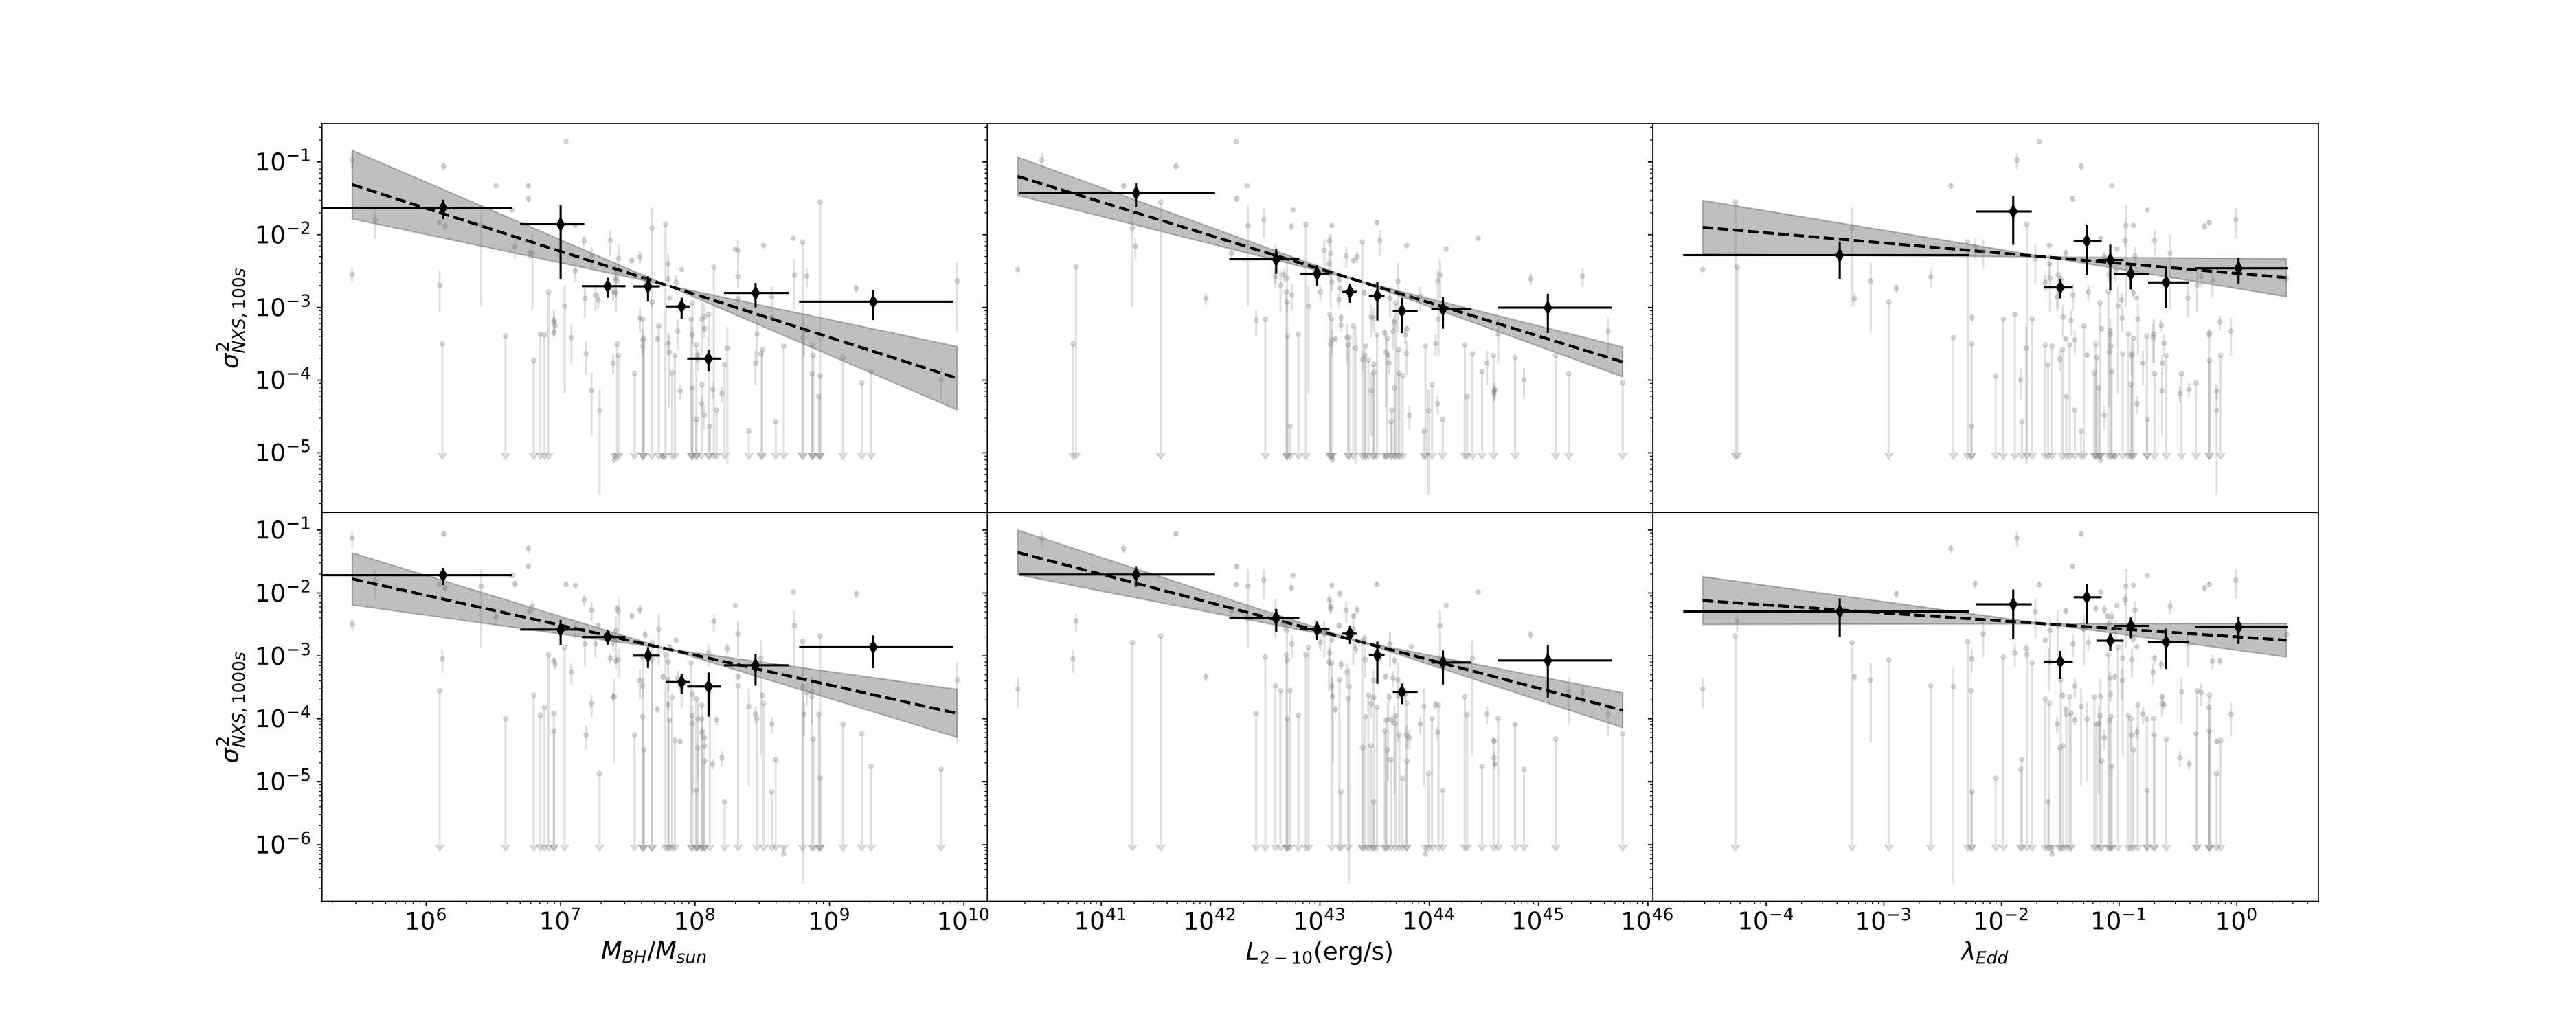
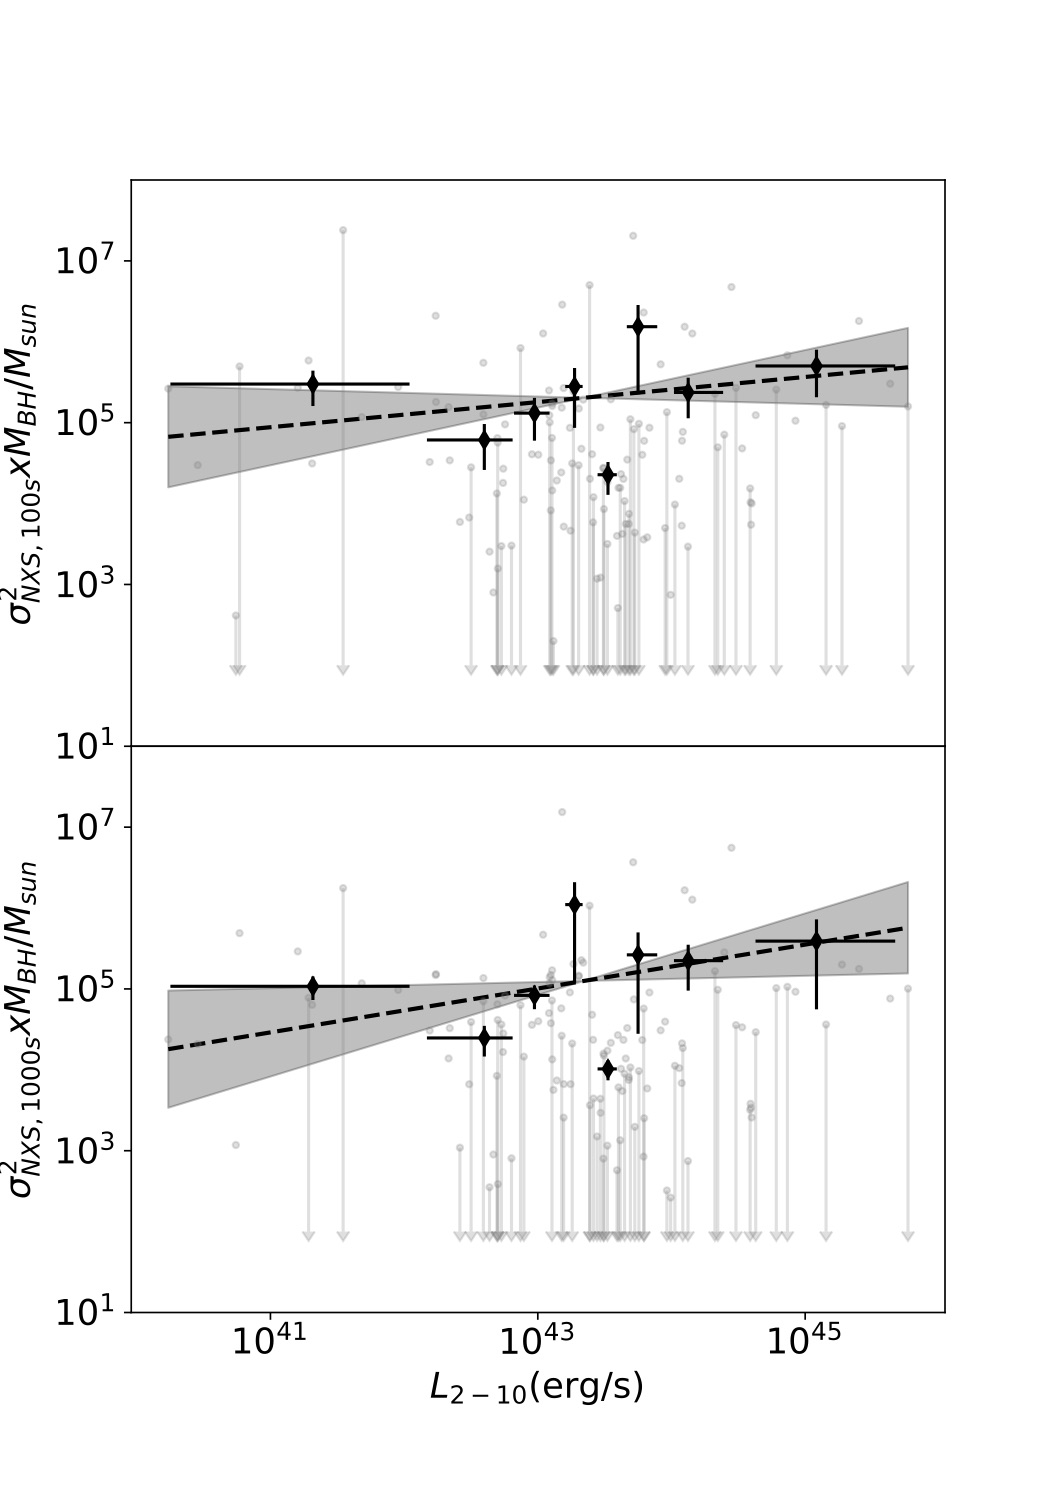
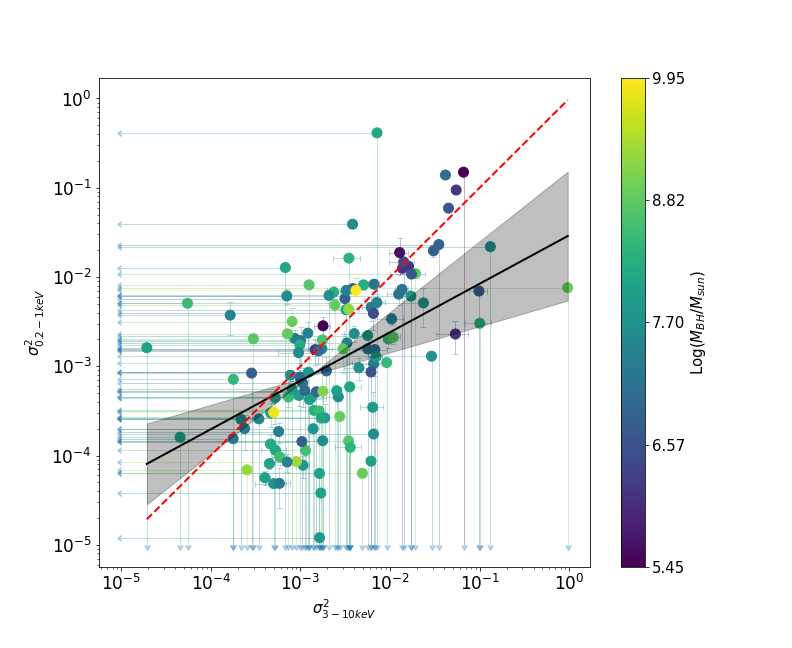
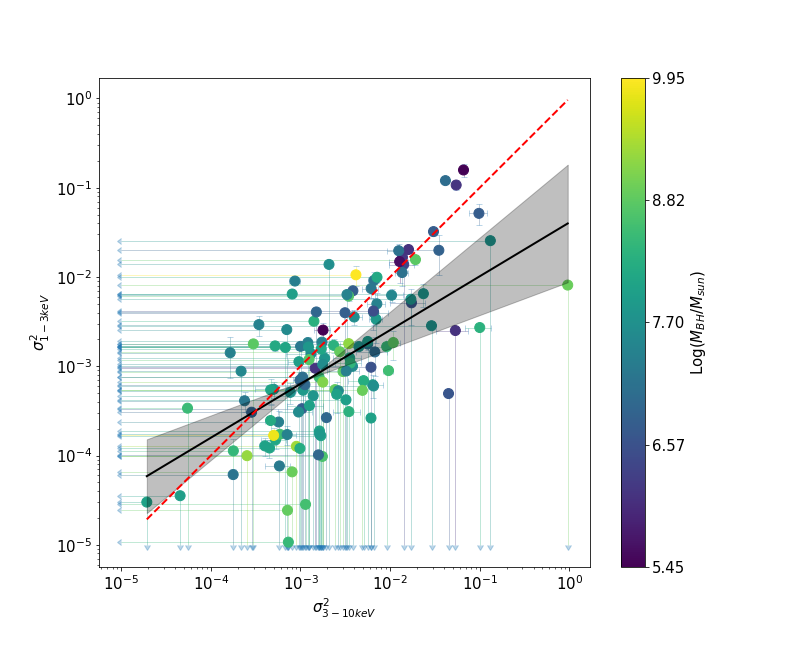
X-Ray light curves variability properties of the Sy1 BASS galaxies from XMM-Newton observations.

Alessia Tortosa 1

  • 1 Universidad Diego Portales, Santiago

Abstract

I will present an ongoing work about the analysis of the variability properties of X-ray light curves of the public XMM-Newton observations of the Seyfert 1 Galaxies belonging to the BAT AGN Spectroscopic Survey (BASS). This sample includes 385 observations of 154 Seyfert 1 galaxies.
It is known that the relationship between variability amplitude in AGN light curves and power spectrum is helpful for investigating the nature of the variability processes in these sources.
The aim of this work is to enlighten the relations between the common estimators of the variability amplitude (fractional variability and excess variance) in different energy bands with the physical and accretion properties of AGN such as the black hole masses of the central supermassive black hole (known for all the sources of the BASS survey from velocity dispersion and broad Balmer lines) and Eddington ratios (estimated combining the black hole masses measurements with the estimates of the bolometric luminosity derived from the BAT X-ray luminosity).

Normalised Excess Variance

\sqrt{\sigma^2_{\rm NXS}}=\sqrt{\frac{S^2-\sigma^2_{\rm mean}}{\overline{x_i}^2}}

The normalised excess variance2NXS, Vaughan et al., 2003) is a quantity used to describe the variability amplitude. It is defined as the difference between the total variance of the light curve, i.e. the integral of the power spectral density (PSD) between two frequencies (S2), and the mean squared error2mean) that is normalised for the average of the N flux measurements squared. 

Even if the normalised excess variance does not contain the same amount of information as the PSD analysis, it can be used to confirm the PSD results in large datasets and can also allow the discovery of new correlations between the X-ray variability amplitude and other AGN physical parameters.

The NXS and the AGN physical parameters

Figure 2: Left panel: σ2NXS vs. MBH; Middle panel: σ2NXS vs. L2−10; Right panel: σ2NXS vs. λEdd for the sample. Black circles with error bars correspond to the survival analysis (SA) results for each bin. The dashed black lines are the linear regressions obtained from the SA results while the shaded grey regions represent the combined 3-σ errors on the slopes and normalisations. The σ2NXS is obtained from the 0.2–10 keV light curves binned with 100 s (upper panels) and 1000 s (lower panels).

We studied the correlations between the σ2NXS and the AGN physical parameters, such as the black hole mass (MBH), the 2–10 keV luminosity (L2−10) and the Eddington ratio (λEdd)  ( Koss et al., 2017, Ricci et al., 2017, Koss et al., in prep). To this end we extrapolated the σ2NXS from the XMM-Newton broad-band (0.2–10 keV) light curves of all the observations of the sources in our sample using 10 ks-long light curves with a time bin of 100 s and 1000 s. For the sources with more than one observation we used the median value of the σ2NXS in both the cases of the light curves with 100 s and 1000 s time bin.

To check for correlations between the σ2NXS and some of the main AGN physical parameters we used the method of a linear model fit to the data in the log-log space. To include the contributions from the upper limits, we computed the median and the error of the normalized excess variance dividing the MBH, the L2−10 and λEdd into 8 bins. These bins are not symmetrical, since we requested each bin to have at least 15 values. We calculated the median and the error of the σ2NXS in each mass, luminosity and Eddington ratio bin using the survival analysis method (SA; e.g., Feigelson& Nelson 1985; Shimizu et al. 2017).  After this process we fitted the data obtained from the SA with the scripy.odr package.

While we do not find a correlation between the σ2NXS and the λEdd, we found, as expected from previous studies (Nandra et al. 1997; Papadakis 2004; O’Neill et al. 2005; Ponti et al. 2012), a strong anti-correlation between σ2NXS and MBH. We also found a strong anti-correlation between the σ2NXS and the L2−10.

Figure 3: Relations between the product of σ2NXS and black hole mass vs the 2--10 keV luminosity for the sample. Black circles with error bars correspond to the survival analysis (SA) results for each L2-10 bin. The dashed black lines are the linear regressions obtained from the the SA results while the shaded grey region represents the combined 3-σ error on the slope and normalisation. The σ2NXS is obtained from the 0.2-10 keV light curves binned with 100 s (upper panel) and 1000 s (lower panel)

The NXS in different energy bands

Figure 4: Soft (0.2–1 keV) vs hard (3–10 keV) σ2NXS. The best fit curve is plotted with a solid black line while the shaded grey region represents the combined 3-σ error on the slope and normalisation. The red dashed line represents the one-to-one relation.

Figure 5: Medium (1–3 keV) vs hard (3–10 keV) σ2NXS. The best fit curve is plotted with a solid black line while the shaded grey region represents the combined 3-σ error on the slope and normalisation. The red dashed line represents the one-to-one relation.

The X-ray spectrum of AGN in different energy bands is dominated by different components, i.e. the primary power-law component and the reflection component are dominant in the hard energy band (3–10 keV) while the warm-absorbers and the soft-excess are dominant in the soft (0.2–1 keV) and medium (1–3 keV) energy bands. We extrapolated the σ2NXS from the 0.2–1 keV (soft), 1–3 keV (medium) and 3–10 keV (hard) light curves to compare the σ2NXS in different energy bands. For the sources with more than one observation we used the median value of the σ2NXS in  each energy band.

The best-fitting relations, are obtained using the method of the ”censored fit” (Guainazzi et al. 2006; Bianchi et al. 2009), to account for upper limits. We performed a large number of least square fits on a set of Monte-Carlo simulated data derived from the experimental points. In this method each detection was substituted by a random Gaussian distribution, whose mean was the best-fit measurement and whose standard deviation was its statistical uncertainty and each upper limit U was substituted by a random uniform distribution in the interval [A,U], where A is an arbitrary value A<<U.

The σ2NXS in the soft and medium energy band appear to be well correlated with the σ2NXS in the hard energy band. We found a slope flatter than the one-to-one relation, implying that for most of our sources the spectral components which dominate in the soft and medium energy bands are less variable than the ones dominating in the hard energy band on time scales less than 10 ks. Thus at a first order, the variability of most of the sources of our sample is mostly due to the flux variation of the primary continuum and of the reflection component.

Type 1 BASS AGN

Figure 1: The distributions of the black hole masses (left panel), of the 2–10 keV luminosities (middle panel) and of the Eddington ratios (right panel) of the sources analysed in this work.

Our sample consists of the unobscured (NH<1022cm−2) local (zmean= 0.03) type 1 AGN belonging to the Swift/BAT AGN Spectroscopical Survey (BASS) with public XMM/Newton observations so far. The sample is composed by 128 sources for a total of 355 observations