Molecular gas content of two obscured AGN at the peak of galaxy evolution

Federica Ricci 1 , Marcella Brusa 1

  • 1 Alma Mater Unibo - Difa, Bologna

Abstract

The standard merger-driven galaxy evolutionary scenario for the formation of massive galaxies predicts a phase of deeply “buried” supermassive black hole growth coexisting with a starburst before feedback phenomena deplete the cold molecular gas reservoir of the galaxy and an optically luminous quasar (QSO) is revealed. Given the relevance of multi-phase outflow phenomena in AGN feedback models, constraining the gas content in high-z AGN with outflows detected in the ionised phase is an exciting hot topic in extragalactic astronomy.
We here present the results of ALMA observations of the CO(2-1) and CO(5-4) emissions in two X-ray selected obscured QSOs at z~1.5, hosted in massive galaxies (Mstar >~ 10^11 Msun). These two targets have remarkably different host galaxy properties, one being a starburst while the other being a normal MS galaxy, and are the most extreme and the best characterised in the ionised outflow component at such redshift.
Complementing the ALMA submm observations with optical rest frame data, we investigate whether the ionised wind has a counterpart in the molecular phase, and how the massive wind impact on the cold gas reservoir in these two obscured QSOs at the golden epoch of galaxy evolution.

Outflows in ionized phase

The study of the gas content and conditions (traced by its distribution and excitation) in AGN with outflows, and the relation between outflow episodes seen in various gas phases (ionized, molecular) need to be investigated over an increasingly large number of sources. 

The critical feedback phase is expected to be short and X-ray active (e.g. accretion on the BH is at its maximum), therefore large area X-ray surveys with high-quality multi-wavelength data provide the best tool to select these intrinsically rare sources. 

Targets properties:
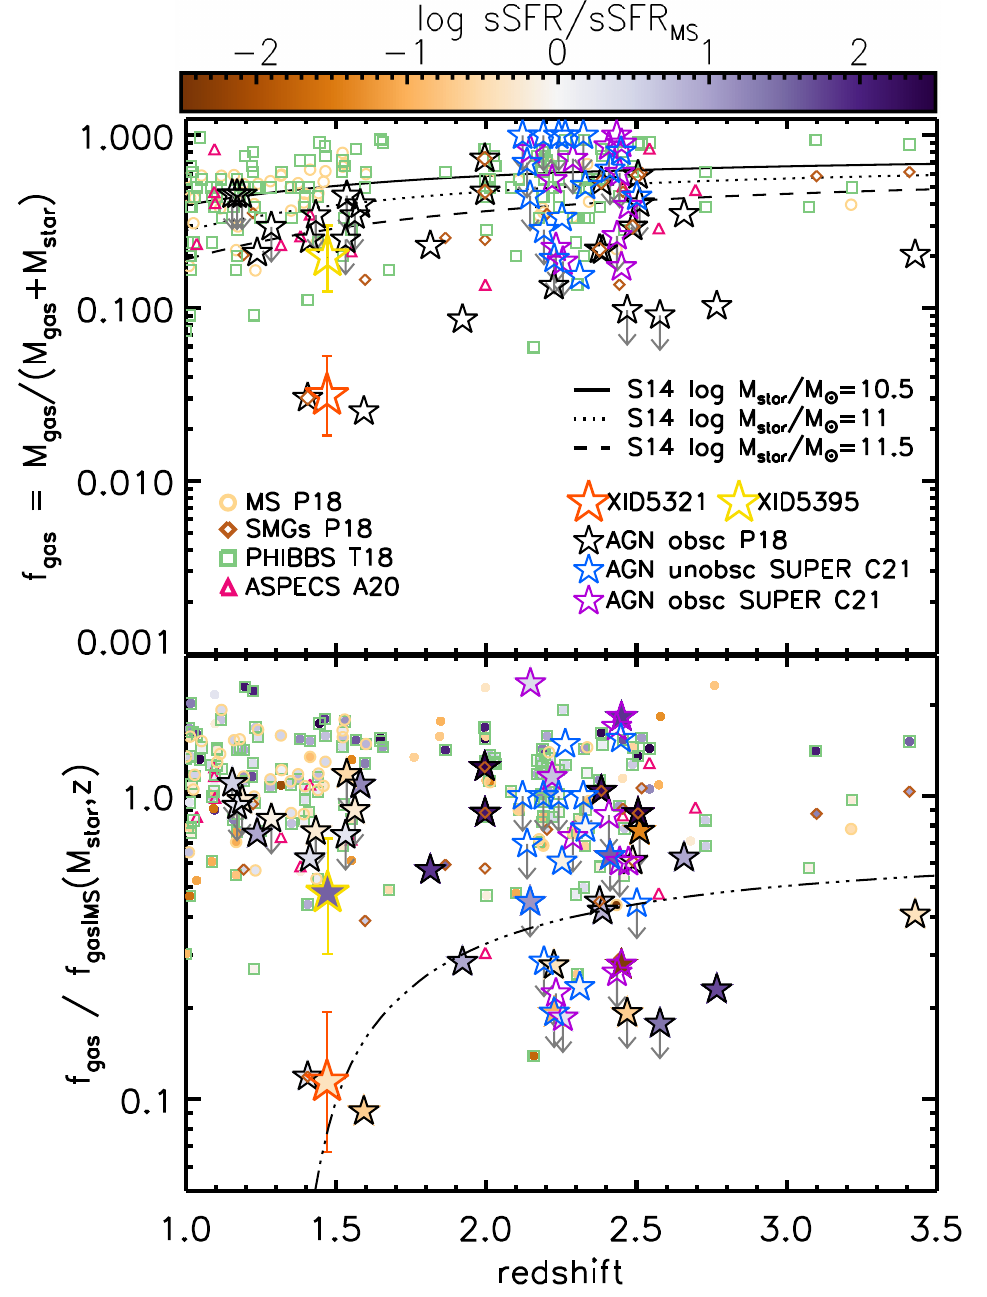
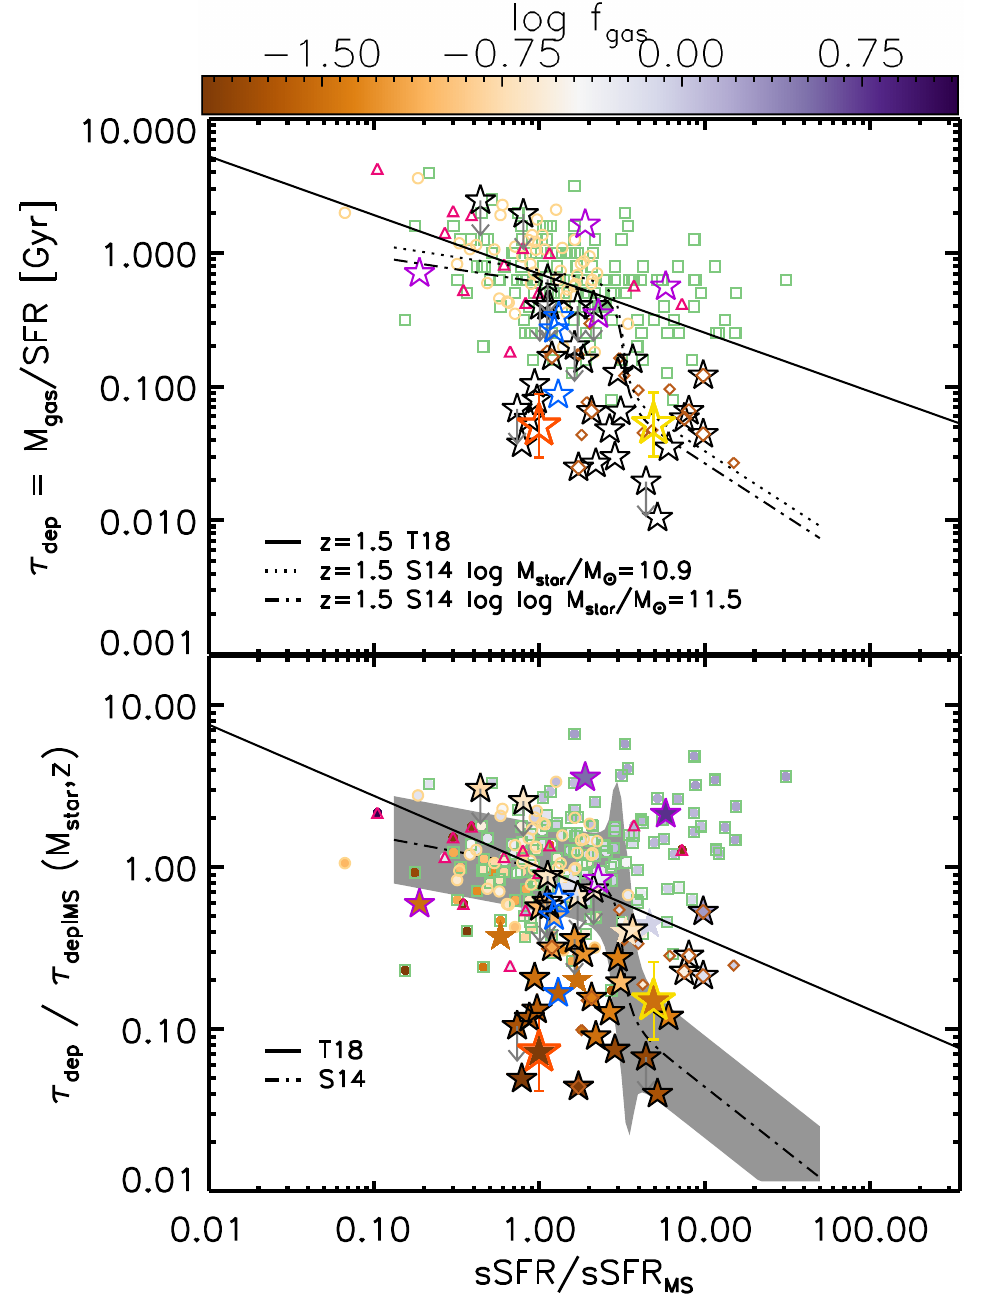
  • XID 5321 and XID 5395 are two such rare sources: these luminous (Lbol ~ 1046.5 erg/s) obscured QSOs have been selected from the XMM-COSMOS survey at the peak of galaxy evolution (z~1.5) according to the criteria proposed in Brusa et al. (2015, 2016) on the basis of their observed X-ray-to-optical-to-NIR colors.

  • the two quasars have remarkably different host galaxies properties, XID 5395 being classfied as a starburst (sSFR/sSFRMS=5), while XID 5321 is a Main Sequence (MS) galaxy, similar to XID 2028.

  • X-Shooter and VLT/SINFONI IFU observations (Perna et al. 2015, Brusa et al. 2016 see Fig. 1-2) reveal the presence of massive outflows in both blue- and red-shifted components, spatially displaced from the nuclear core ( v > 1000 km s-1, Rout ~ 5 kpc), suggesting the presence of wide opening angle winds

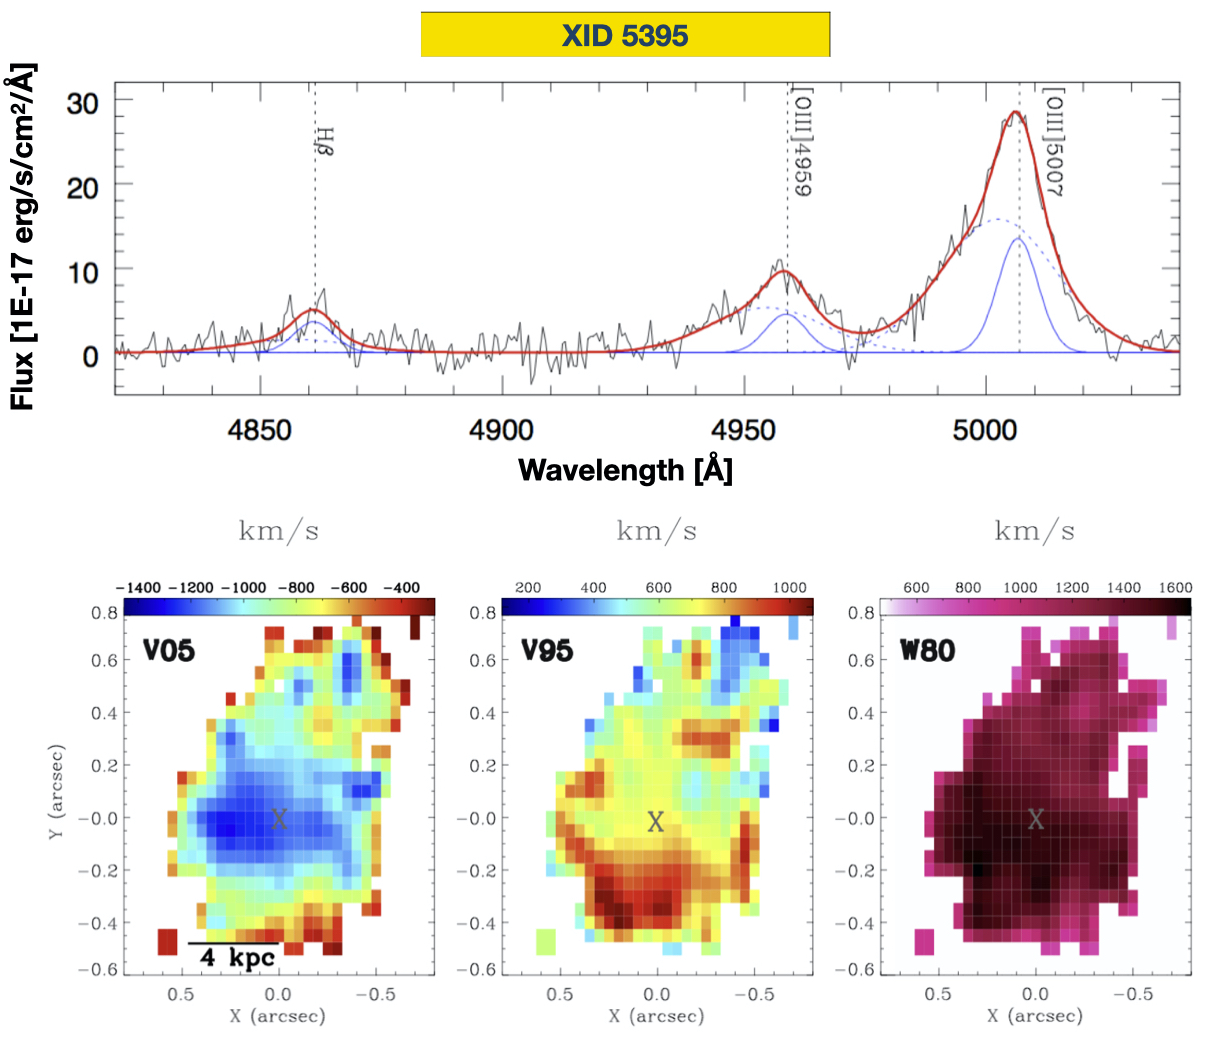
Figure 1: Outflows in the ionized [OIII] phase in XID5395. Top: SINFONI J-band spectrum extracted within an aperture of 1′′ diameter from the nucleus around the Hβ+[O III] emission lines region. Superimposed on the spectra are the best-fit components of the simultaneous, multicomponent fit (solid and dashed blue curves). The red solid curves represent the sum of all model components (adapted from Brusa et al. 2016). Bottom: [OIII]λ5007 maps across the field of view of maximum blueshifted velocity (v05), maximum redshifted velocity (v95), and line width (w80). Blue-(red) shifted velocities as high as Vmax,blue∼ −1400 km s−1(Vmax,red∼+1100 km s−1) are found at distances as high as 4 kpc from the centre (indicated with a cross). Adapted from Brusa et al. (2016).

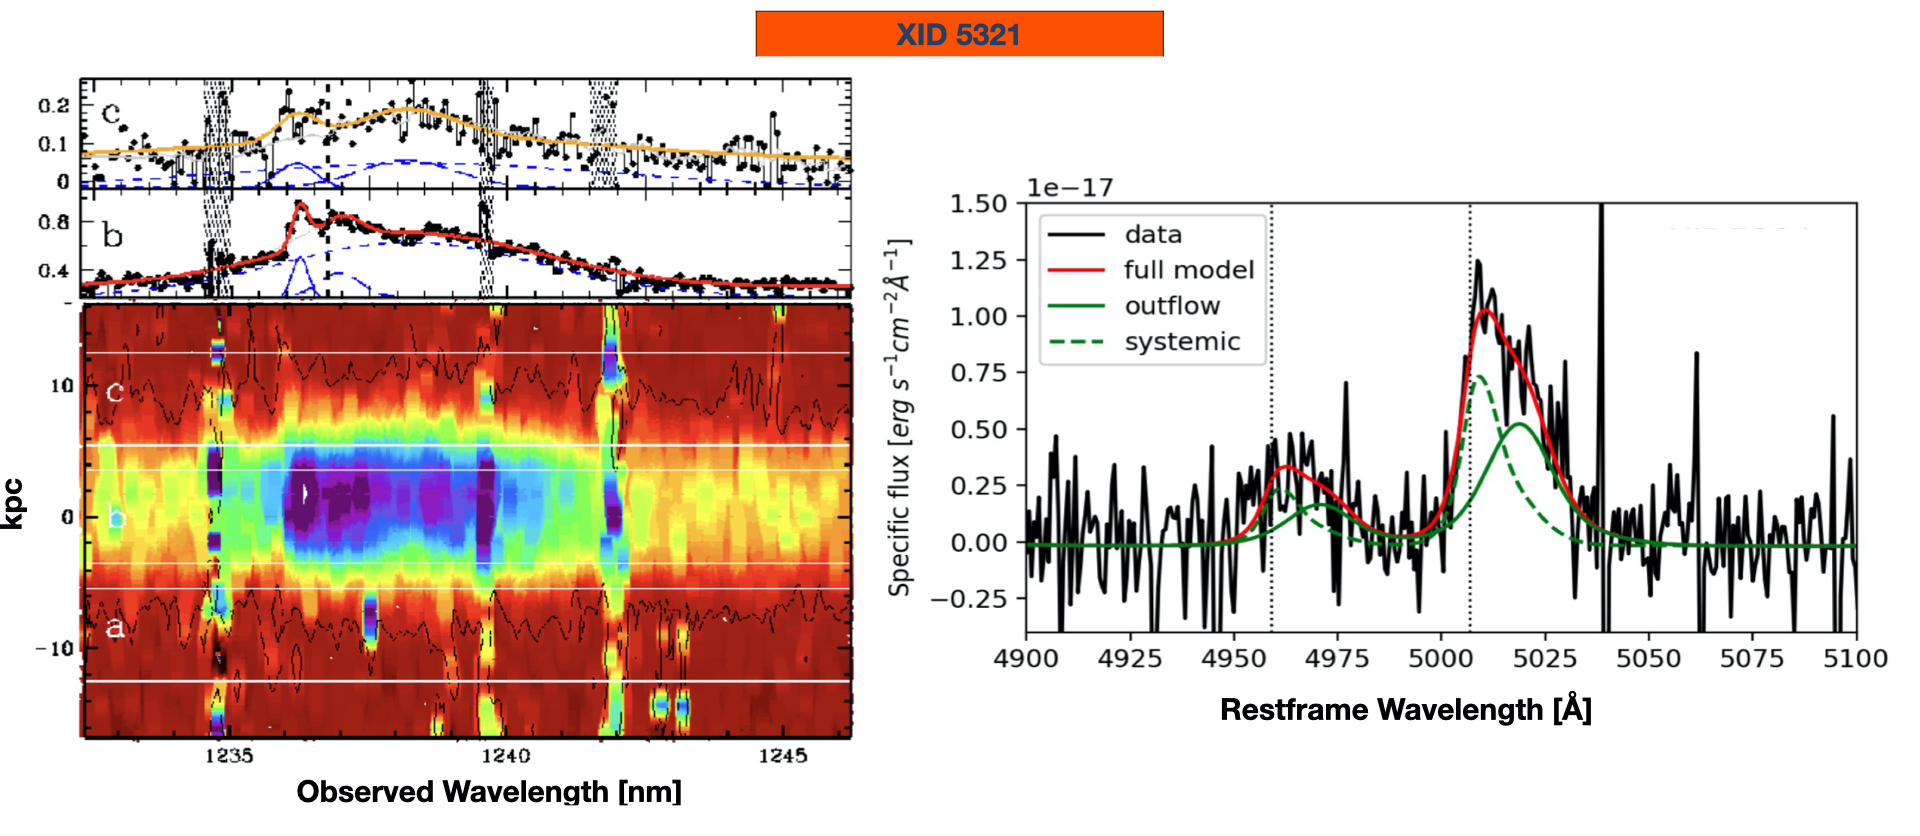
Figure 2: Outflows in the ionized [OIII]λ5007 phase in XID5321. Left: NIR slit-resolved spectroscopy analysis of the X-Shooter spectra (2D image, bottom). The nuclear and off-nuclear regions centered on [OIII]λ5007 are labeled b and c. The red and orange lines in the extracted 1D spectra (top) indicate the best fit solutions that reproduce the line profiles for the nuclear and off-nuclear cases, respectively. A prominent redshifted outflowing component is clearly detected in both regions, extending up to ~5 kpc. Adapted from Perna et al. (2015). Right: SINFONI spectrum showing the outflowing redshifted component in [OIII]λ4959,5007. (Ricci et al. in prep.)

ALMA CO observations

Table 1: Journal of ALMA observations in the CO(2-1) line (band 3) and CO(5-4) line (band 6) for the two targets XID 5321 and XID 5395.

Figure 3: XID 5321 ALMA CO(2-1) (cyan) and CO(5-4) (purple) spectra extracted from one beam. 

Figure 4: XID 5395 ALMA CO(2-1) (cyan) and CO(5-4) (purple) spectra extracted from one beam. 

Depleted molecular gas

Thanks to the ALMA CO observations, we estimate the the CO(2-1) line luminosity and, following the approach outlined in Brusa et al. (2018), we used two possible CO SLEDs to derive the L′CO(1−0). The two SLEDs differ of ~3 in the predicted L′CO(1−0). Since this systematics is higher than the statistical errors on the flux measurements (≲ 10%), the reported errors take into account this systematics only.

Then we converted L′CO(1−0) to molecular gas mass assuming an αCO=0.8 M (K km/s pc2)−1 (see Brusa et al. 2018).

Table 2: Targets derived properties

Combining the CO(2-1) based Mgas estimate with M* and SFR information (Table 2), we derive the molecular gas fraction fgas and depletion timescales τdep and we compare those with a collection of high redshift (z>1) AGN (Perna et al. 2018, Circosta et al. 2021) and galaxies (Perna et al. 2018, Tacconi et al. 2018, Aravena et al. 2020) samples with CO measurements from the literature, in order to examine their locations in the fgas-z (Fig. 5) and τdep-δMS (Fig. 6) planes.

  • Both XID 5321 and XID 5395 show evidence of depleted molecular gas in the fgas-z and τdep-δMS. They have low gas fraction (<20%) and low depletion timescales (~0.05 Gyr)
  • the deviation from the MS is particularly evident for XID 5321, that has one of the lowest fgas (and fgas/fgas|MS) and τdep at any z and sSFR/sSFRMS compared to the control samples of galaxies and other AGN from the litearture. This is a clear (indirect) evidence of the impact the outflow has on the host galaxy gas reservoir (see Kakkad et al. 2017, Perna et al. 2018). Indeed, its location is in agreement with the expectations from the 2-SFM model for a log M*=11 M galaxy hosting a massive outflows Mout=5x10⁵ M (Fig. 5 bottom panel, black dot-dashed curve).
  • XID 5395 is also deviating from the MS expectations, but its location seems in agreement with the prediction of the 2-SFM model (Sargent et al. 2014) given its δMS=5 (bottom panel Fig. 6). Its depleted molecular mass might be a combination of the effects of both the AGN outflow (detected in the ionized phase) and its starburst nature. 

The CO(5-4) kinematics is distrurbed and detailed characterisation is still ongoing. stay tuned ;) 

Figure 5: Top: Redshift evolution of the gas fraction fgas for the sample AGN in Perna et al. (2018), Circosta et al. (2021) (blue, black and purple stars, according to the X-ray obscuration and sample, see legend) and MS or SMGs galaxies from Perna et al. (2018, circles or diamonds), Tacconi et al. (2018, squares) and Aravena et al. (2020, triangles). The black lines are the expected redshift evolution from Sargent et al. (2014). The positions of XID 5321 and XID 5395 based on ALMA CO(2-1) observations are shown as red and yellow stars, highlighting the small molecular gas fraction compared to main sequence galaxies. Bottom: Redshift evolution of the gas fraction normalized to that expected from MS galaxies given the SFR-M*-z relation from Speagle et al. (2014). The black triple dot-dashed curve shows the redshift evolution expected in the 2-SFM model (Sargent et al. 2014) of the fgas/fgas|MS (M*,z) for a log M* = 11 M galaxy hosting an outflow of Mout = 5 x10⁵ M. The targets are color-coded according to the distance from the main sequence of SFGs, when available (see color bar at the top). (Ricci et al. in prep)

Figure 6: Top: Depletion timescales τdep as a function of the distance from the main sequence (sSFR/sSFRMS or δMS). Same symbols as Fig. 5. The black lines show the τdep − δMS relations from Tacconi et al. (2018) at z = 1.5, and the expectations from the 2-SFM model at z = 1.5 and with log M* = 10.9, 11.5 M. Bottom: Offset of depletion timescales with respect to expectations for galaxies on the MS (as calibrated from Tacconi et al. 2018), as a function of δMS. Black lines show the trends from Tacconi et al. (2018) and the 2-SFM model from Sargent et al. (2014), with scatter shaded grey. Points are color-coded according to the molecular gas fraction fgas. (Ricci et al. in prep)