Introduction
Urban air quality is an essential aspect of environmental monitoring, as atmospheric pollution is increasingly perceived to be responsible for substantial degradation of the quality of life, worldwide (World Health Organization, 2016, 2015). While atmospheric pollutants can have devasting effects on human health, documented effects are mostly attributable to long-term/continuous exposure, causing chronic and acute conditions such as cancer and cardiovascular malfunctions (World Health Organization, 2003; Cede et al., 2006; Bechle, Millet and Marshall, 2013; Cersosimo, Serio and Masiello, 2020a; Tack et al., 2021a).
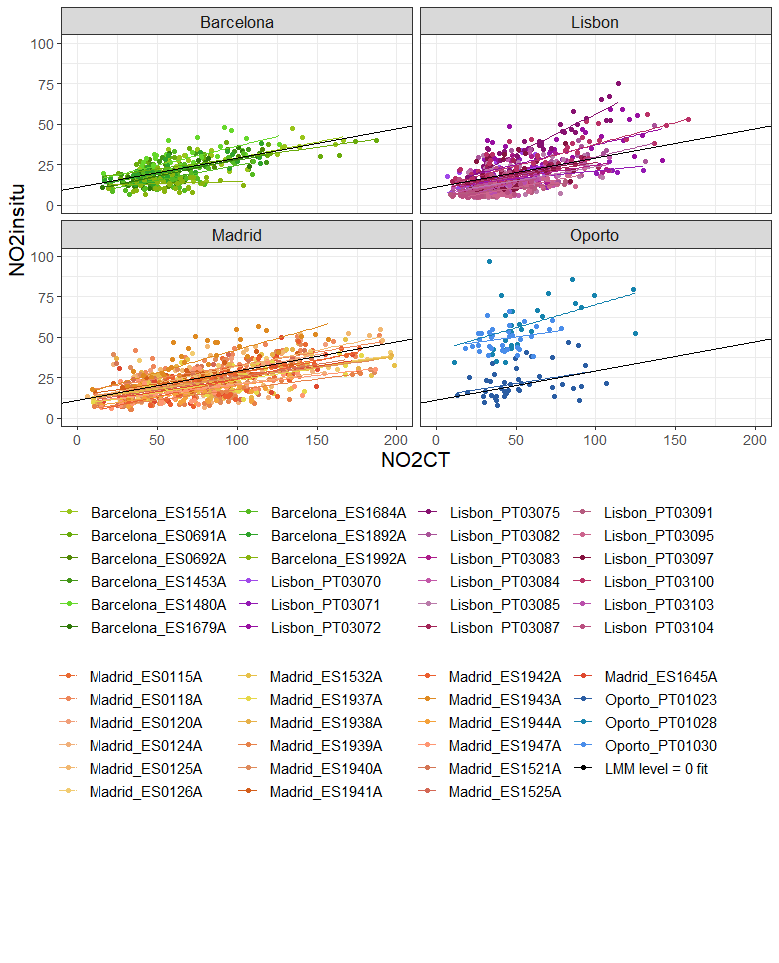
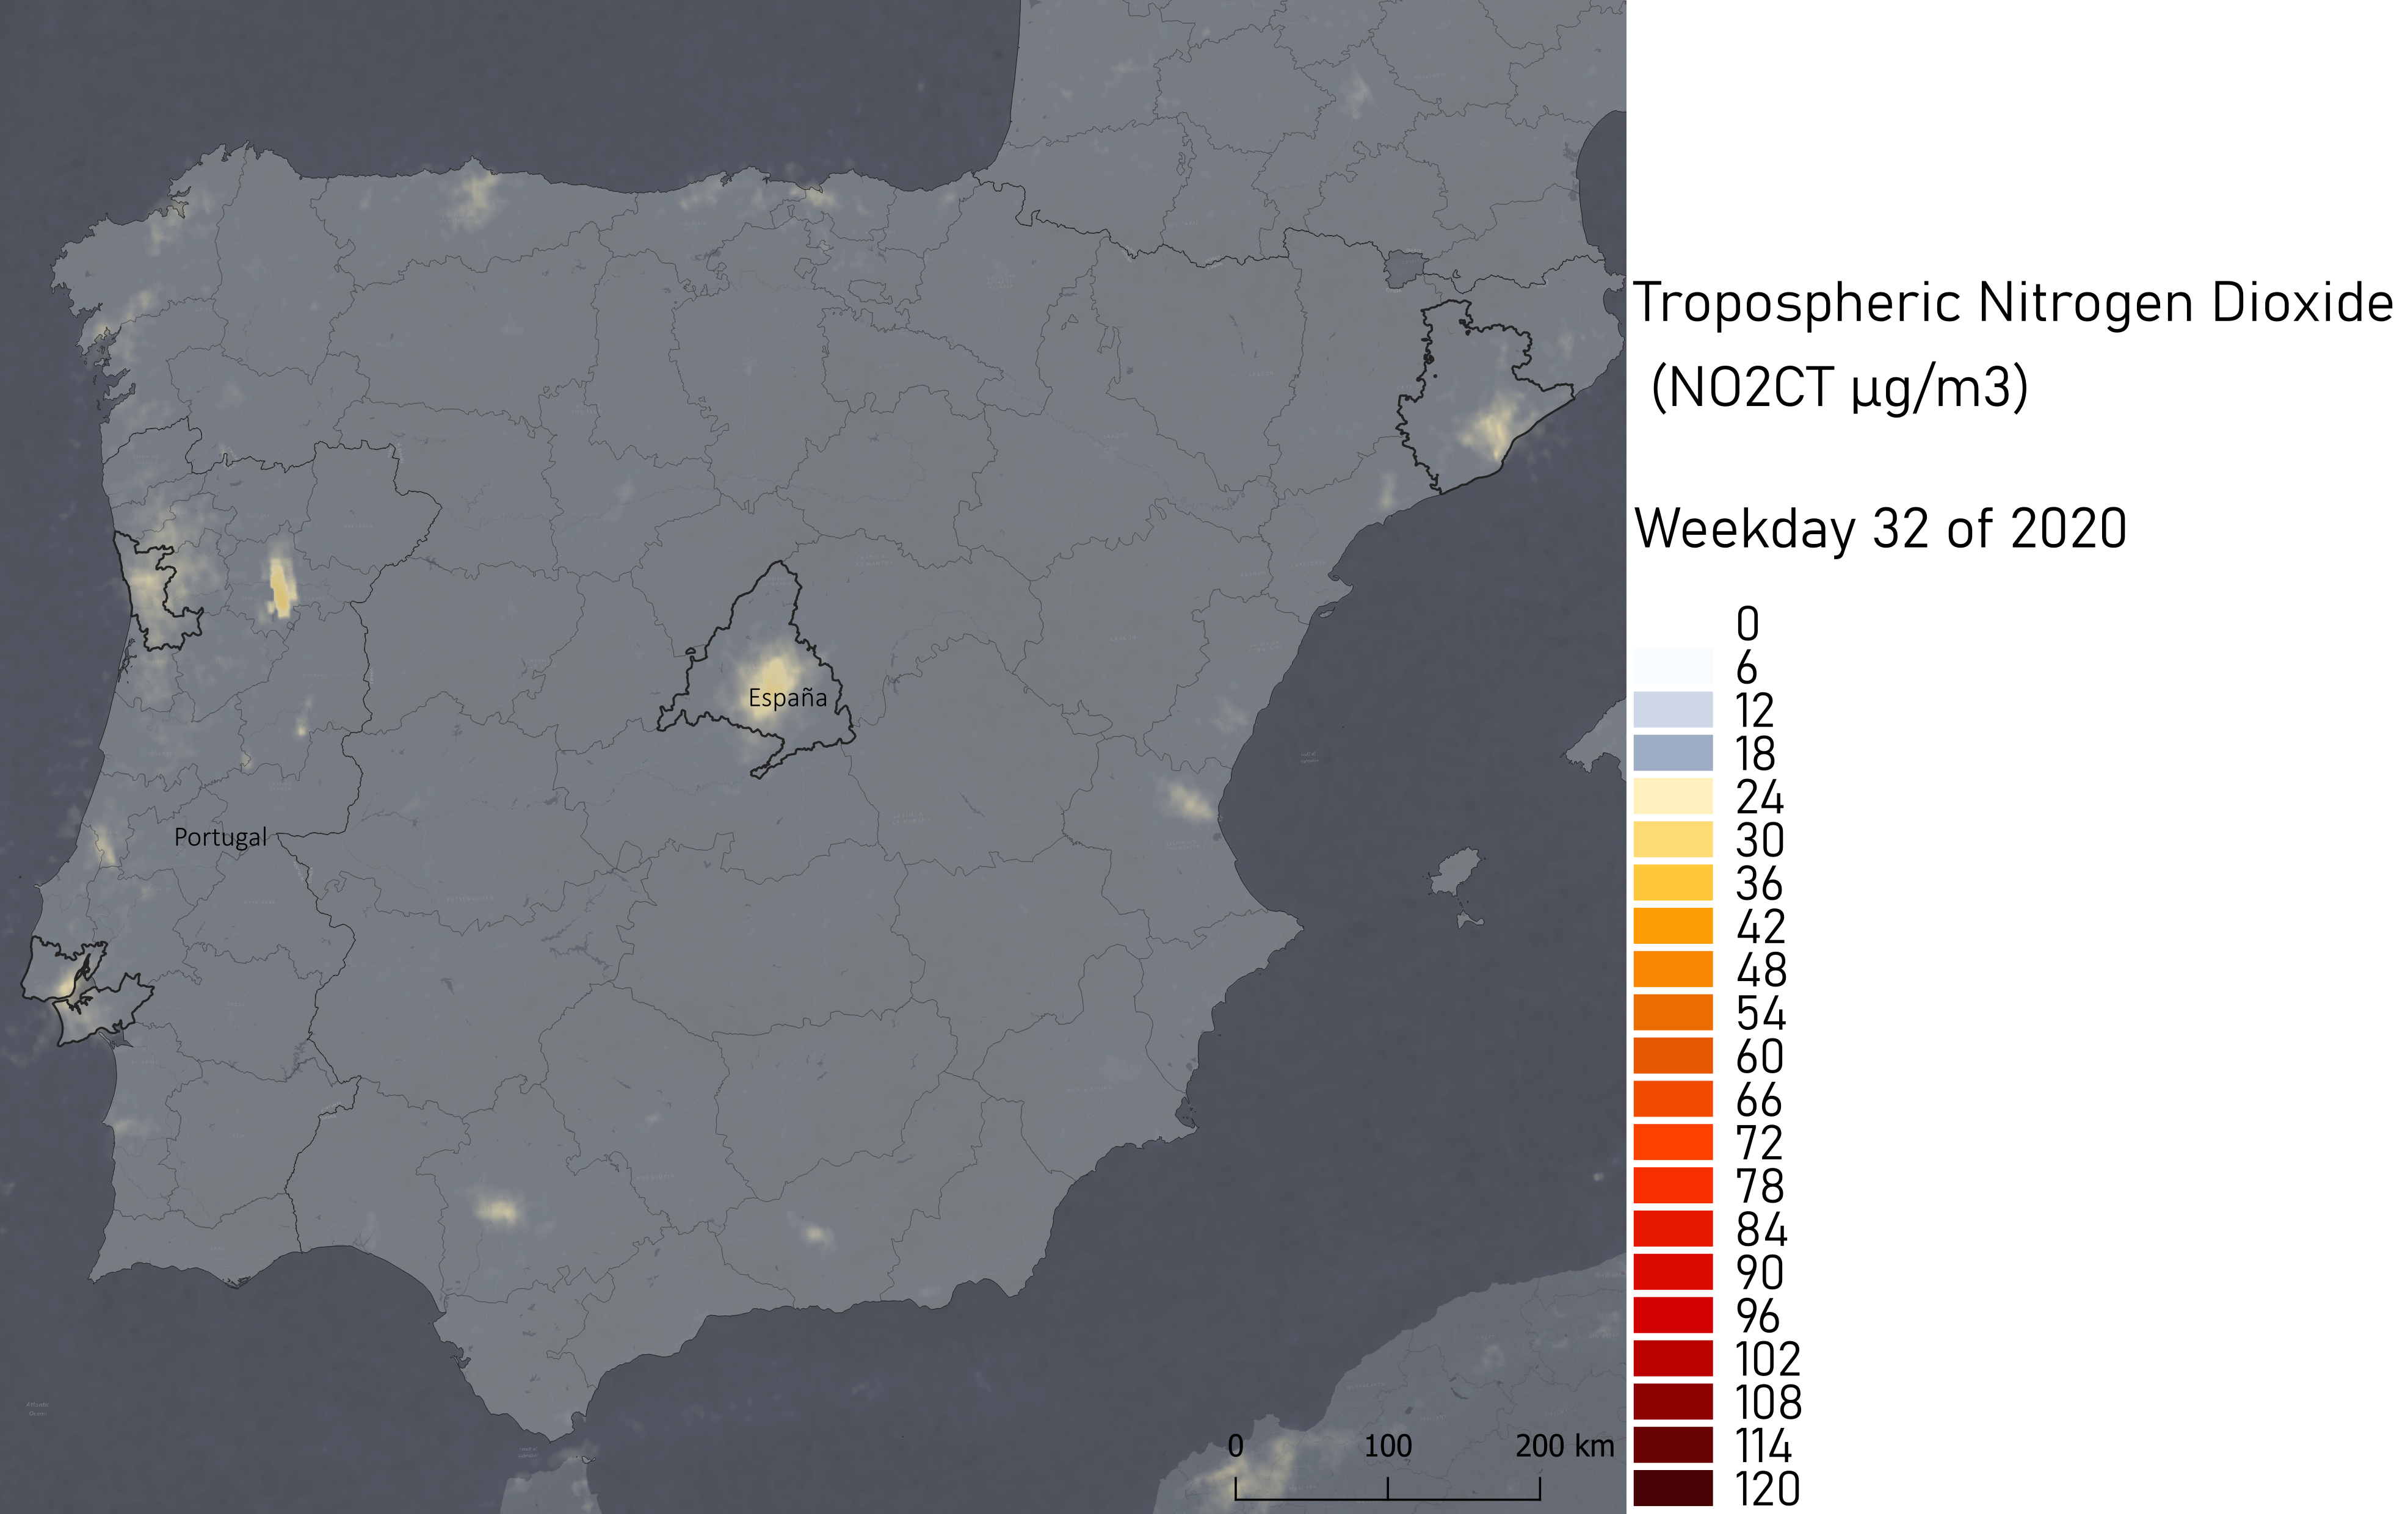
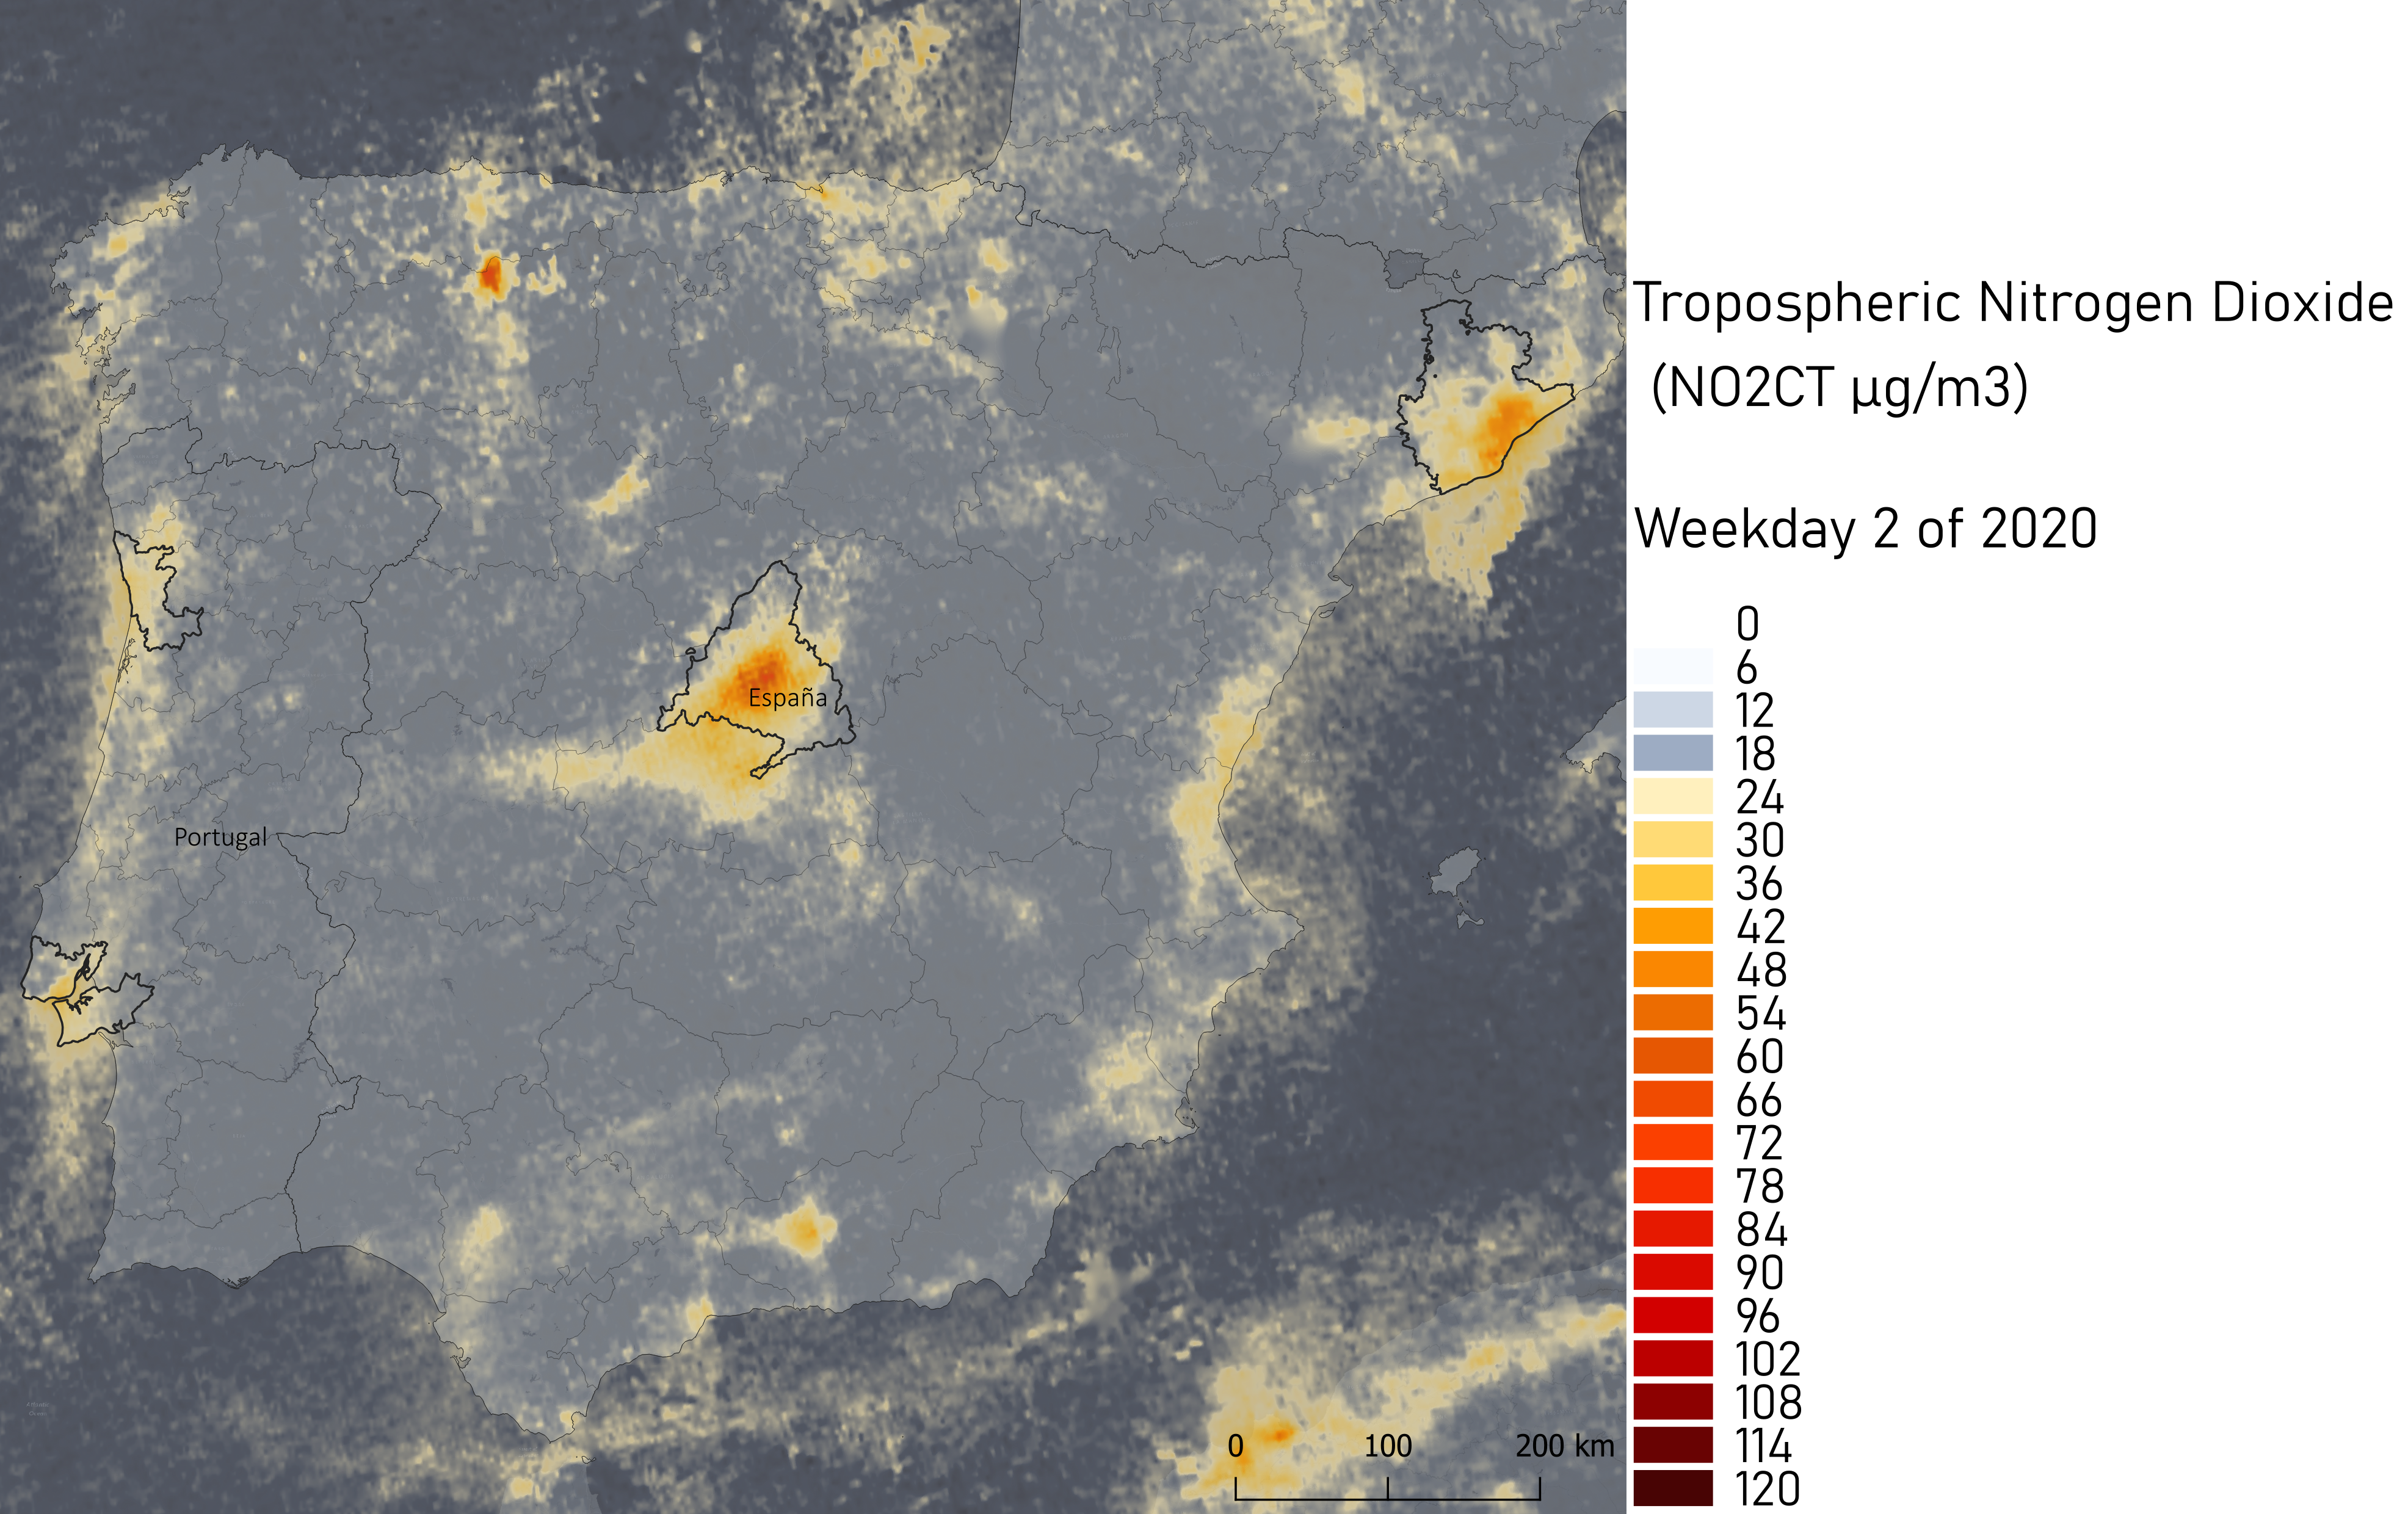
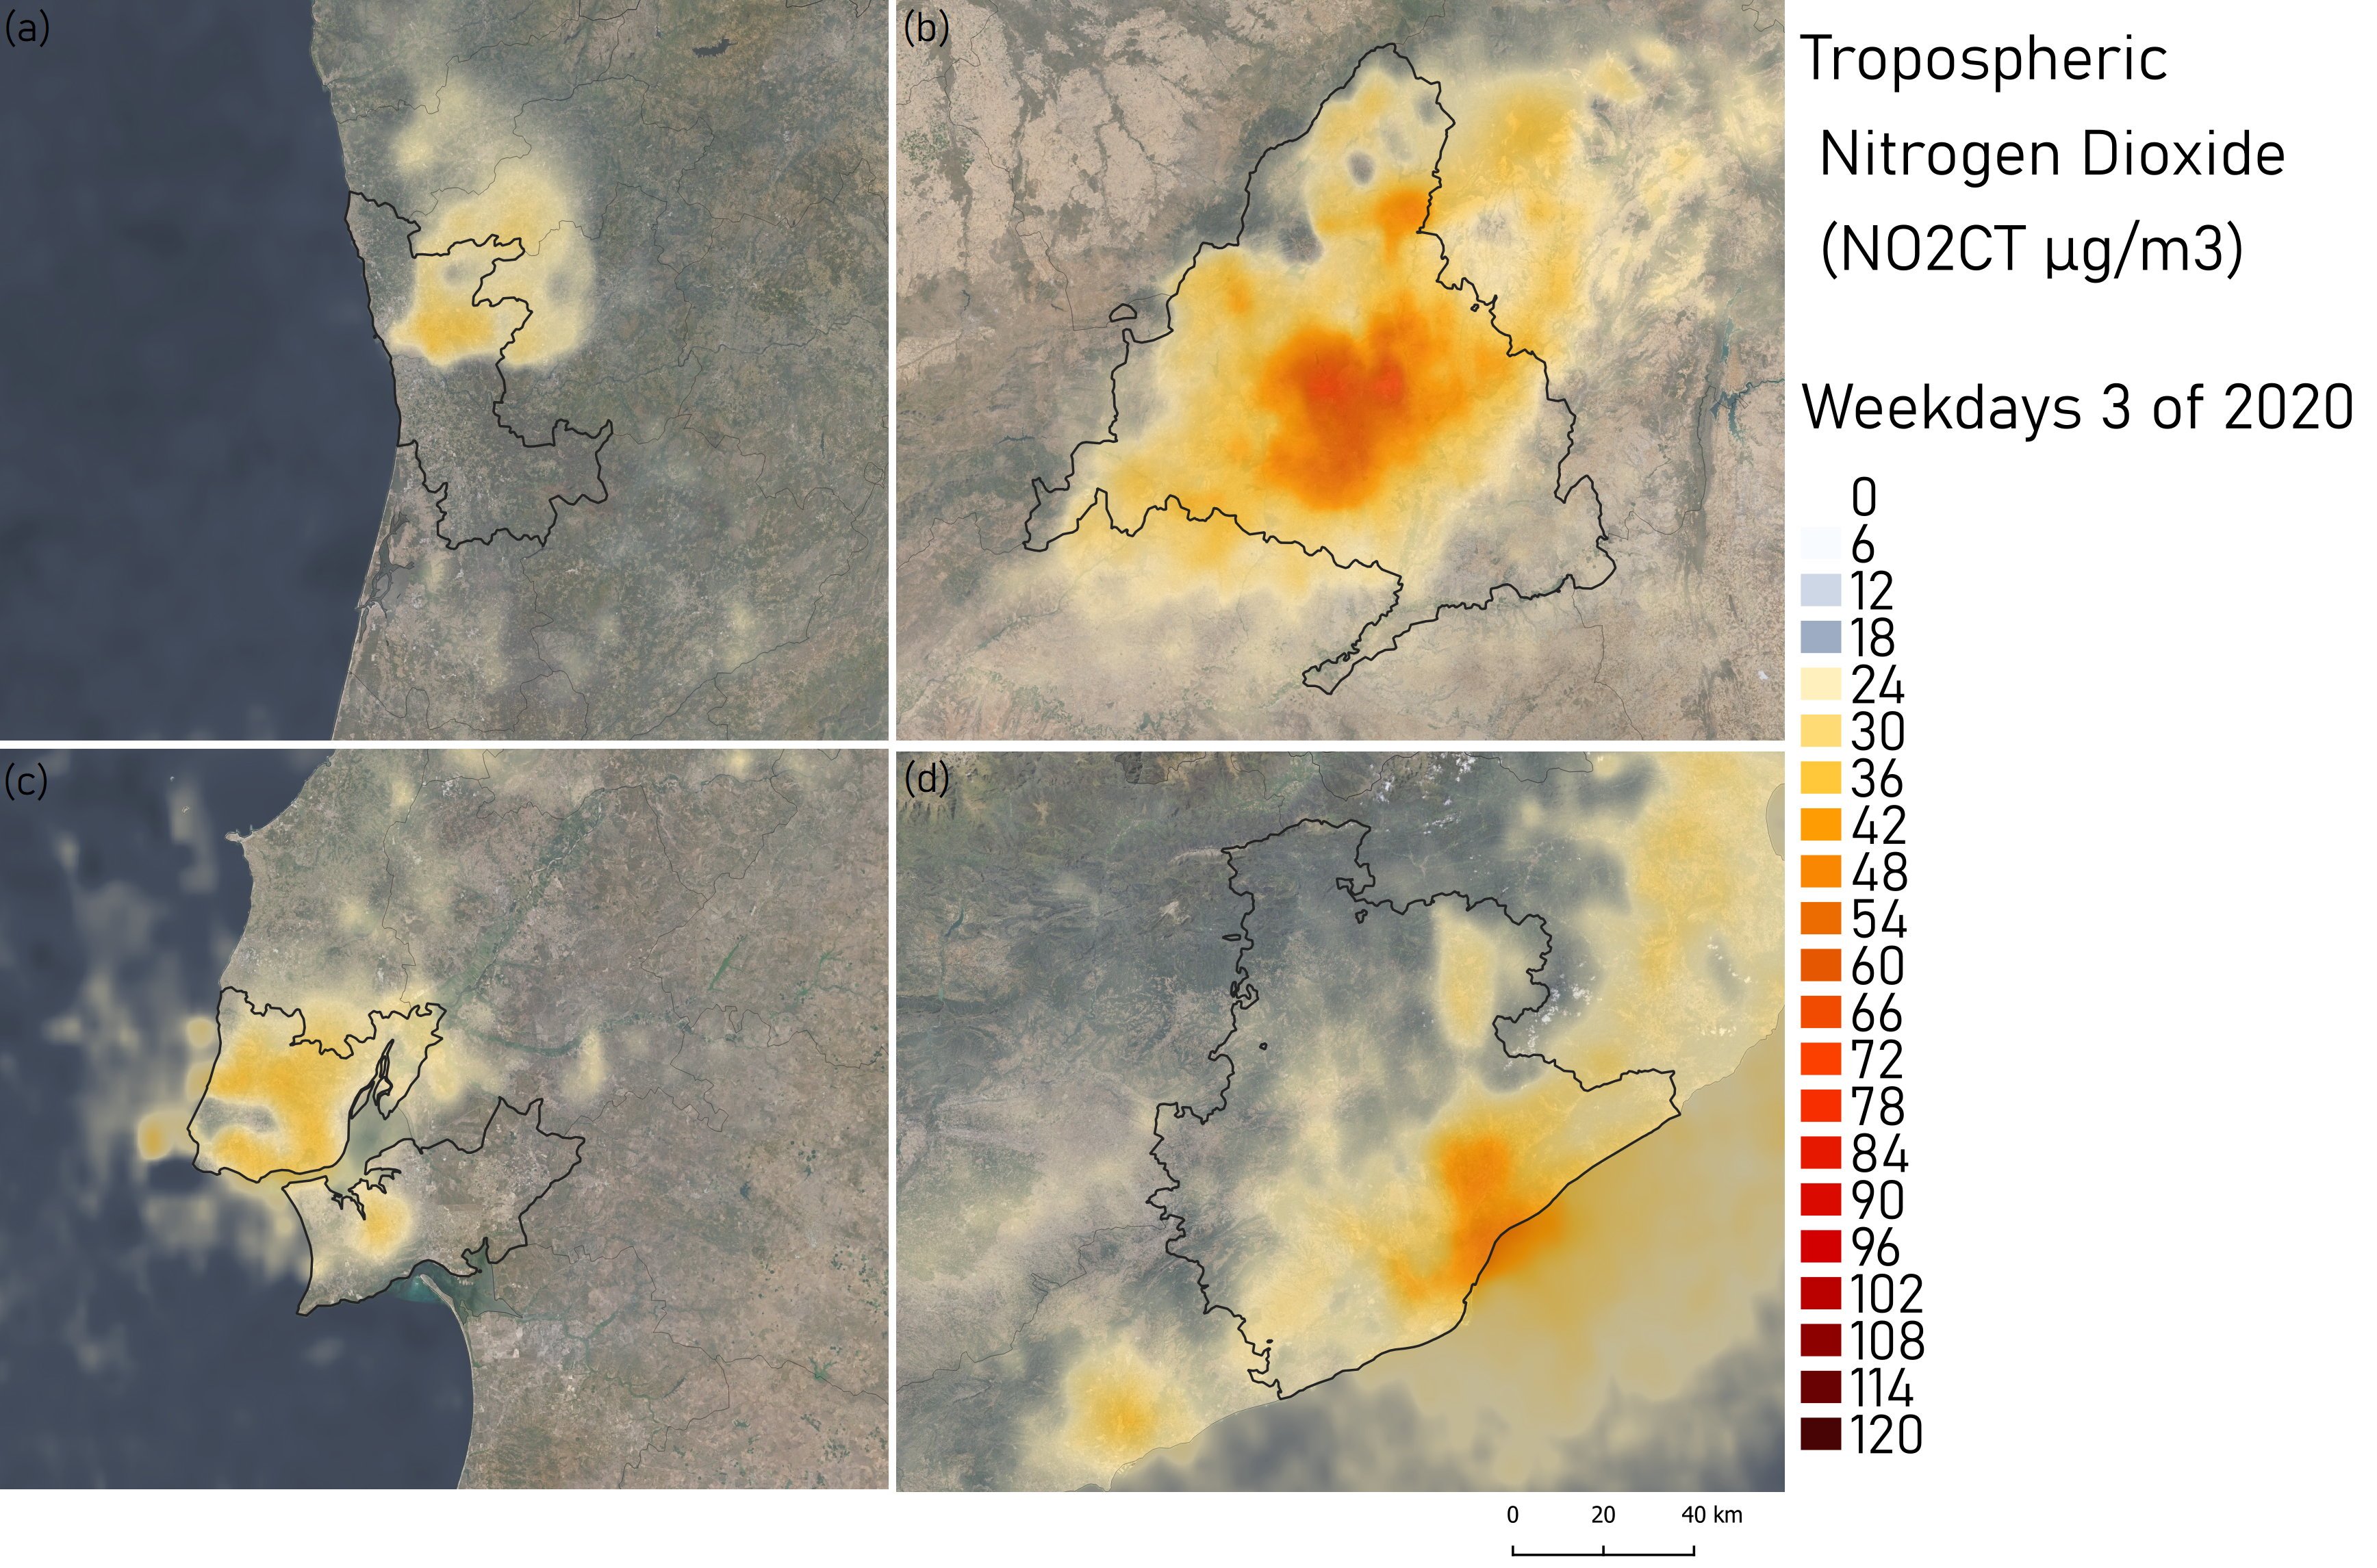
In the present case study, the tropospheric NO2 (NO2CT) is studied, by comparing satellite data observations with in situ measurements, to disclose their correlation and investigate its seasonal cycle.
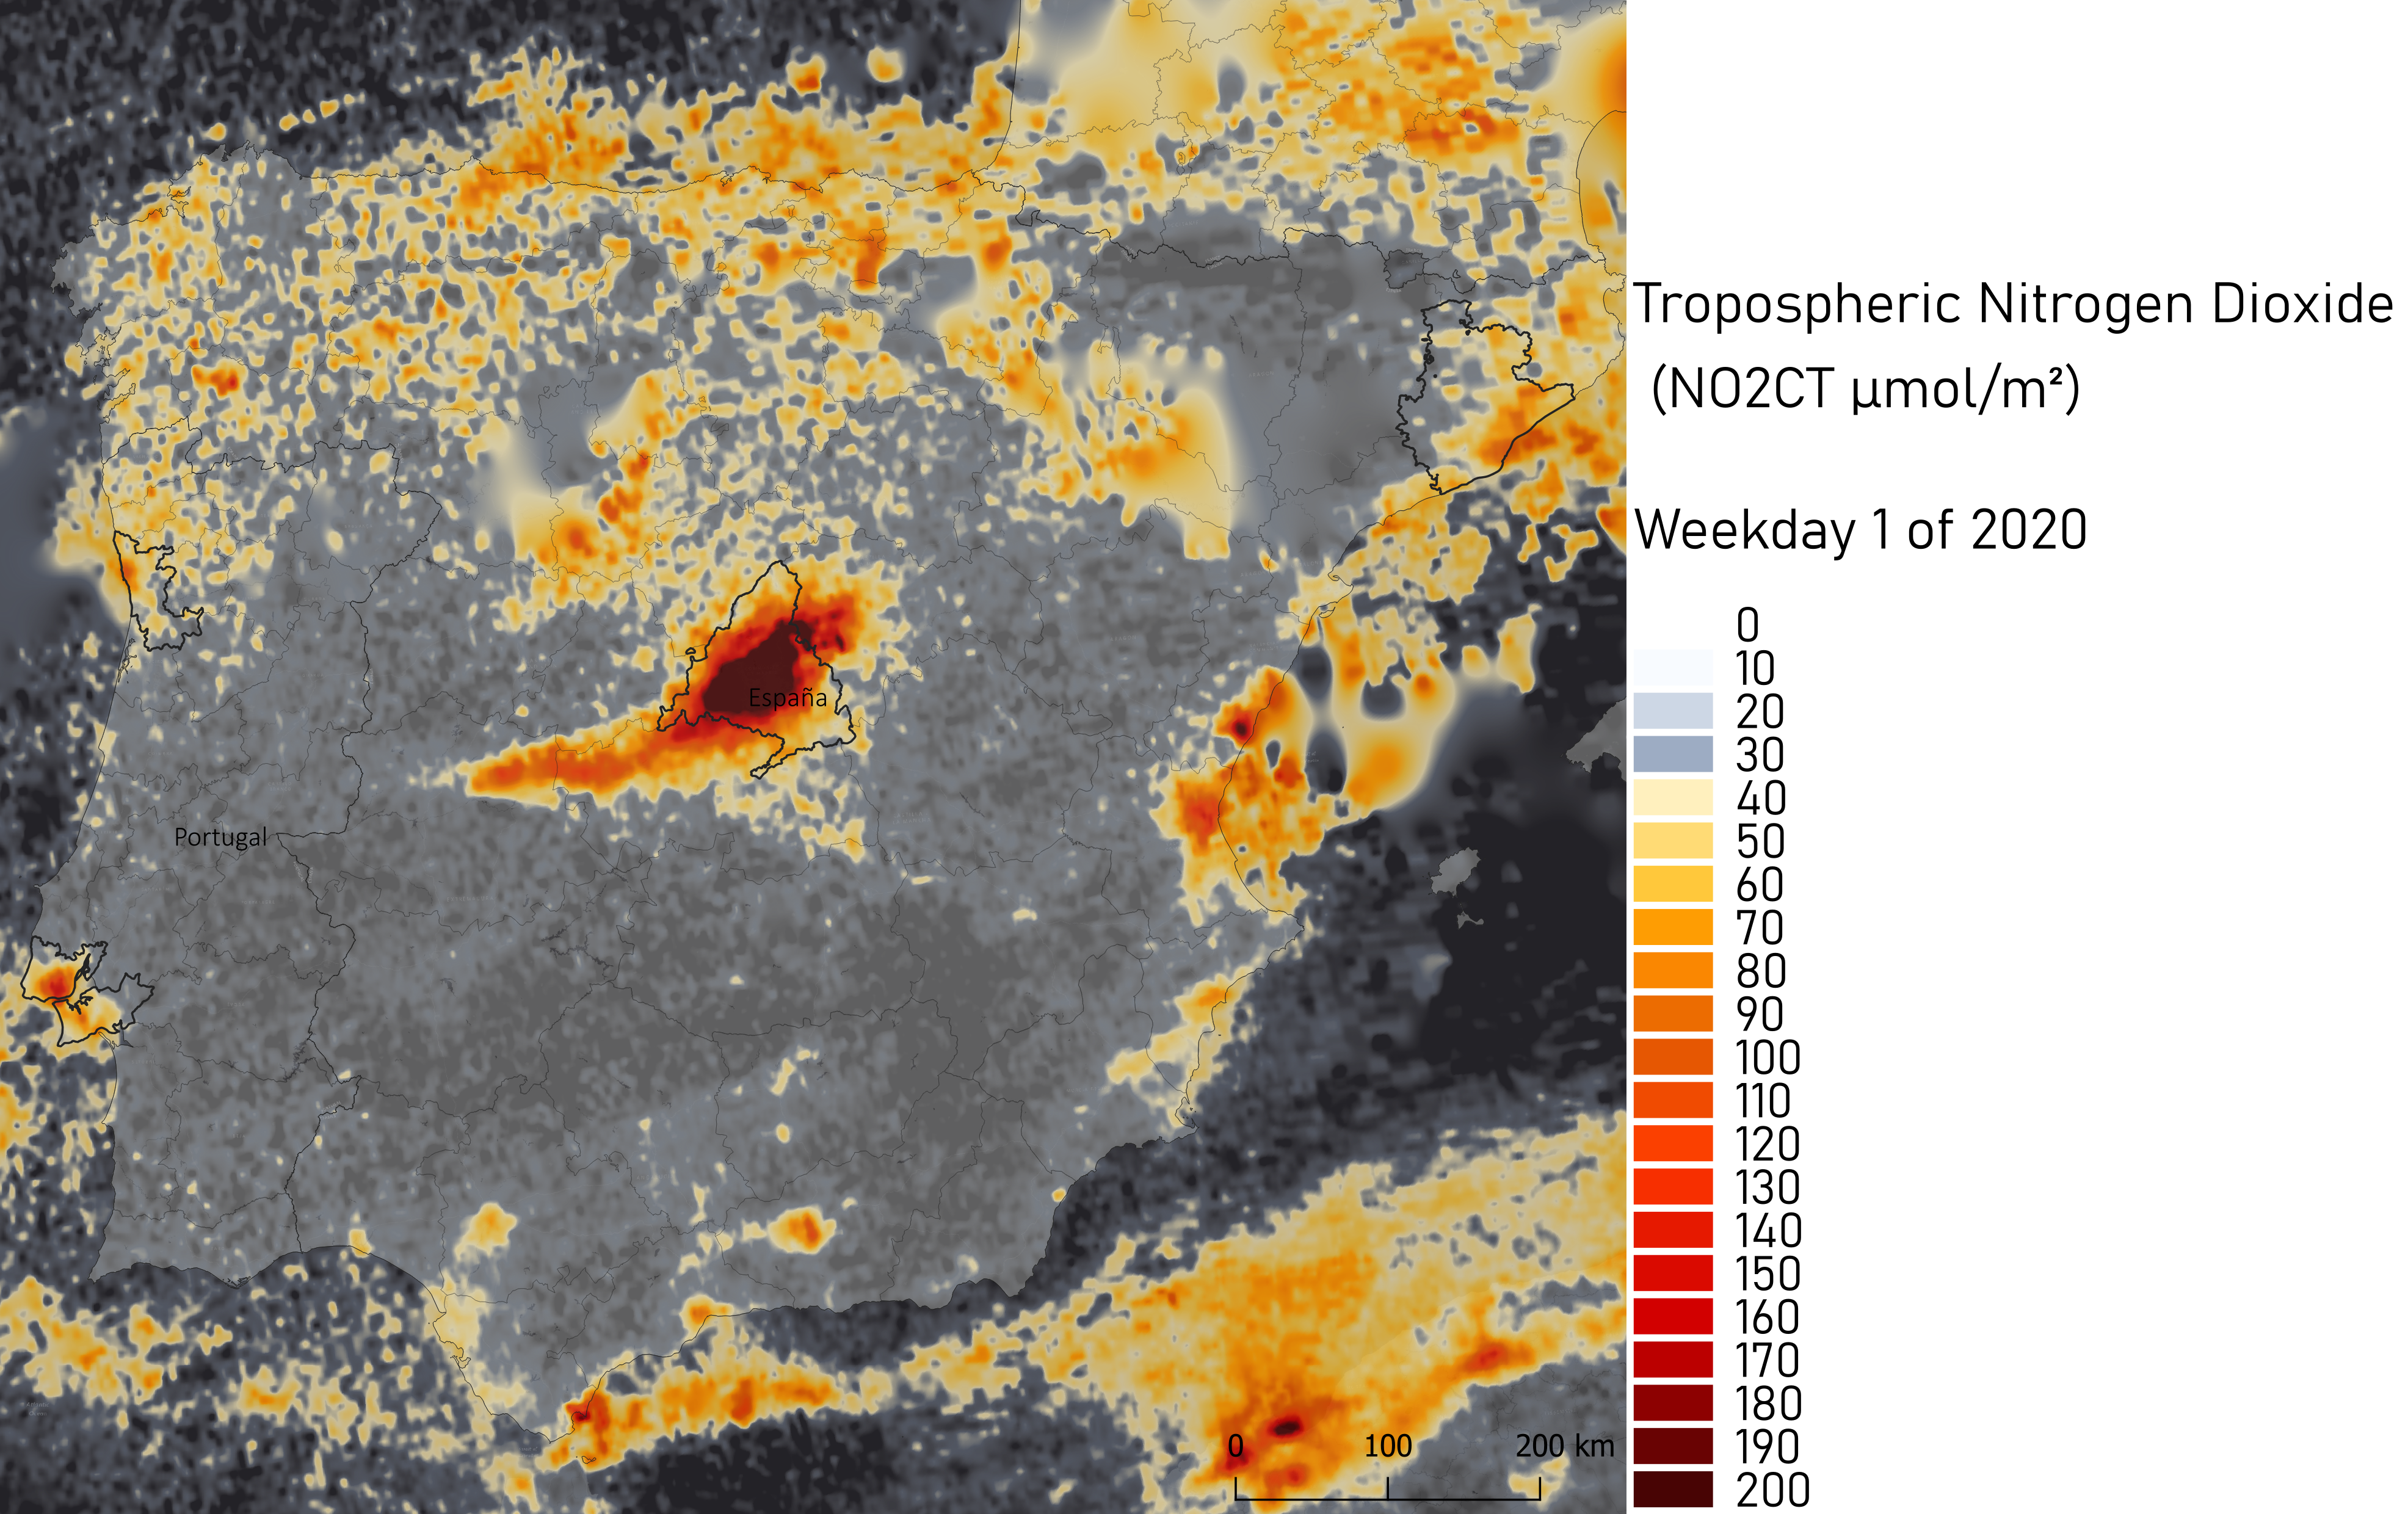
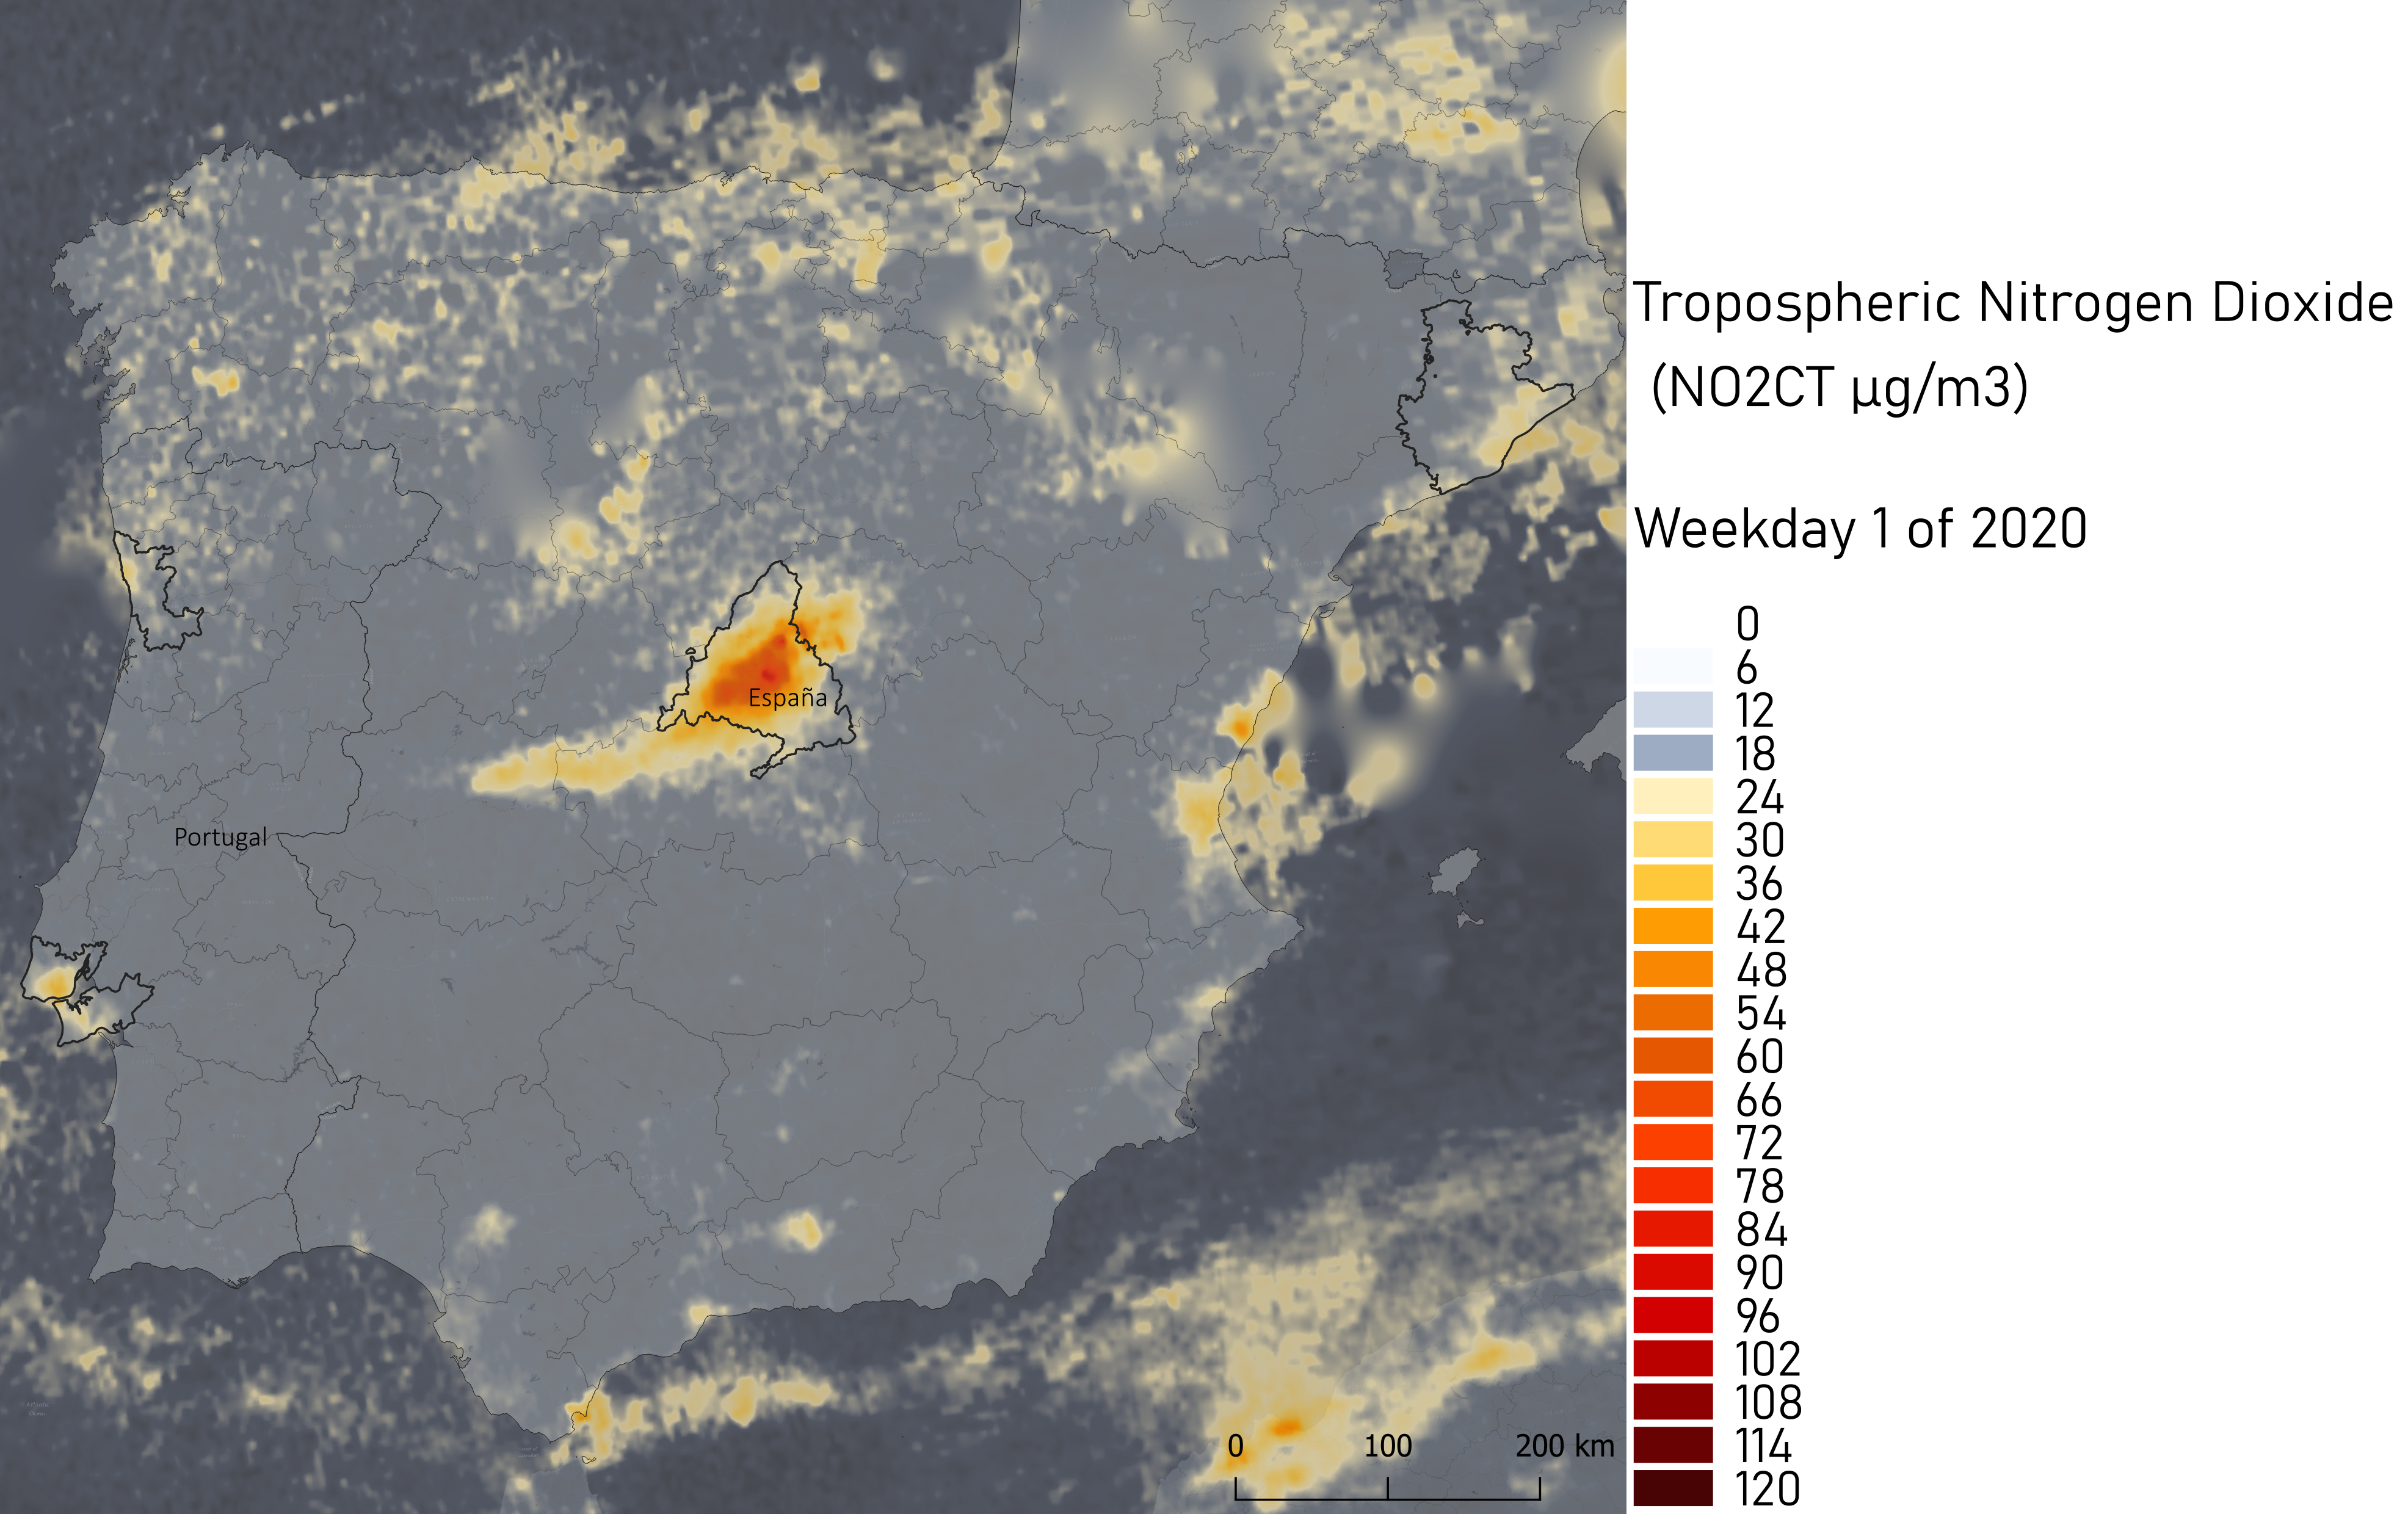
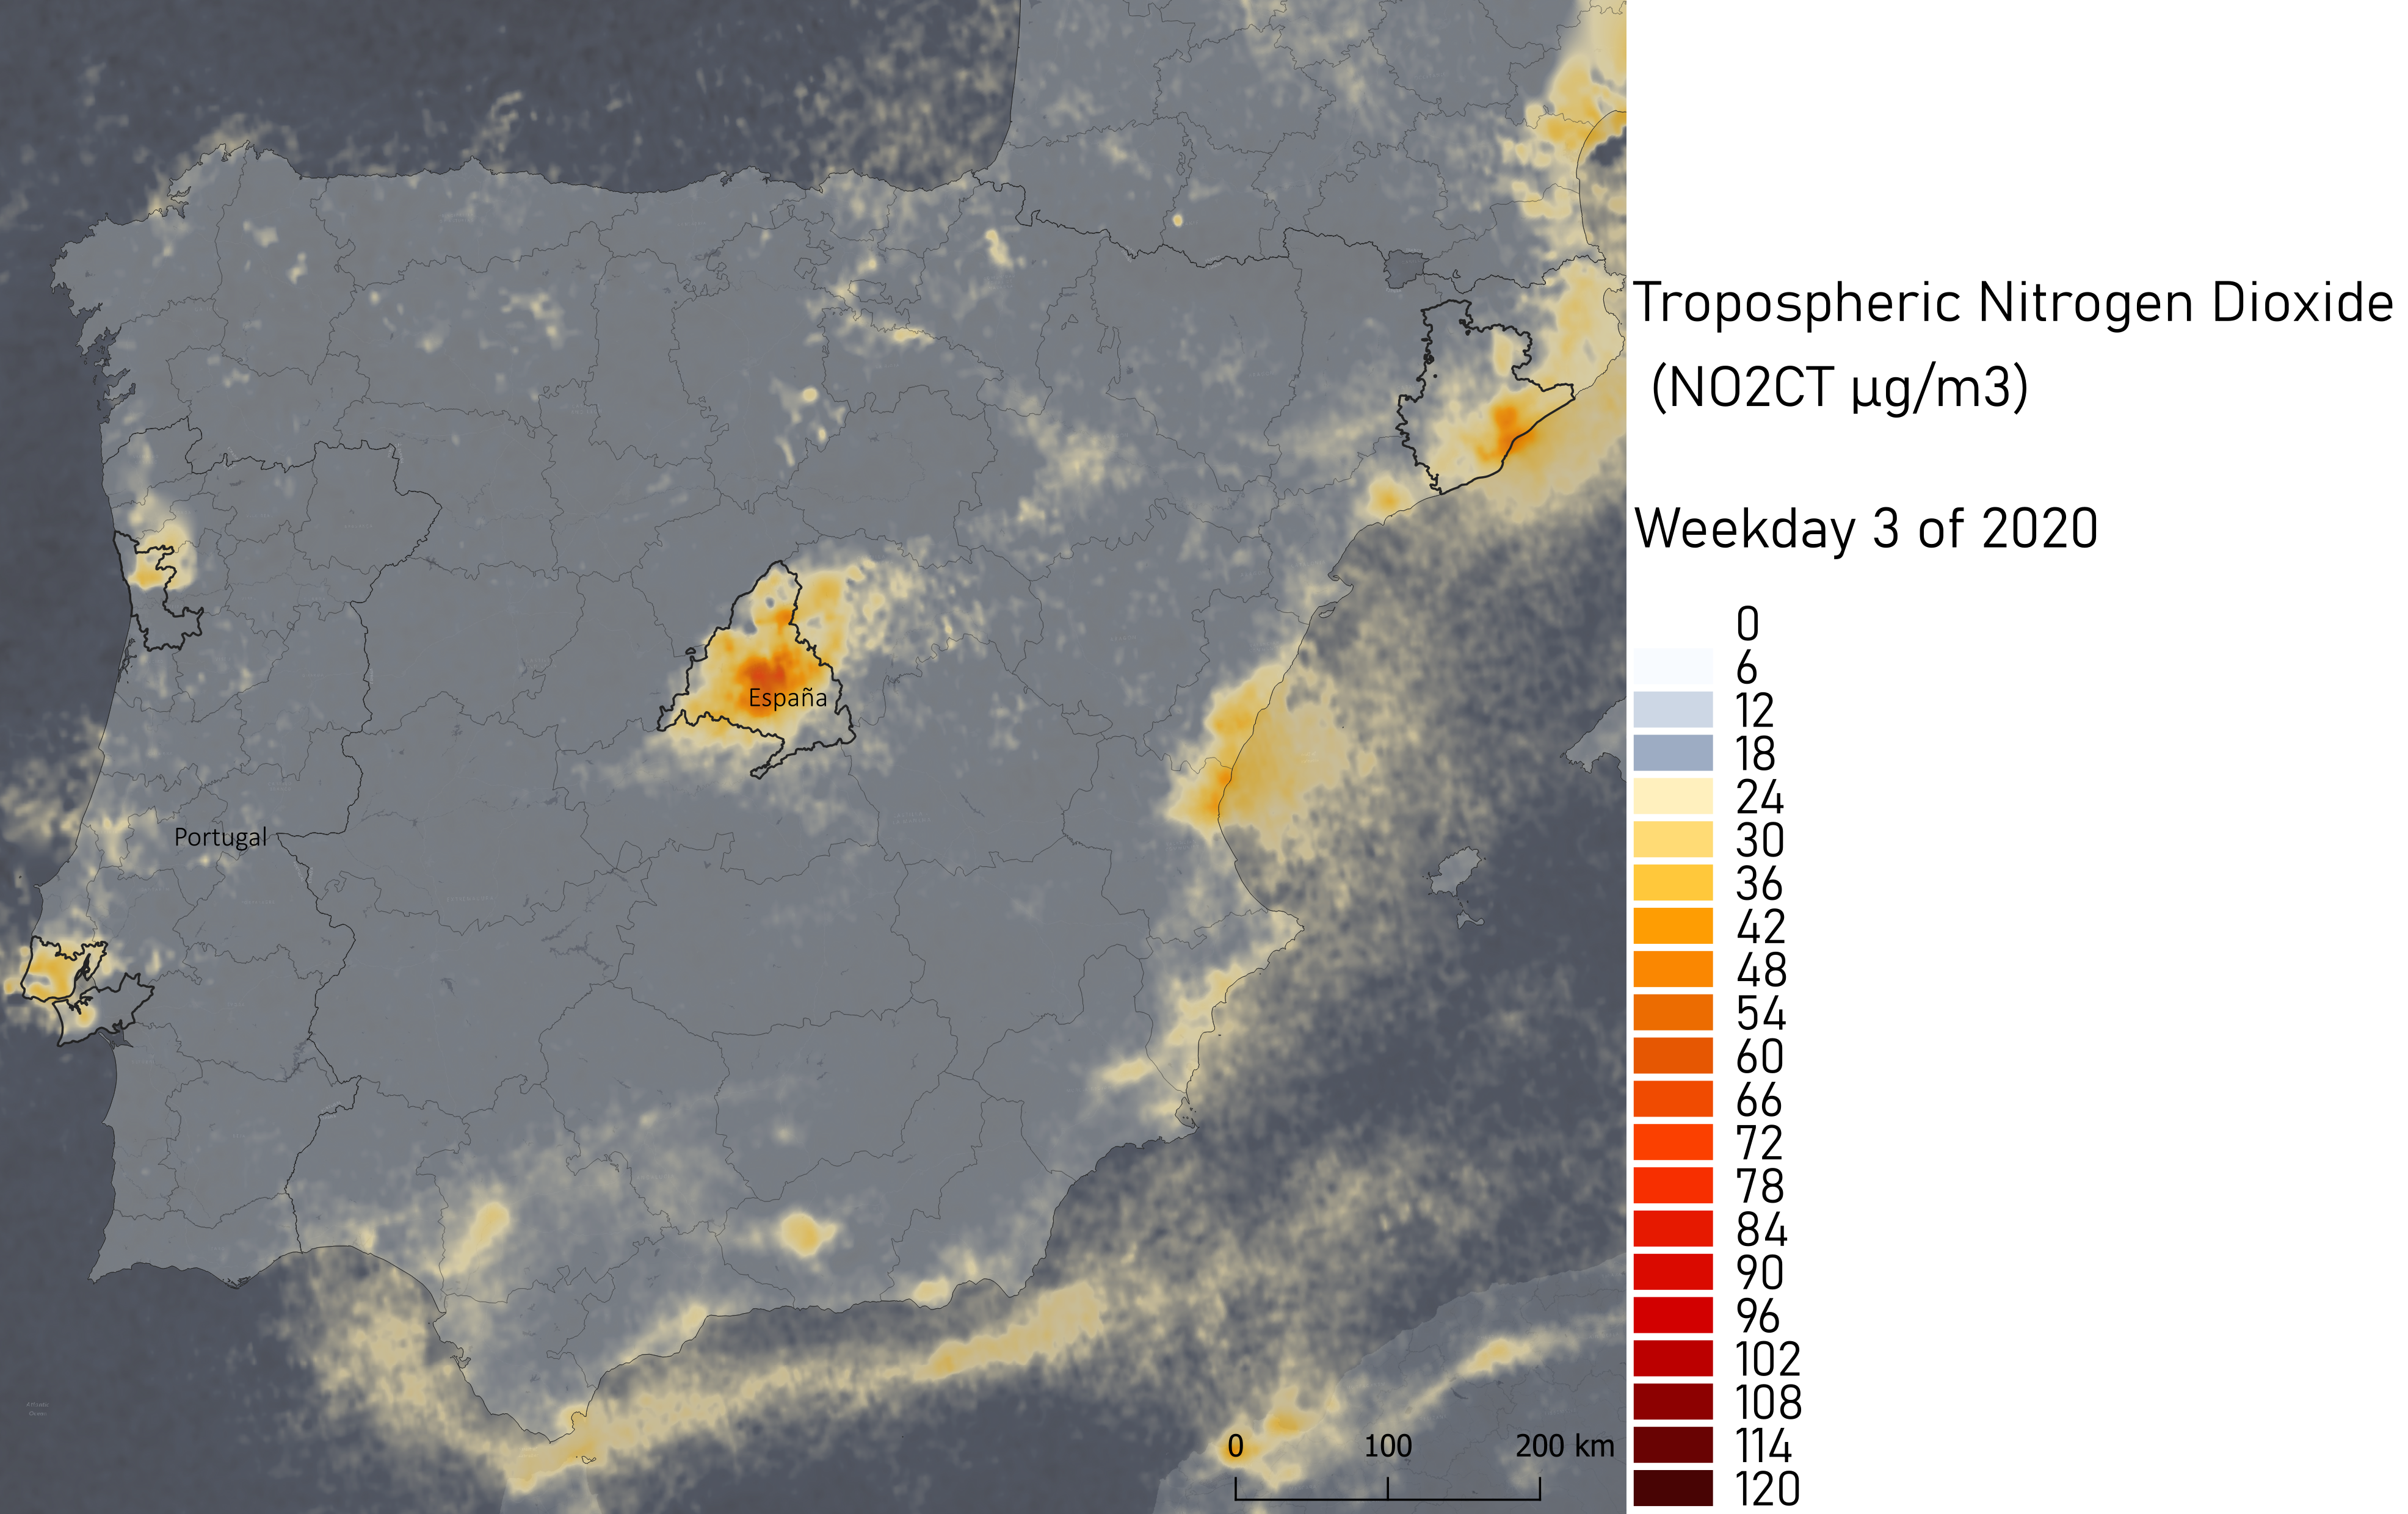
The aim of this analysis is to recognize: (i) which are the typical and exceptional conditions of NO2CT concentrations that occurred in 2020 (taking into the account the global pandemic that led to widespread confinement form March to June 2020); (ii) what is the relation between NO2CT concentrations (satellite data) and in-situ NO2 concentrations in each and across the cities; and (iii) describe the seasonal cycle of NO2 concentrations in each of the case study cities.
Methodology
Two sets of NO2 observation data were used in this study: satellite-acquired remote sensing observations and in-situ measurements.
The methodology used comprises the following steps:
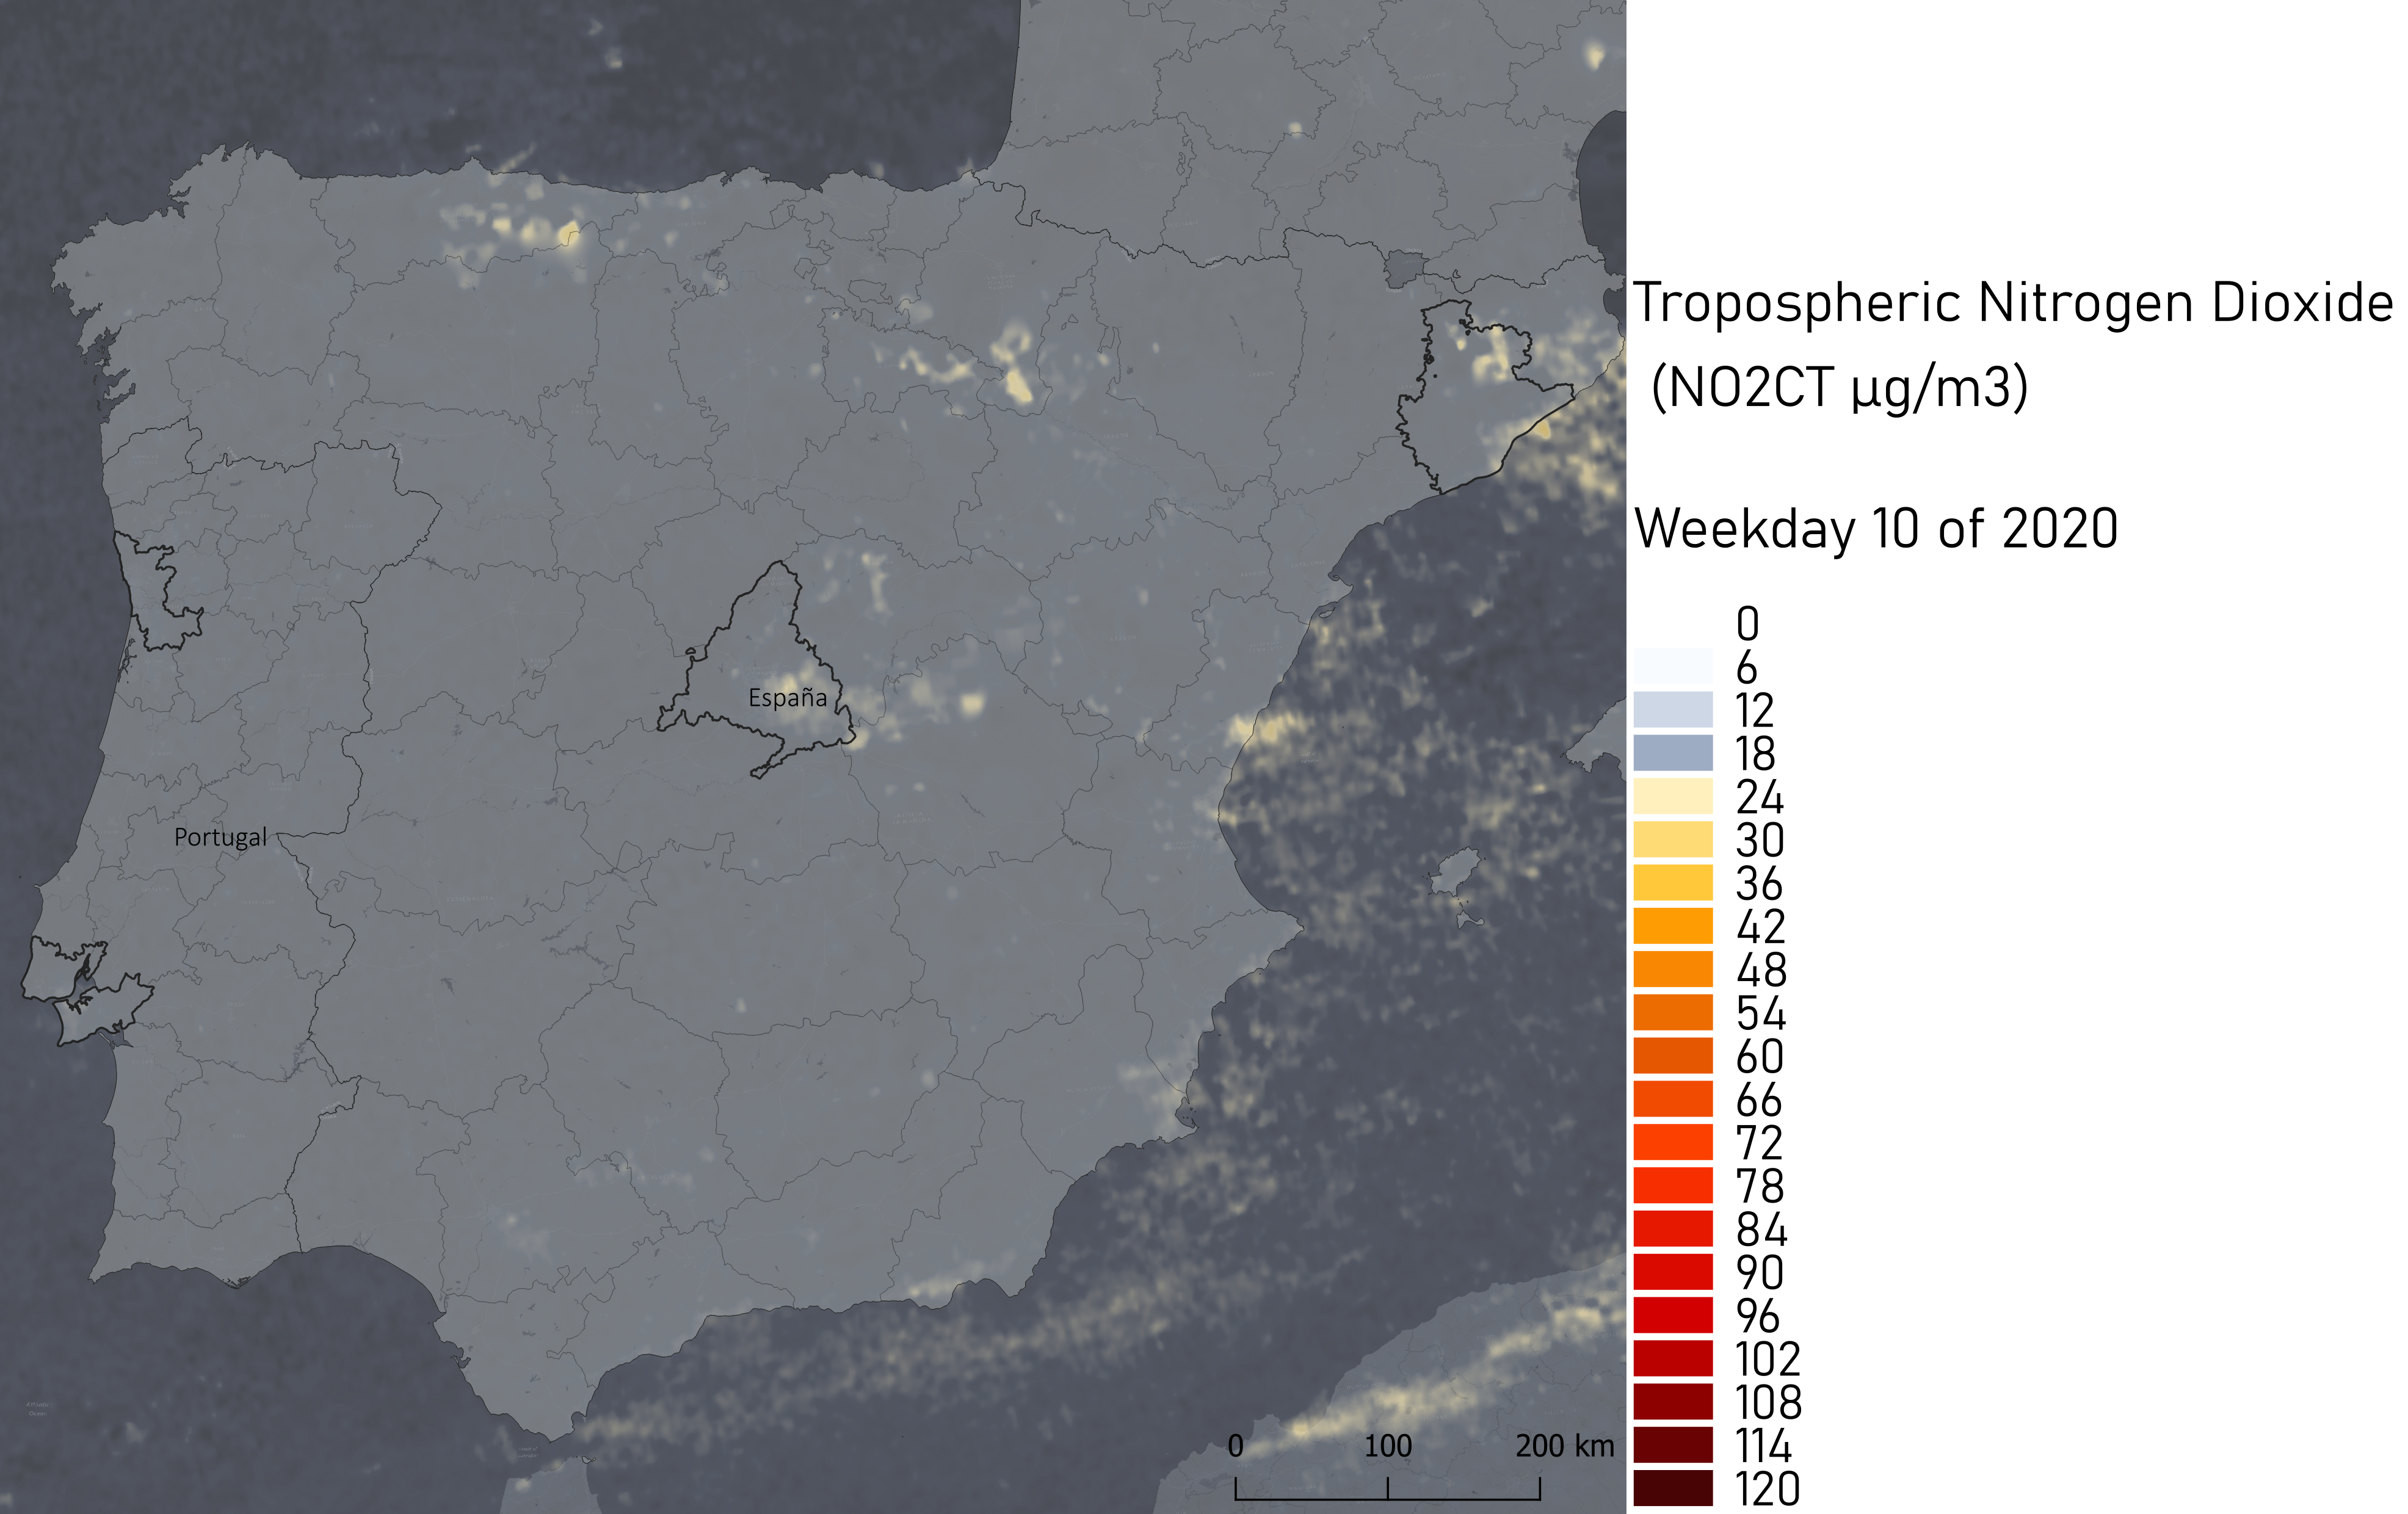
- Processing and quality assessment (QA) of the satellite data - data from the TROPOMI (the TROPOspheric Monitoring Instrument) satellite on board of the Sentinel-5 Precursor (S5P) was used; Level 2 outputs from S5P include automated quality assurance parameters; S5P data was retrieved from the corresponding Pre-Operations Data Hub (https://s5phub.copernicus.eu/) in Feb of 2021, including only offline processing mode (OFFL). The temporal coverage includes the period from 2020-01-01 to 2020-12-31. The geographic domain considered was a box with the following coordinates: 35° N/10° W and 44° N/5° E.
- In-situ data observations - data was retrieved from European Environment Agency (EEA) database (https://www.eea.europa.eu/); the stations included in the data collection correspond to the major Functional Urban Areas (FUAs) of the Iberian Peninsula – Lisbon and Oporto (in Portugal), and Madrid and Barcelona (in Spain) – and the same temporal coverage was considered. The crucial step used on this in-situ dataset was the aggregation of the Weekdays (Wd) and Weekend days (WEd) averages (separately), using only values from 11h to 14h, which corresponds to the overpass of the TROPOMI Satellite (this was done to have the best correlation possible with the performance of Sentinel-5P).
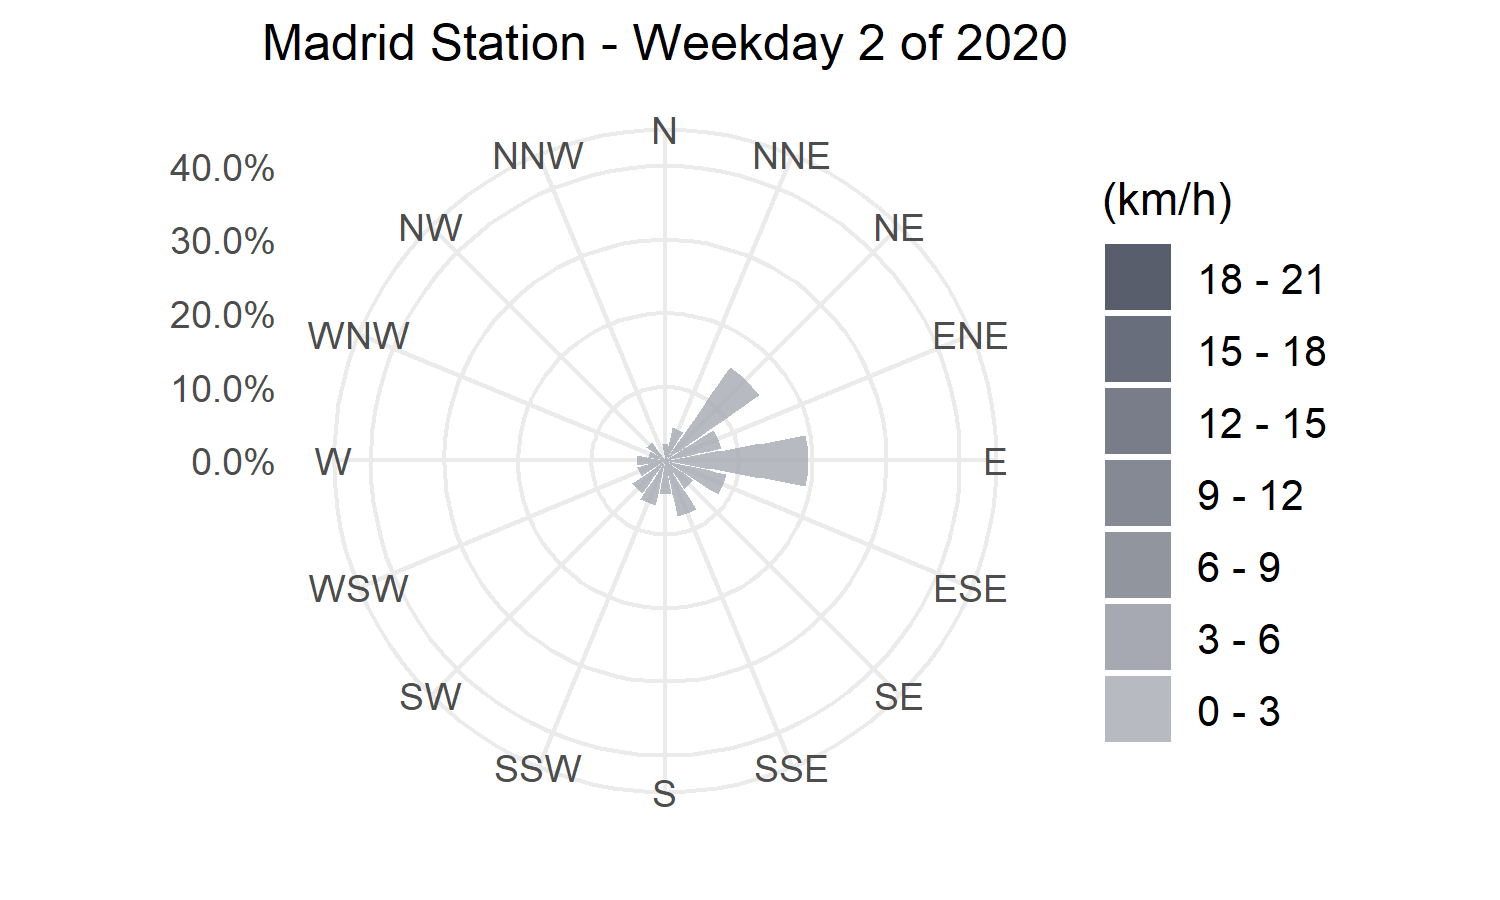
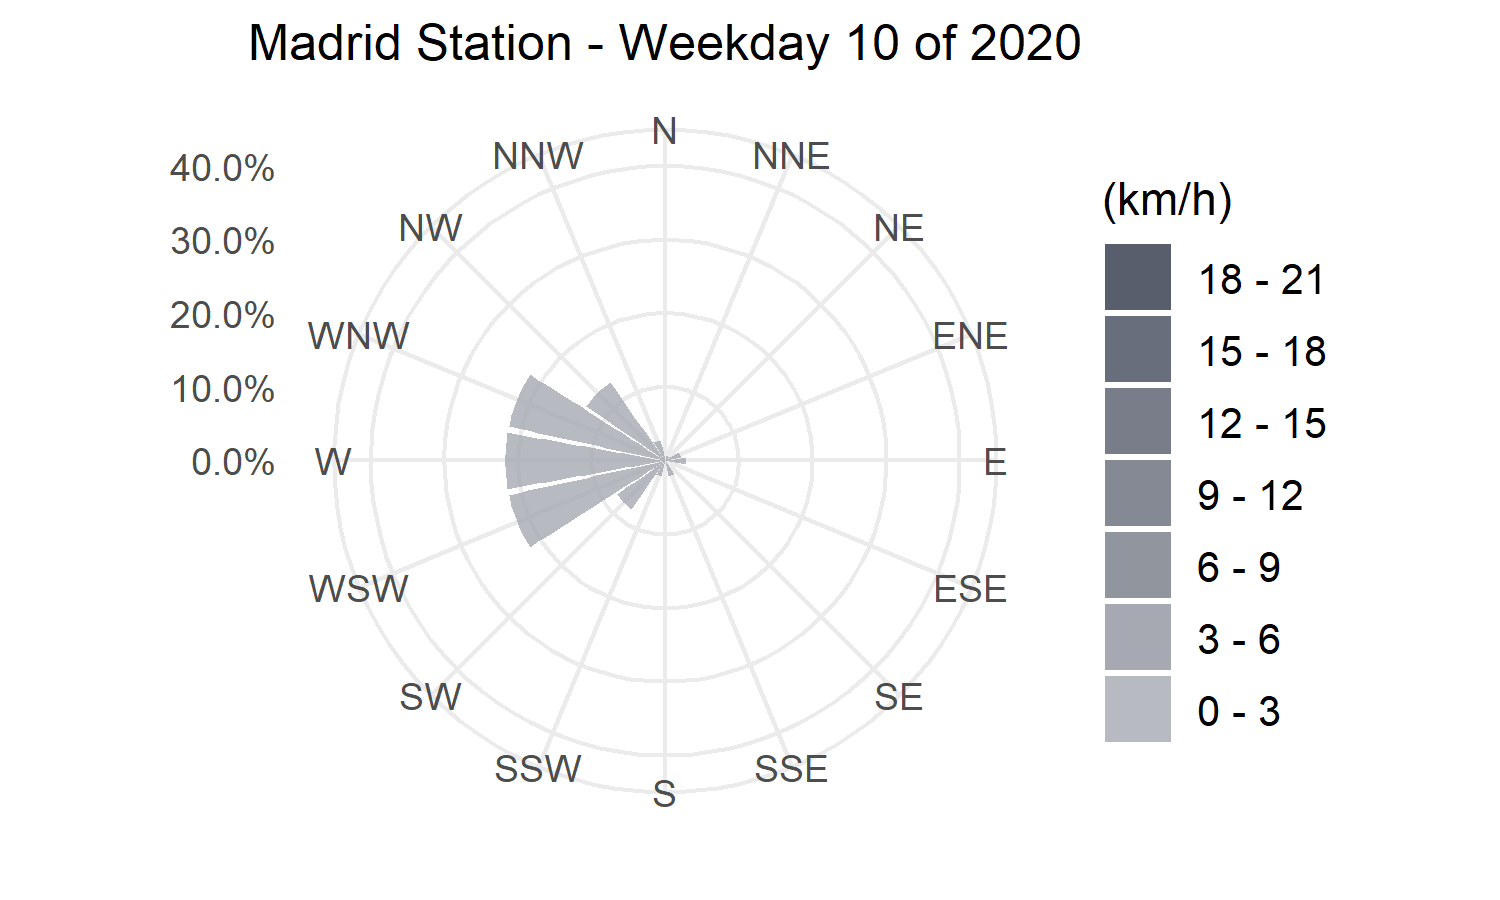
- Complementary meteorological observations - to better understand the seasonality of NO2 concentrations, this data was retrieved from the European Climate Assessment & Dataset project (ECA&D, https://www.ecad.eu/).
Before proceeding to the linear mixed model, outliers were identified and removed through the Mahalanobis Distance (MD) method.

