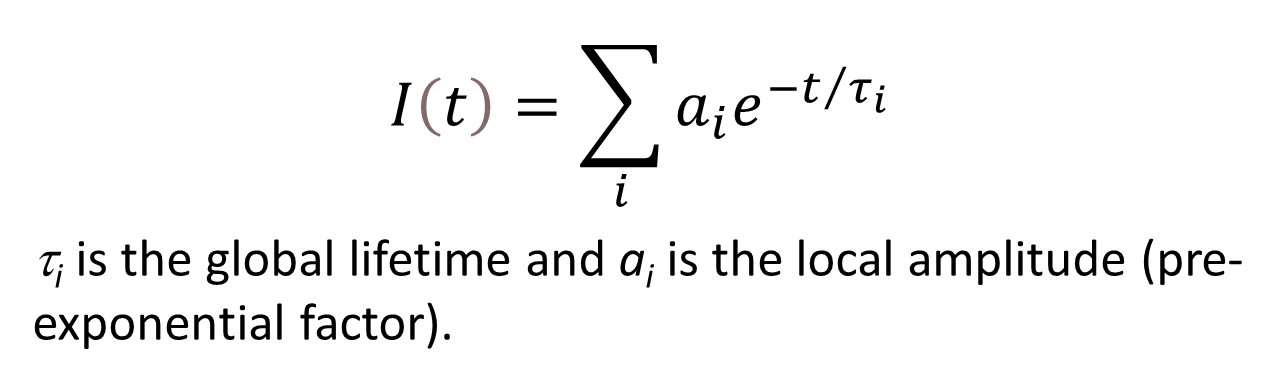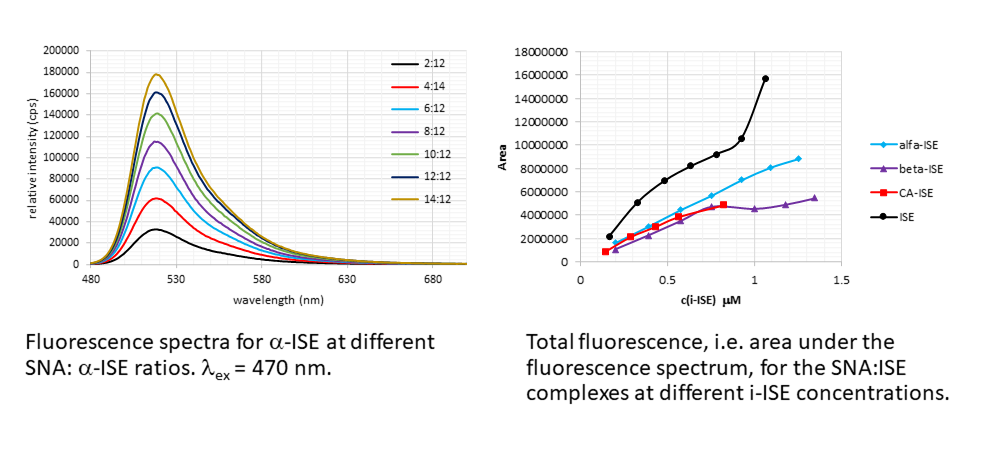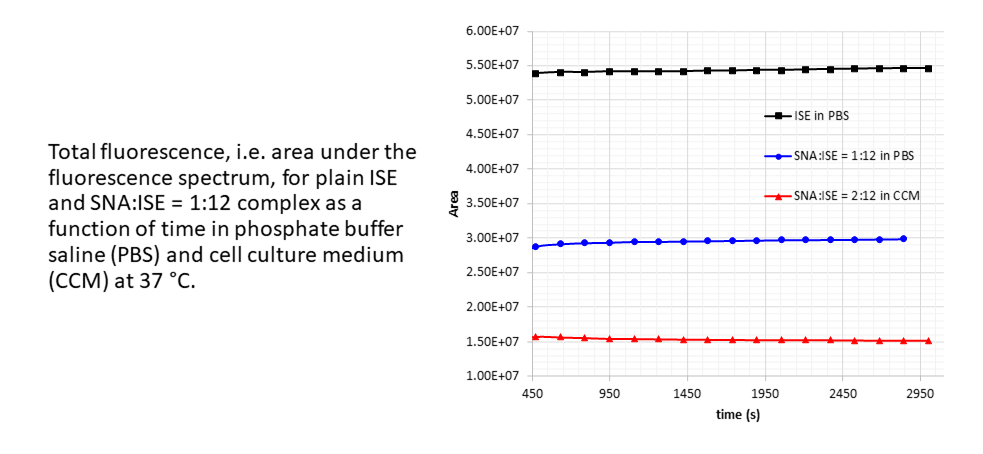
C60-based spherical nucleic acids (SNA) with polyvalent nanostructures consisting of a relatively small core and densely packed, highly oriented oligonucleotides (ON). The affinity of SNAs for complementary nucleic acids, i.e. the ON to be delivered, is high leading to effective gene suppression. The outer sphere of the SNA-oligonucleotide complex can be modified by appropriate ligands, which are aimed to hide the inner oligonucleotide content and facilitate the bio-distribution, cell-specificity, cellular uptake and intracellular action of the complex.
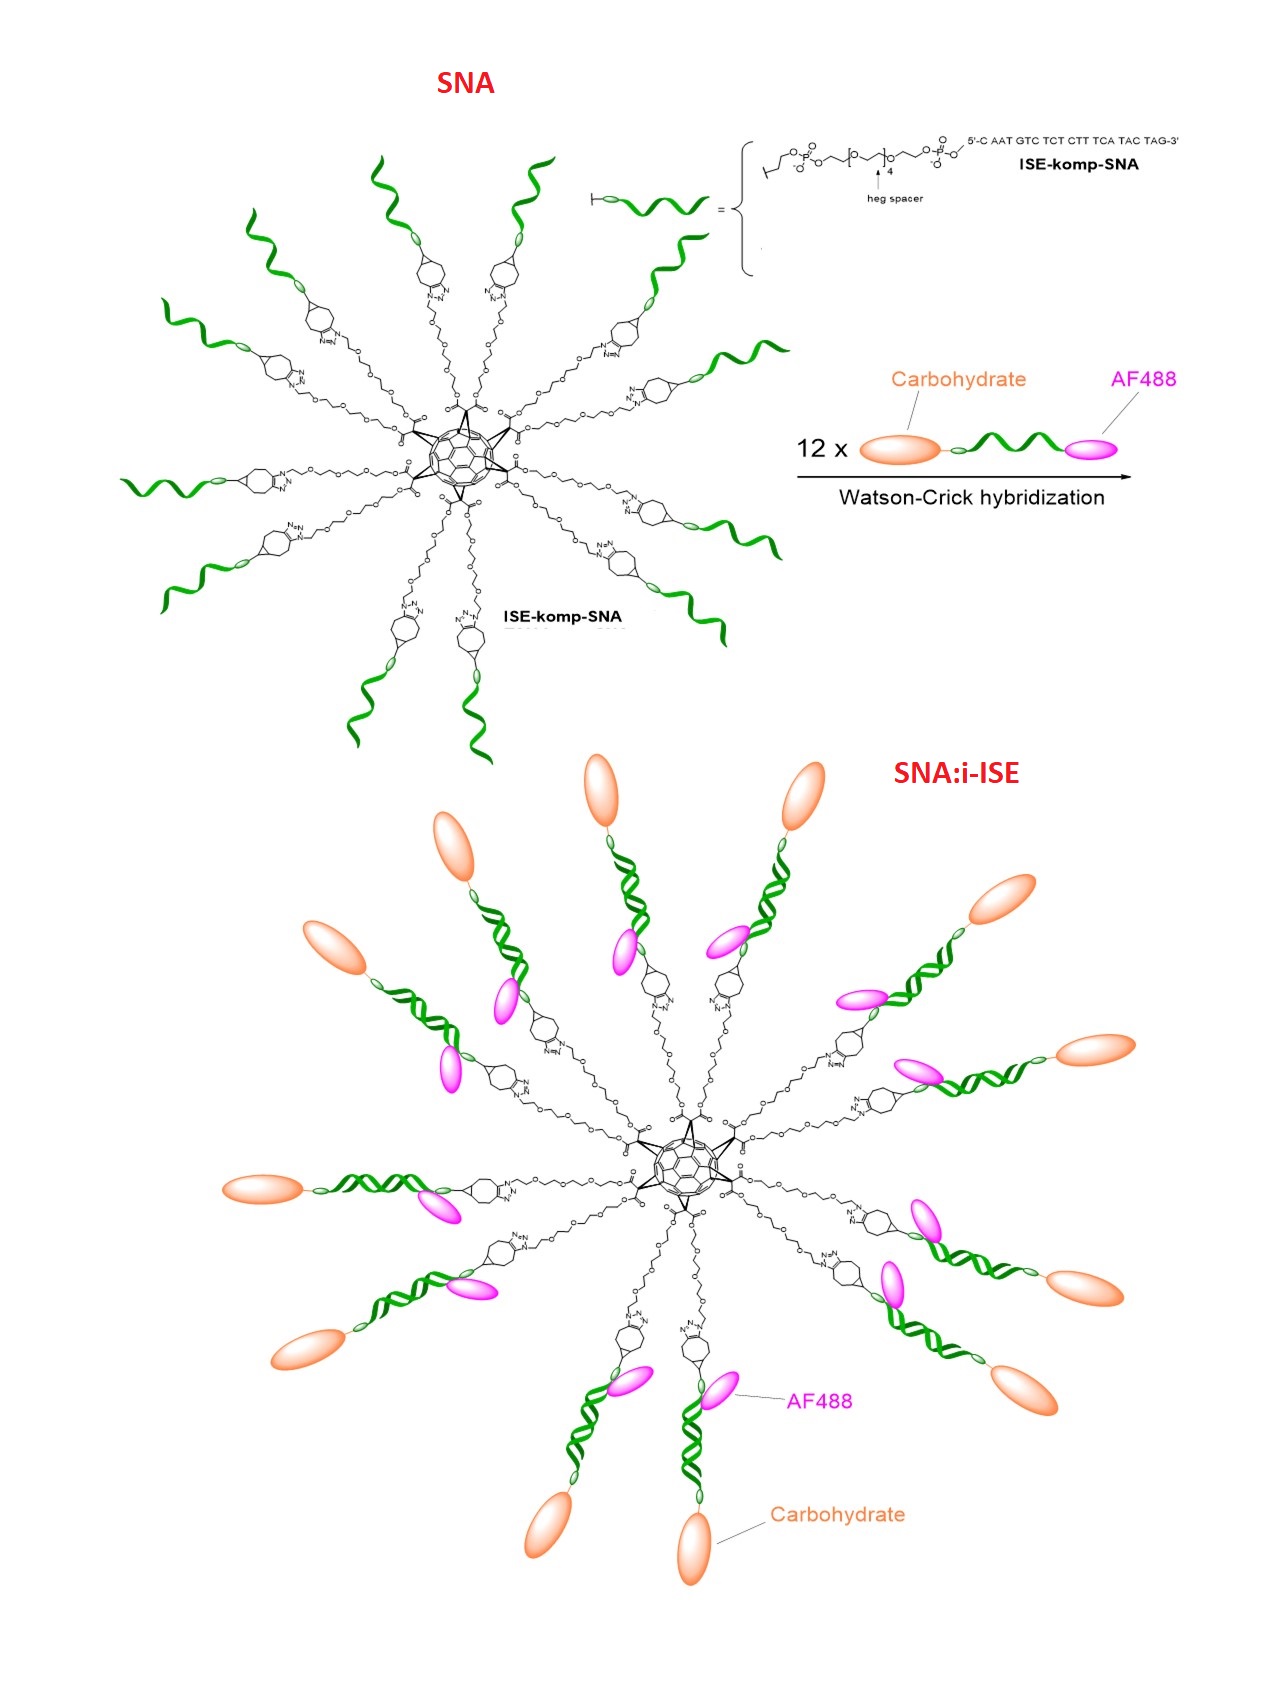
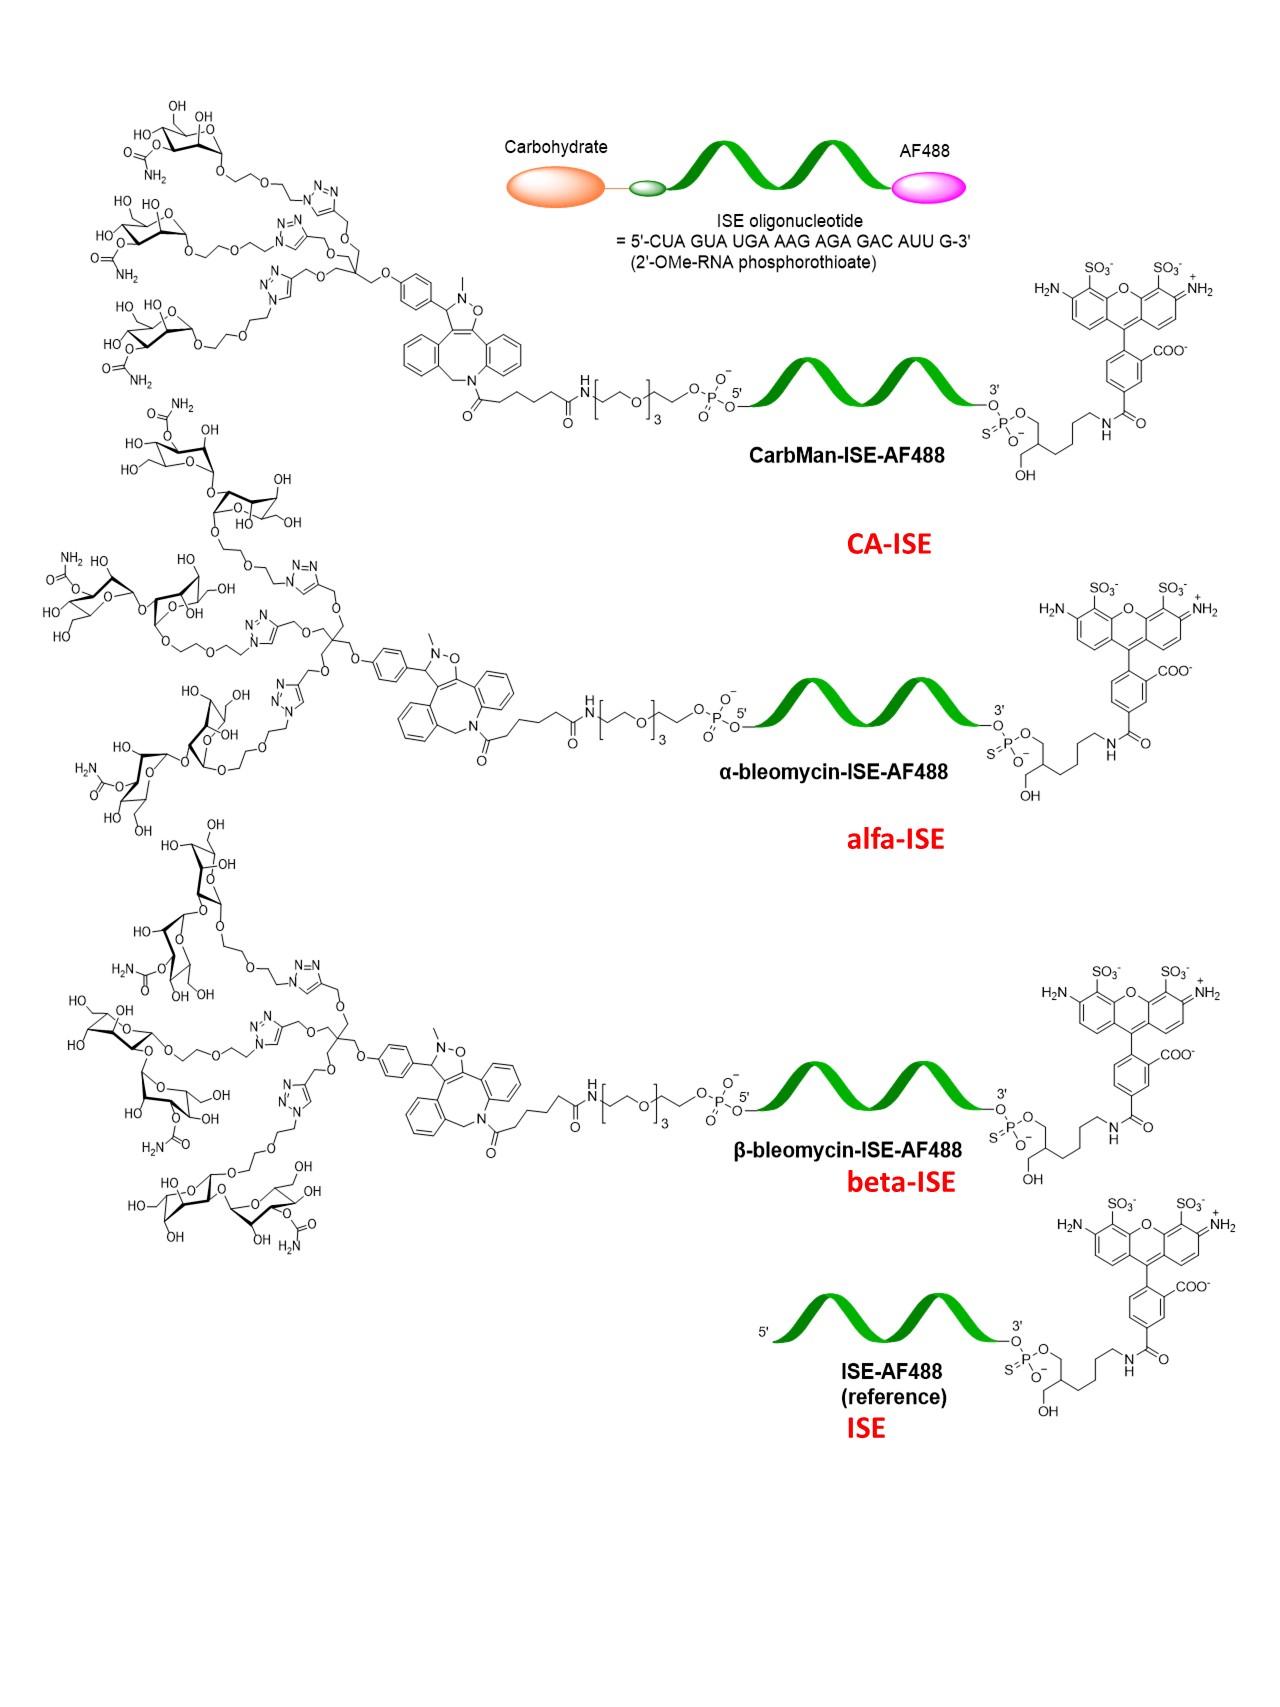
The complementary nucleic acids (CNA) used in this study.
The SNA was as synthesized via the same strategy as in:
00:00
--:--