Introducing STAR-MELT: STellar AccRetion-Mapping with Emission Line Tomography - a Python package for extraction, identification, fitting and analysis of spectral lines

Justyn Campbell-white 1 , Aurora Sicilia-Aguilar 1 , Soko Matsumura 1

  • 1 University Of Dundee, United Kingdom

Abstract

Low- and intermediate-mass stars acquire most of their mass in the protostellar phase, but accretion continues into the pre-main-sequence phase via a disk for a few million years. Accretion governs the transport of matter and angular momentum from the accretion disk to the star. This affects disk stability and evolution, stellar rotation and activity, and planet formation and migration. The main observational challenge is probing the sub-au scales of the innermost disk, which is not yet possible via interferometry. Such stars, however, possess a wealth of metallic emission lines that can reveal the nature of these accretion-related processes.

Our analysis involves emission line tomography of time-resolved high-resolution spectra of young stars. This technique uses the time domain to look for distortions in the stellar emission line profiles and radial velocity signatures. Temperatures and densities can be determined for the various emission line species. With both temporal and spatial information, we can then infer a tomographic map of the accretion structures, activity spots and the innermost hot atomic gas; down to smaller scales than those achievable with direct imaging. Our analysis allows for new science results to be obtained from archival data.

We have developed a Python package to extract and analyse the accretion and/or activity spectrum from the high-resolution data. Directly from the fits files, the emission lines are automatically extracted and identified, via matching to a compiled reference database of lines. Line profiles are fitted and quantified, allowing for calculations of physical properties across each individual observation. Our STAR-MELT python package would also be useful for different applications of spectral analysis, where emission line identification is required. Standard data formats for spectra are automatically compatible, with user-defined custom formats also available. Any reference database (atomic or molecular) can also be used for line identification. Temporal variations in lines can readily be displayed and quantified.

Accretion & inner-disk of pre-main-sequence stars

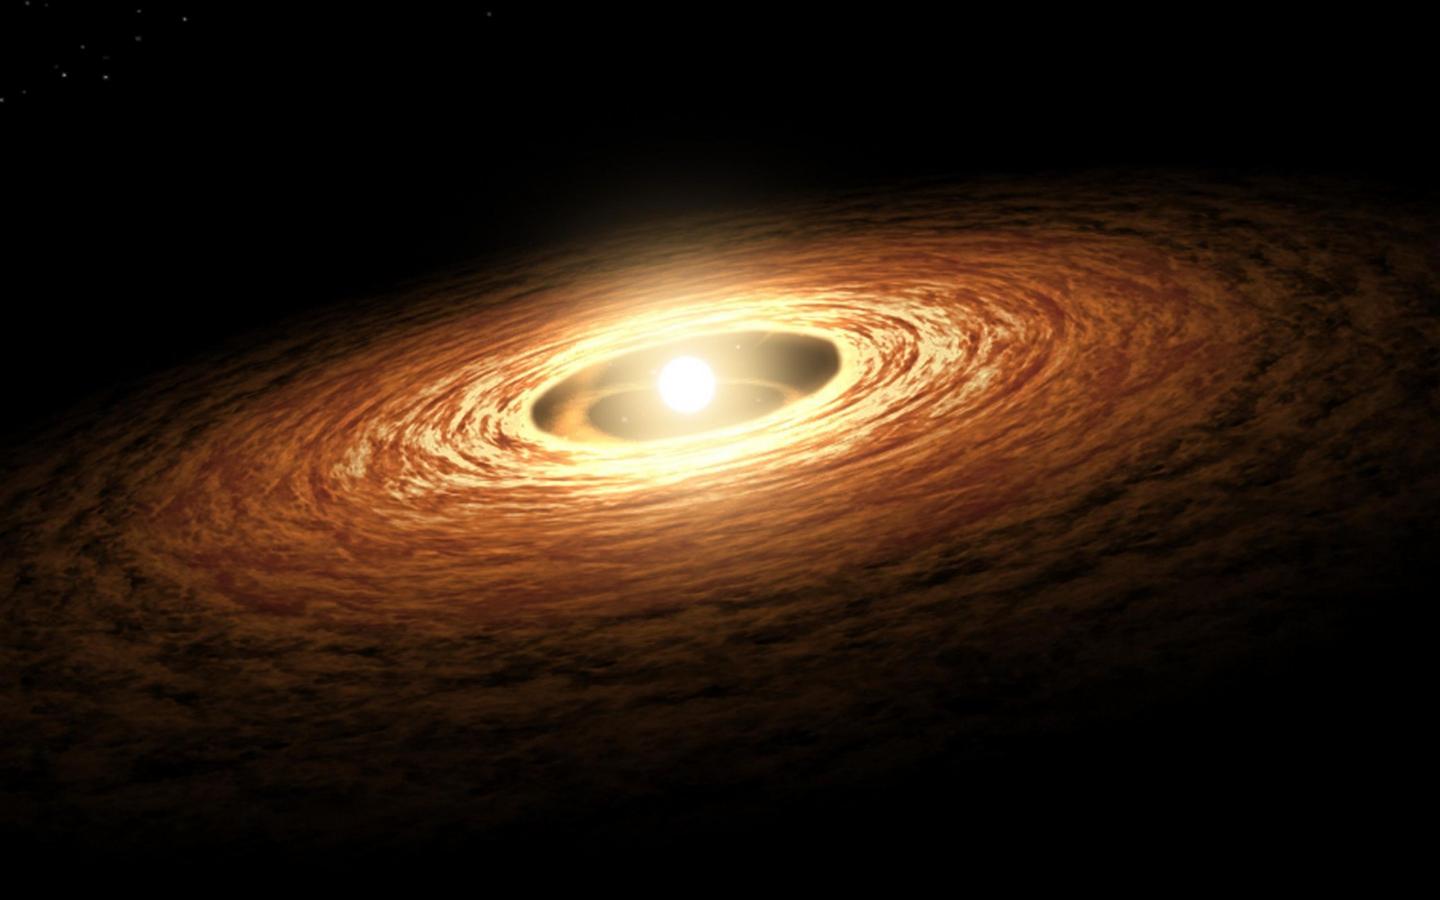
Illustration of a pre-main-sequence star with accretion channels and protoplanetary disk. Image credit: NASA/JPL-Caltech

Introduction

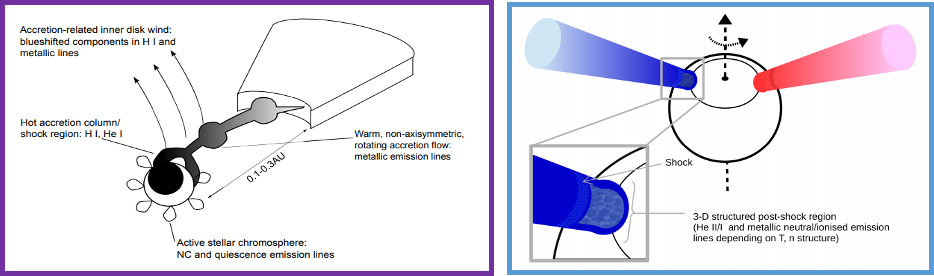
  • Accretion governs the transport of matter and angular momentum from the disk to the star
  • Accretion affects disk stability and evolution, planet formation and migration, and stellar rotation and activity 
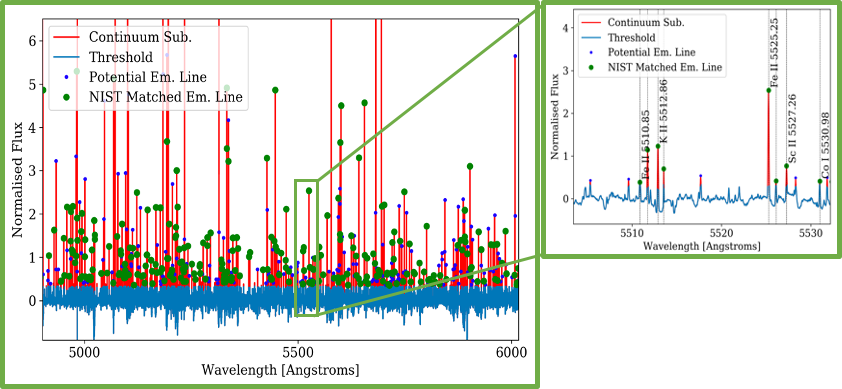
  • During the pre-main-sequence phase, such stars possess many metallic emission lines, such as calcium, iron, and titanium
  • These lines cover a large range of energies, densities, and temperatures
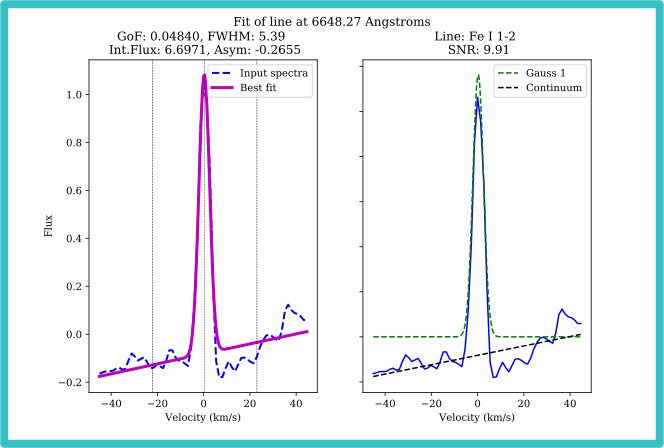
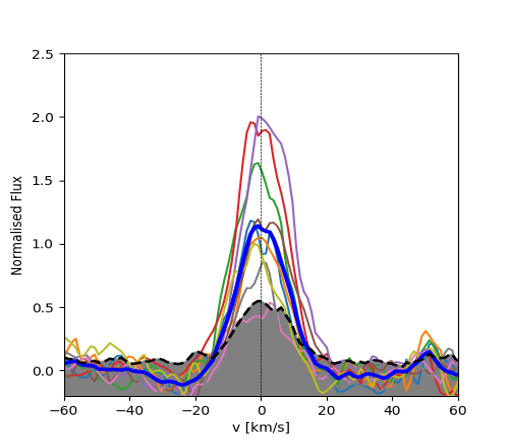
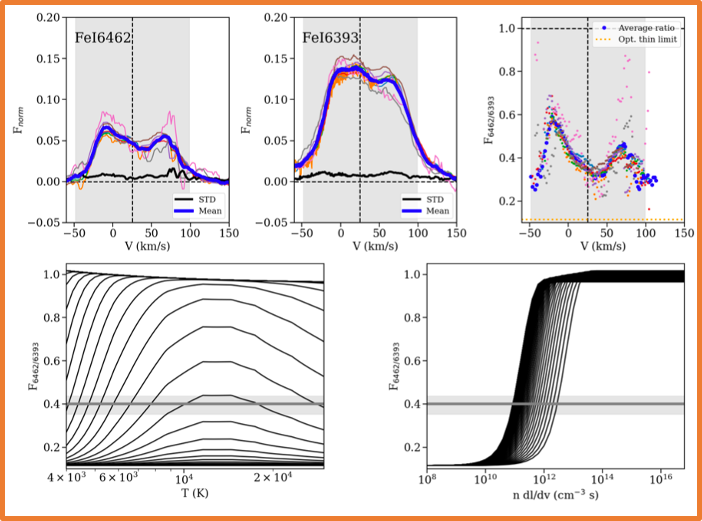
  • Velociy- and time-resolved spectral emission allows us to trace the spatial scale and infer the tomography of the accretion and inner-disk of the stars
  • Using emission-line tomography, we probe the inner-most part of the disk, to scales not possible with direct imaging techniques [1,2,3,4]
  • See poster by Aurora Sicilia-Aguilar et al. for detailed applications of this technique
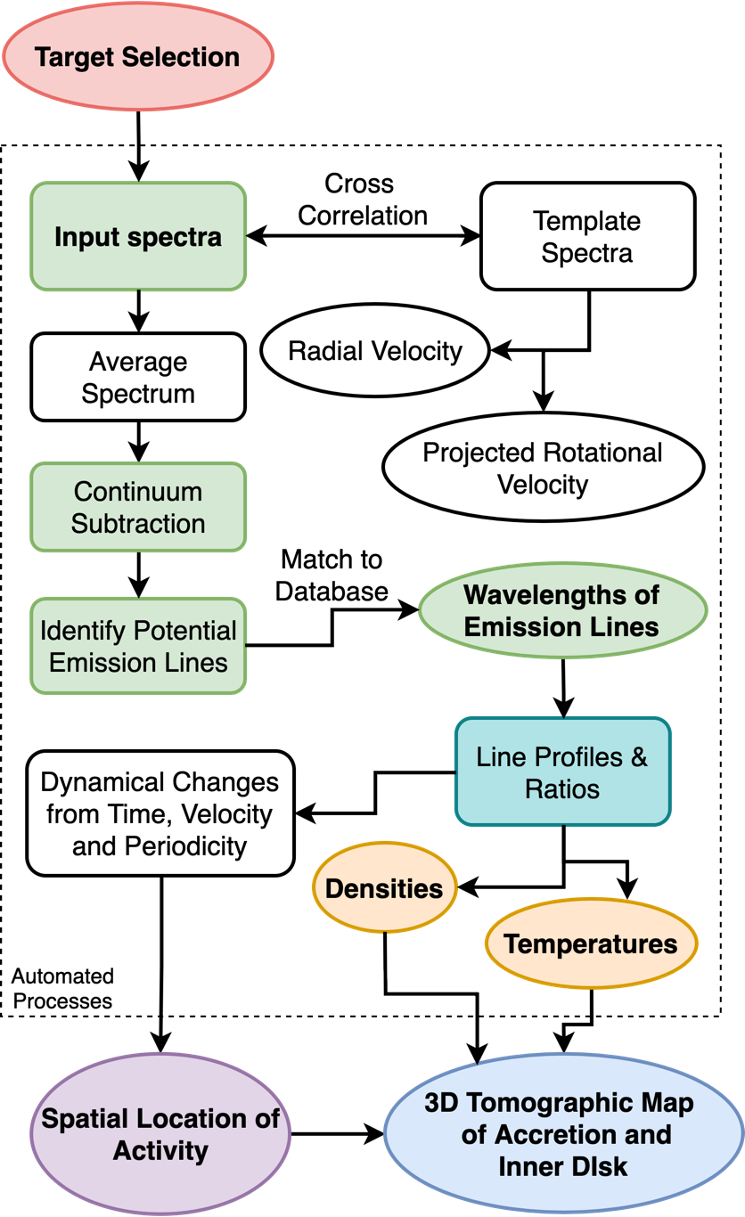
Target Selection

  • We currently have time-resolved data for ∼60 pre-main-sequence stars from archival programs (FEROS, HARPS, ESPaDOnS, OHP, Keck, UVES) 
  • Including late-type classical TTSs and early-type Herbig Ae/Be stars 
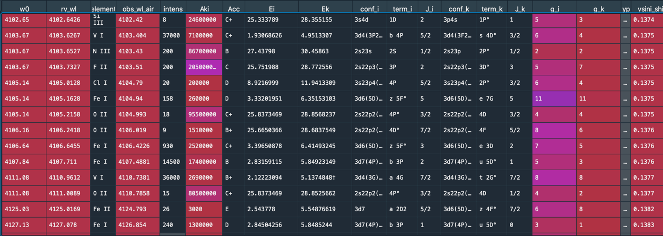
  • Each possesses up to hundreds of emission lines 

STAR-MELT flow chart

Automatic emission line identification

Individual, mean and median spectra for CHXR20 from FEROS (ESO Archive)

Example cross correlation of stellar spectra with template reference star in order to determine radial velocity and rotational velocity

  • From the input FITS files, STAR-MELT extracts the stellar spectral information (flux, wavelength, and errors)
  • The spectral type of the target star is automatically queried from the SIMBAD database
  • The average spectrum is determined and can be used to remove cosmic ray hits and bad pixels
  • Using the spectral type, the spectrum is then cross-correlated with a reference star to determine the radial velocity and rotational velocity, needed for line analysis

The continuum contribution is subtracted to allow for emission-line identification across the entire spectra. 

This is especially important for stars with large continuum contributions

  • Potential emission lines at a given signal to noise threshold are identified
  • Via matching to the NIST database [5], confirmed emission lines are identified
  • From the database, we have energies, transition probabilities, statistical weights, partition functions, all allowing for the calculation of physical properties
  • STAR-MELT utilises widely-used scientific and astronomical python packages such as NumPy, pandas, and astropy
  • Different operation modes allow the code to be initially set up and run completely automatically or in a user-prompt mode allowing for options to be selected ad-hoc

Line fitting, physical properties and tomographic mapping

Example variability of emission line across each temporal observation. Median spectra are shown in blue with RMS in black/grey shaded. 

  • Line profiles are automatically fitted by a Gaussian component and a continuum (baseline) component
  • Option for more Gaussians including negative (absorption) components to be added
  • Bad fits are automatically excluded using a reduced χ2 goodness of fit measure
  • Properties of lines such as integrated flux, width, and asymmetry are calculated for each line
  • This can be carried out for the average spectra, or for each individual observation, allowing for temporal variations to be investigated
  • Using the line components, we can determine the physical properties of the star
  • Ratios of metallic lines from common upper energy levels can be used with the Sobolev large velocity gradient approximation to determine temperatures and densities [1,6]
  • Line profiles are used to determine the origin of the emission lines 
  • The Saha equation with lines from different ionisation levels but from similar line profiles also allow for density and temperature estimation
  • See Z CMa section of e-poster by Aurora Sicilia-Aguilar et al. for further details of this application
  • From the emission-line profiles and time-resolved spectral observations, we are able to infer the structure of the inner disk and accretion channels around pre-main-sequence stars
  • Left: Sketch of the structure around the EXor prototype star EX Lupi in outburst [1]. Broad emission-line profiles with rapid daily variations are indicative of non-axisymmetric structures located at 0.1-0.3 au within the inner-disk
  • Right: 3D reconstruction of the accretion channels of EX Lupi in quiescence [2] from periodic and quasiperiodic modulation of the emission lines
  • See EX Lupi section of e-poster by Aurora Sicilia-Aguilar et al. for further information on these results

Register interest, comments, PDF & References