"Reading between the lines": How time- and velocity-resolved data can help us to map the tiniest scales in young forming stars

Aurora Sicilia-Aguilar 1 , Jerome Bouvier 2 , Min Fang 3 , Justyn Campbell-White 1 , Veronica Roccatagliata 4 , Agnes Kospal 5

  • 1 University of Dundee, United Kingdom
  • 2 University of Grenoble, France
  • 3 Catech, USA
  • 4 University of Pisa, Italy
  • 5 Konkoly Observatory, Hungary

Abstract

What happens in the planet-forming region at the time of planet formation? How are stars like our Sun formed? Observationally-based answers have to deal with one fact: the highest spatial resolution available nowadays barely traces the location of Jupiter in nearby star-forming regions. Thus to gain information on the tiny scales of stellar radii and the innermost planet-forming regions of disks, indirect methods are required.
Emission lines, together with variability, are one of the defining characteristics of young stars. Young stars are rich in emission (and absorption) lines, related to their winds, accretion, spots, and innermost disk gas. Both carry an overwhelming amount of information about accretion and activity processes in the stellar magnetosphere and innermost disk. Using time-resolved, high-resolution spectroscopy covering several rotational and disk orbital periods, we can obtain a detailed view of the structure and variability of accretion columns and spots and information on the presence and launching points of stellar/disk winds in young stars. Time- and velocity-resolved emission (and absorption) line spectroscopy taken at timescales ranging from days to years can trace stellar accretion and the inner disk structure and evolution at scales that are not accessible by direct imaging or interferometry, while time-resolved photometry (ranging from short cadence like K2 or TESS, to long cadence ground-based observations) can help to complete the picture in terms of extinction and global structural changes in the innermost disk environment.
We present the results of using time-resolved data to disentangle the innermost structure of young variable stars with spectral types ranging from M to B, including outbursting stars (e.g. EX Lup, ZCMa) and others suffering variable, quasiperiodic extinction (e.g RX J1604.3-2130). Understanding these processes and how they affect the observed spectra can also help us to identify (or rule out) the presence of newly-formed planets and stellar companions that may be perturbing the disk, distinguishing the spectral and photometric signatures of planets from those related to stellar variability and the variable structure of the inner disk, and also to explore the causes of variability in young and wild stars.

What line emission tells us about young stars

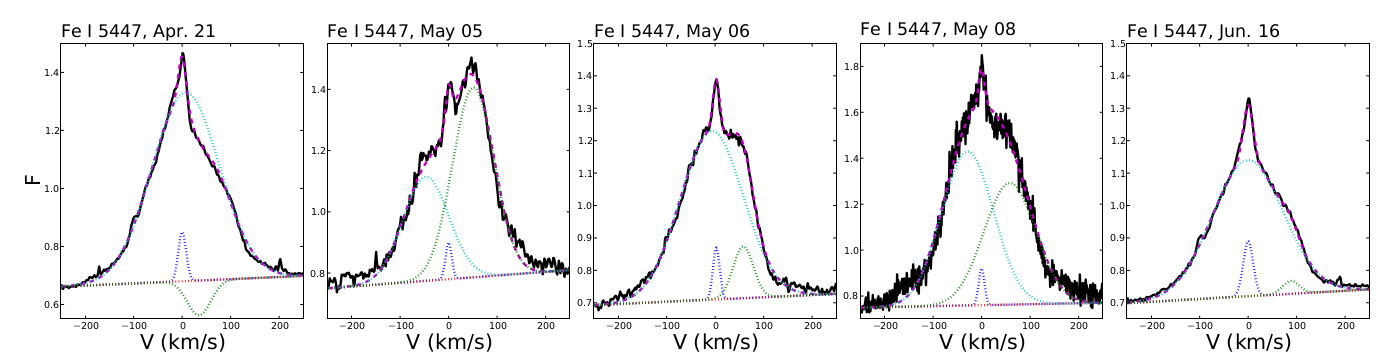
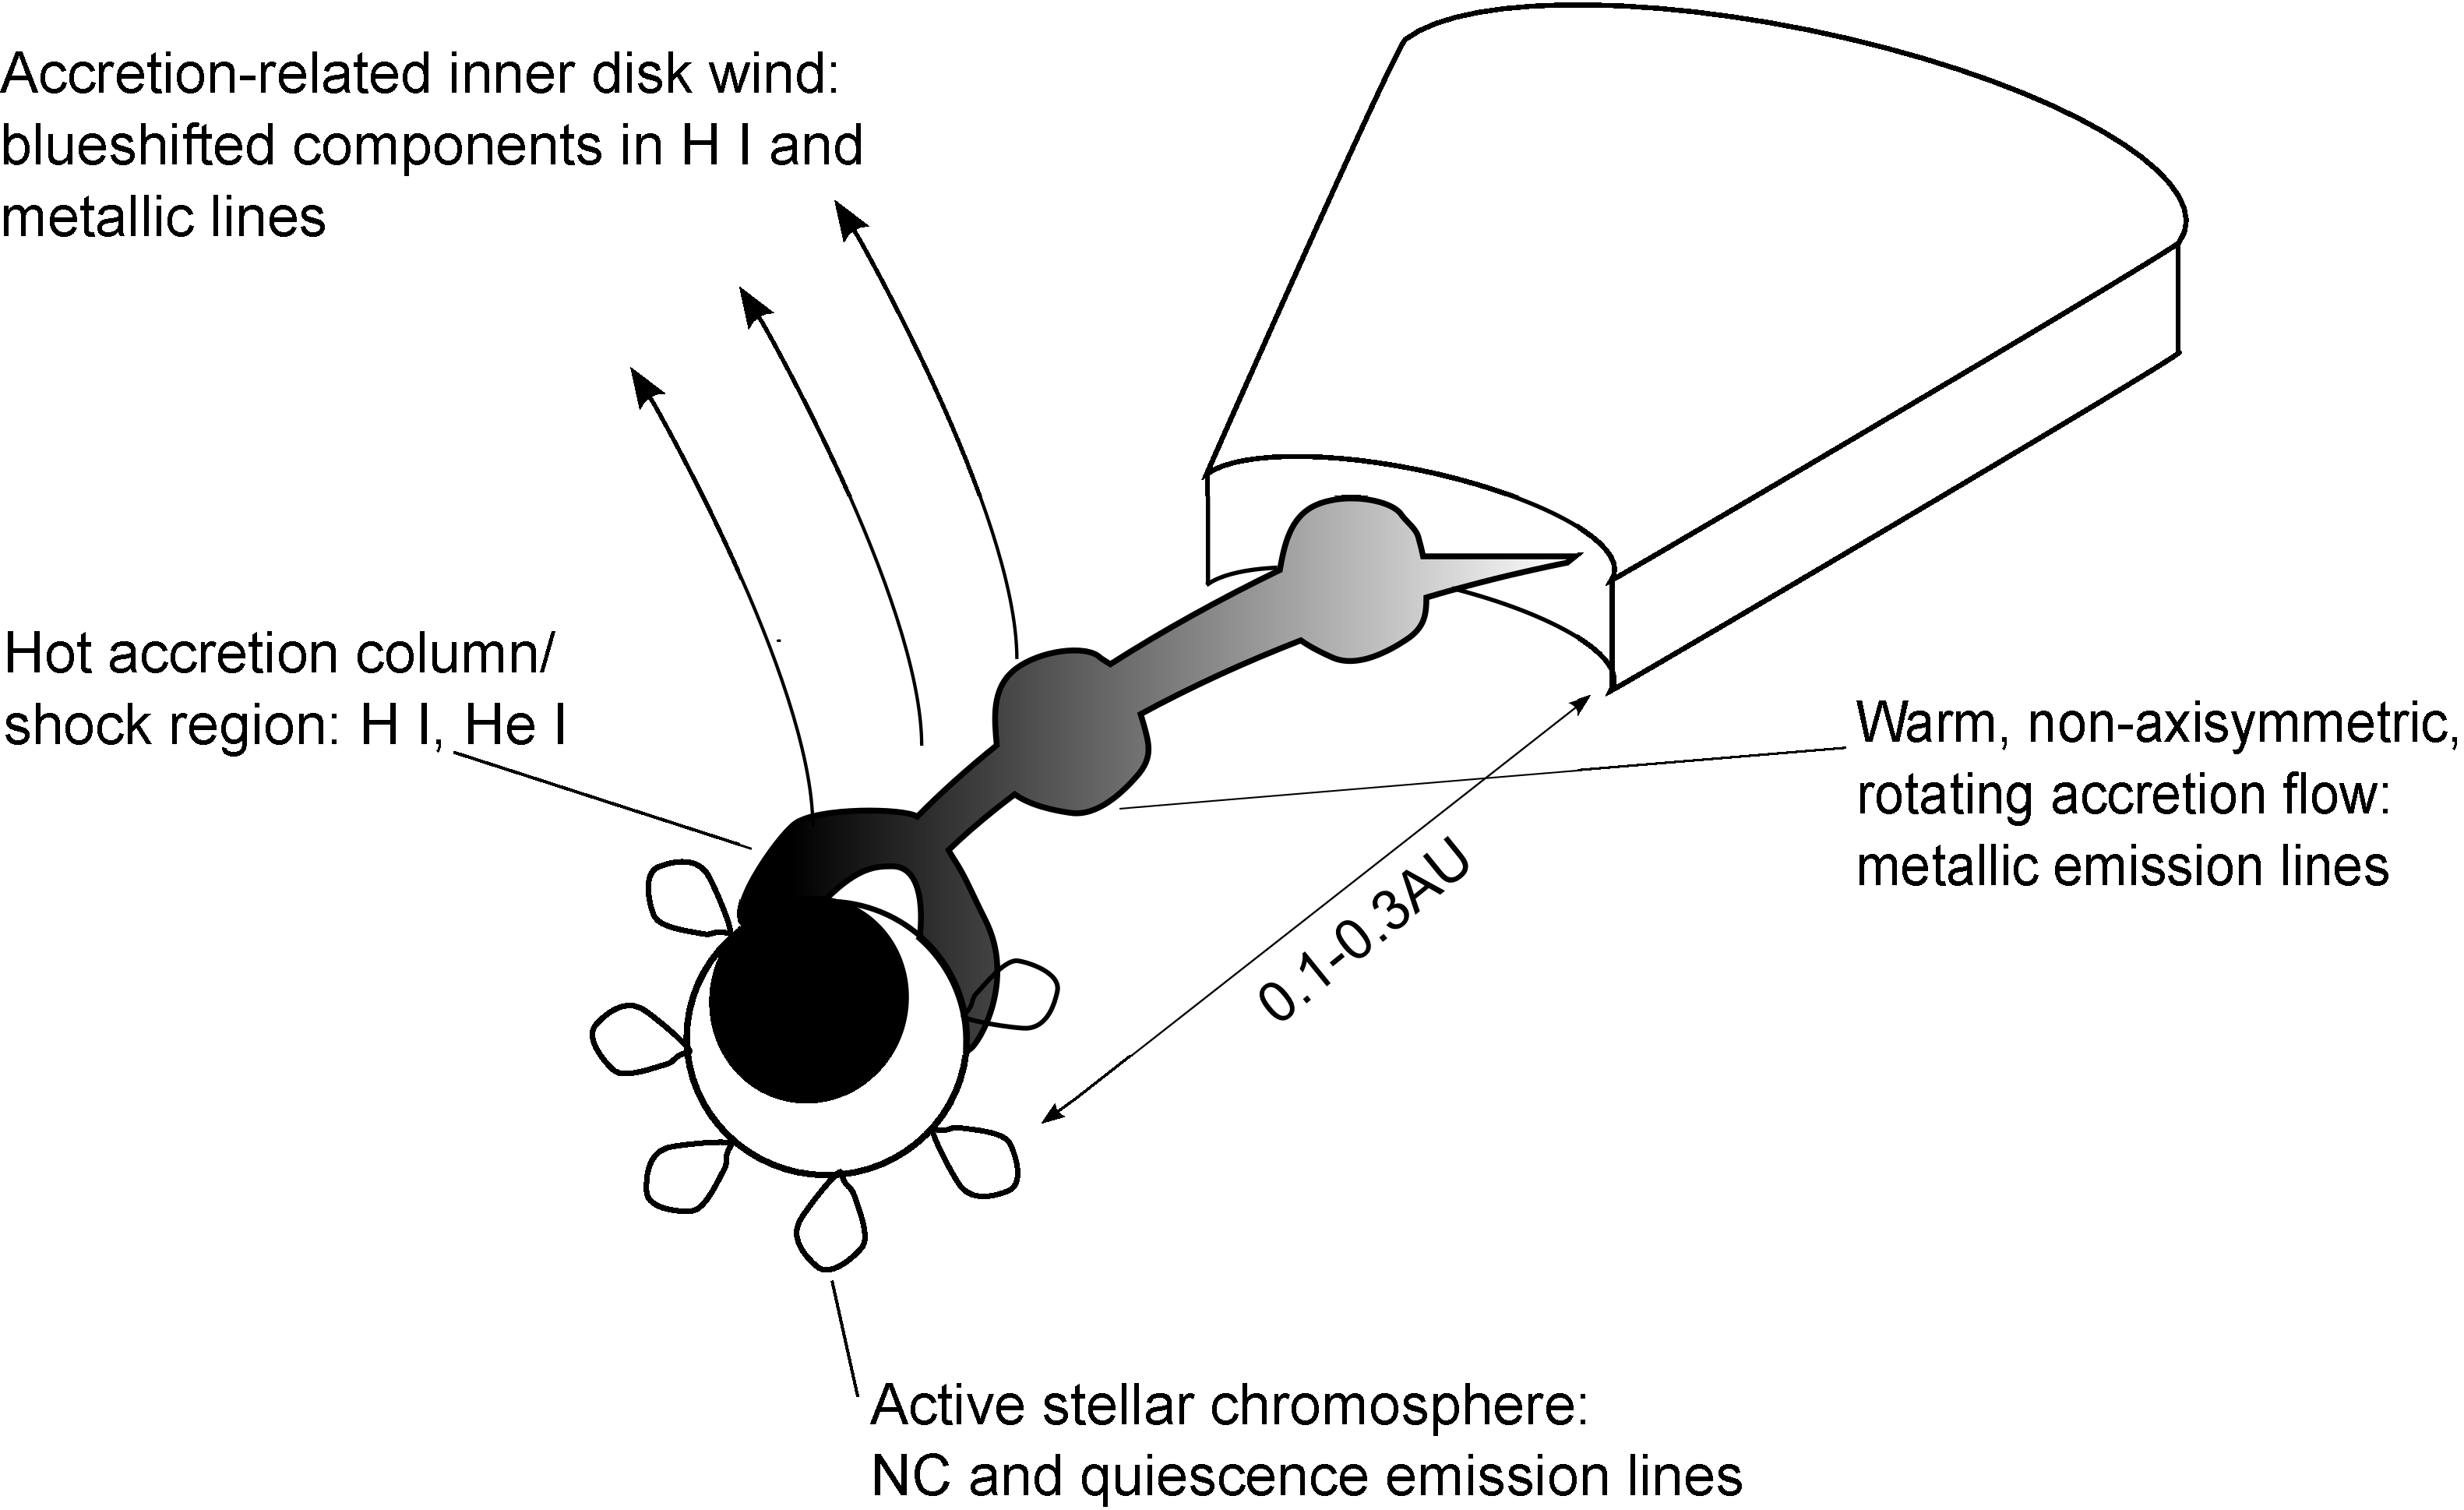
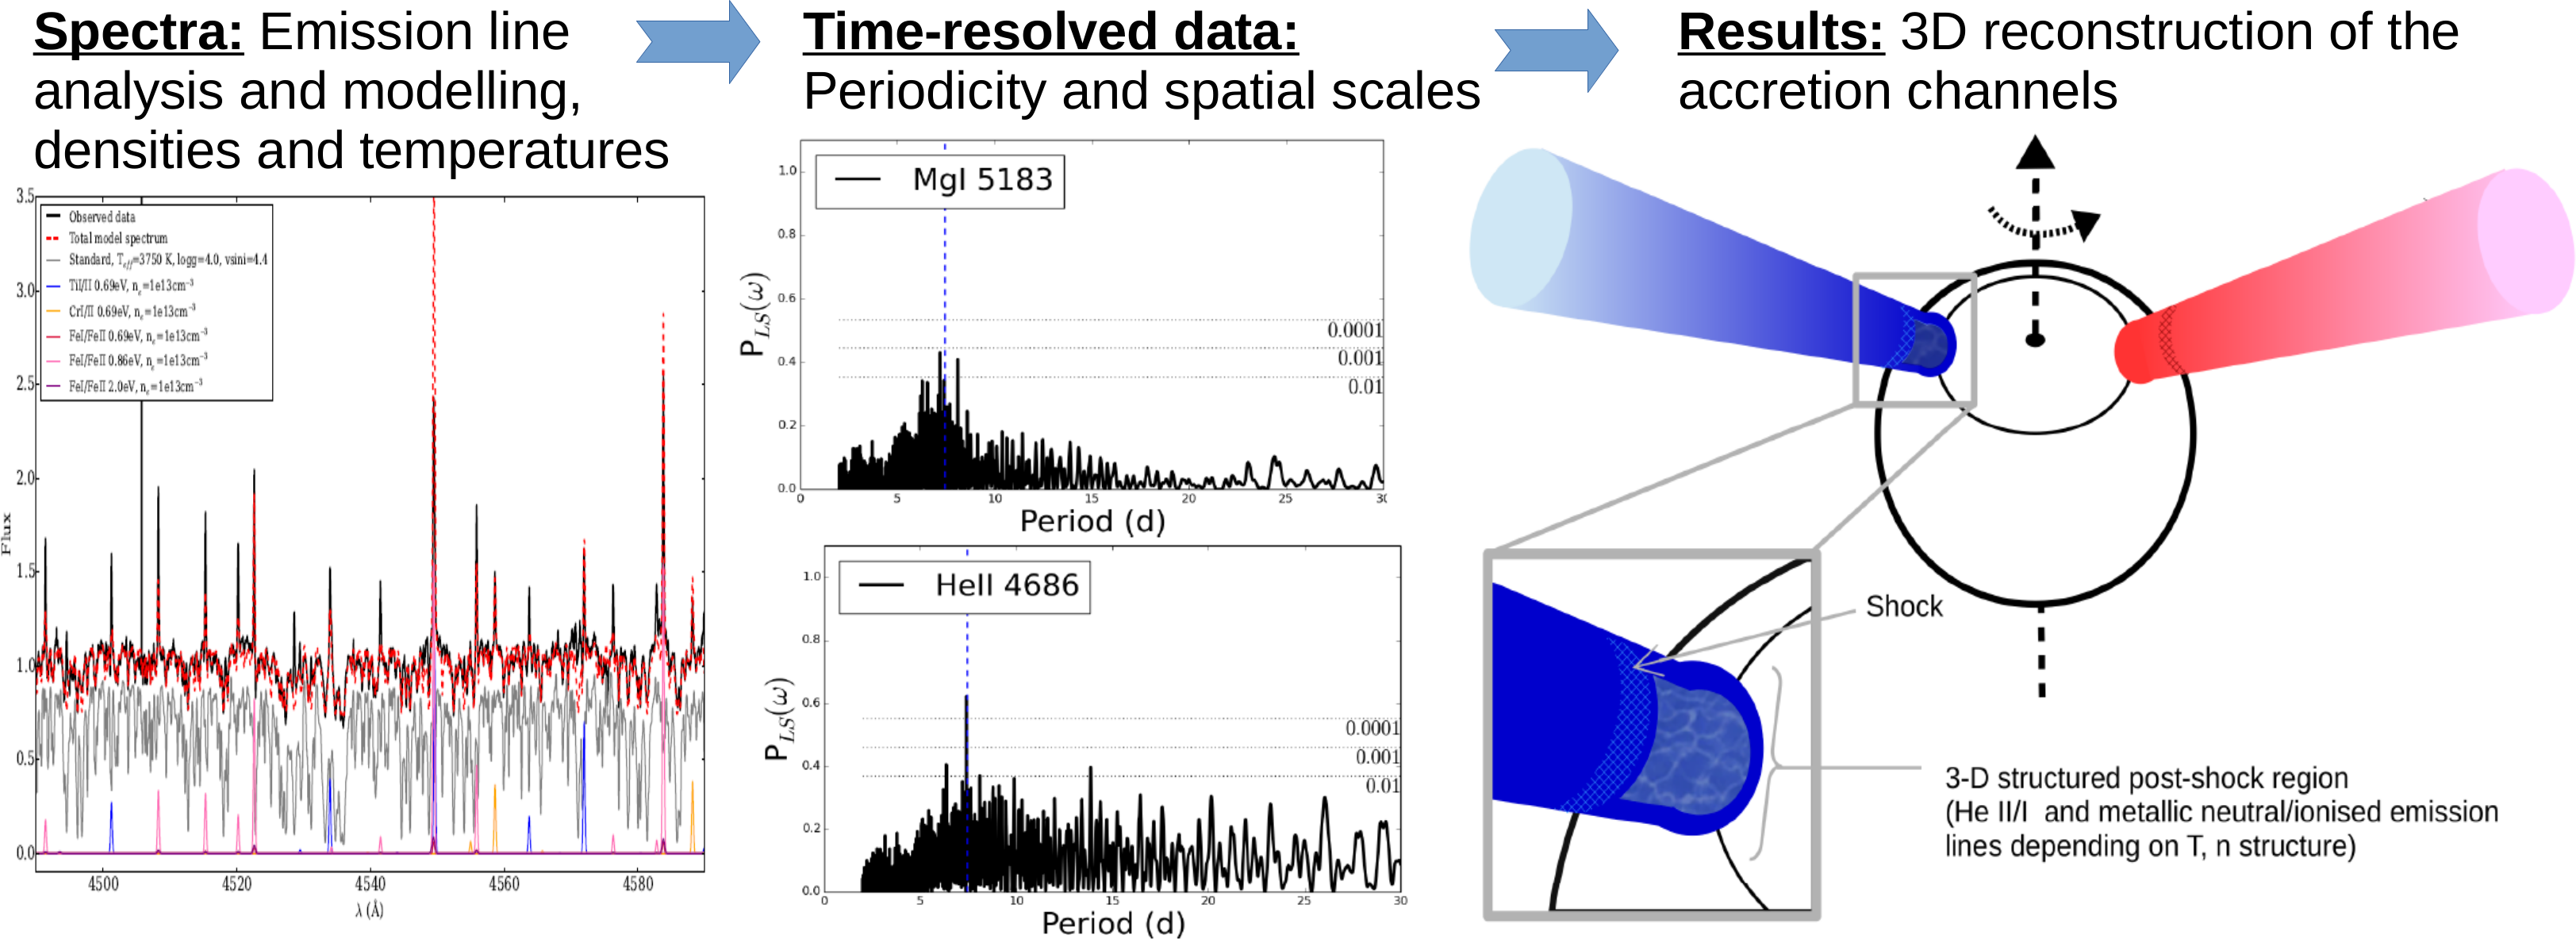
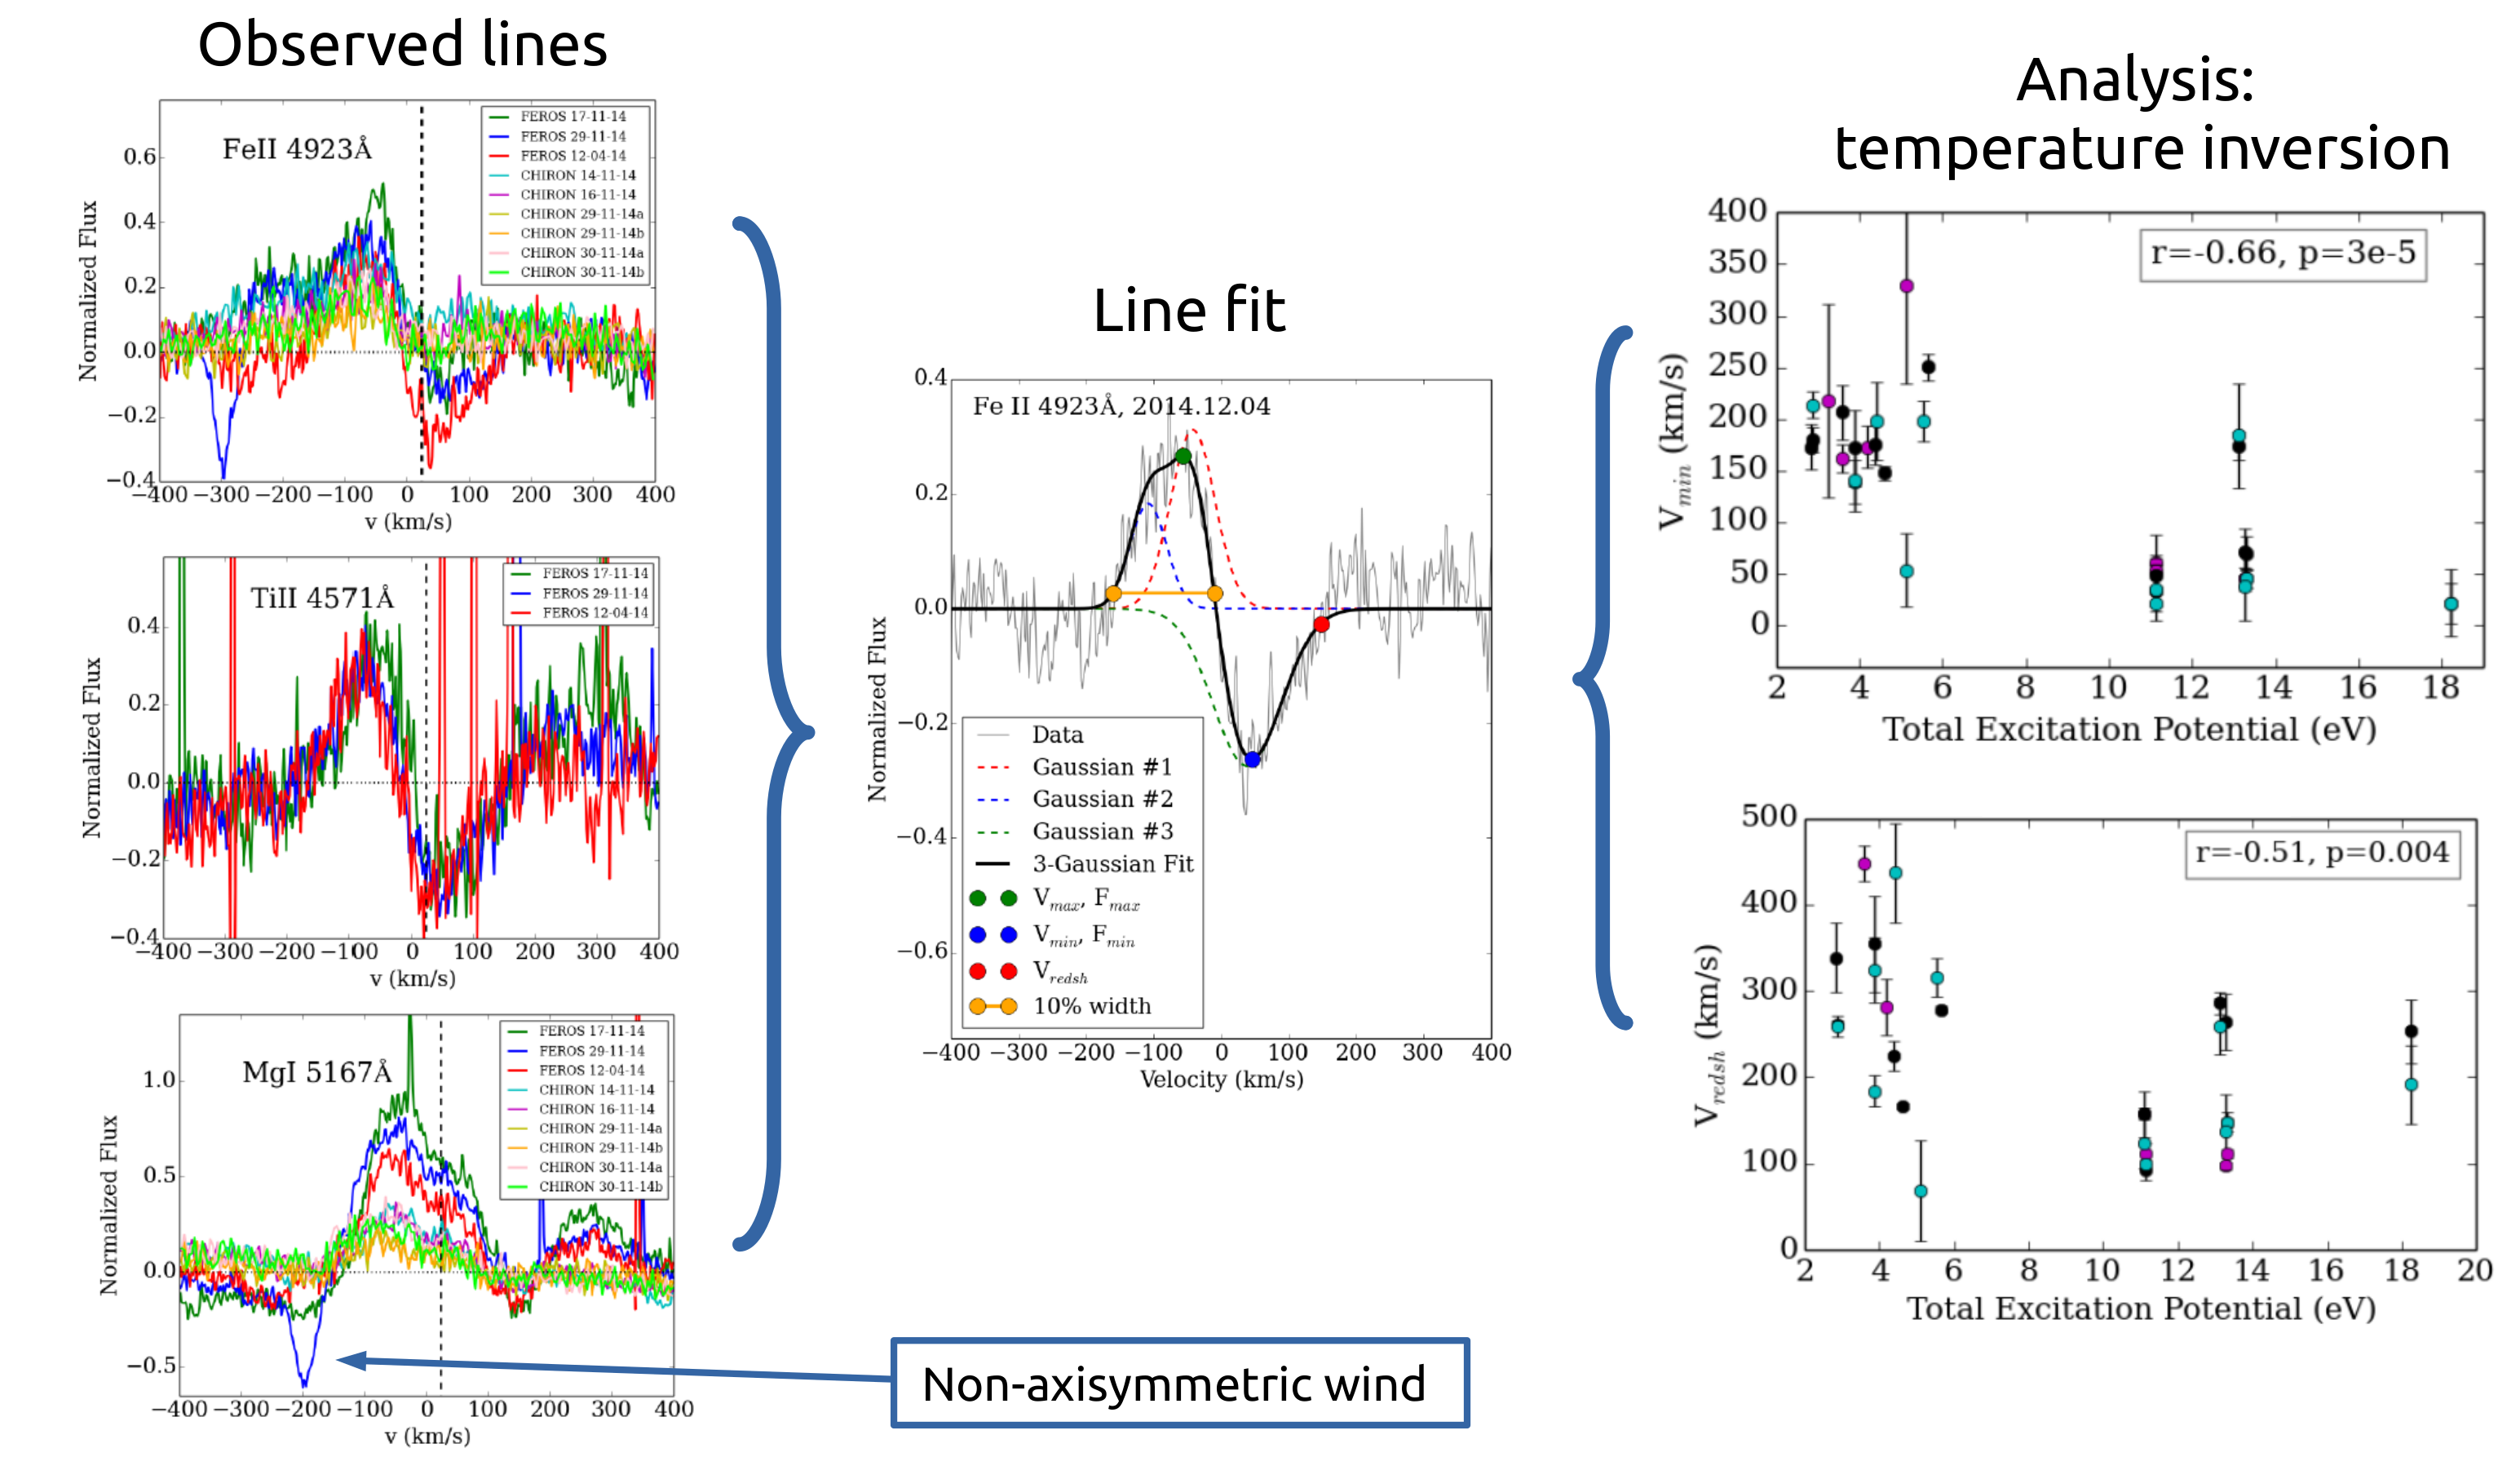
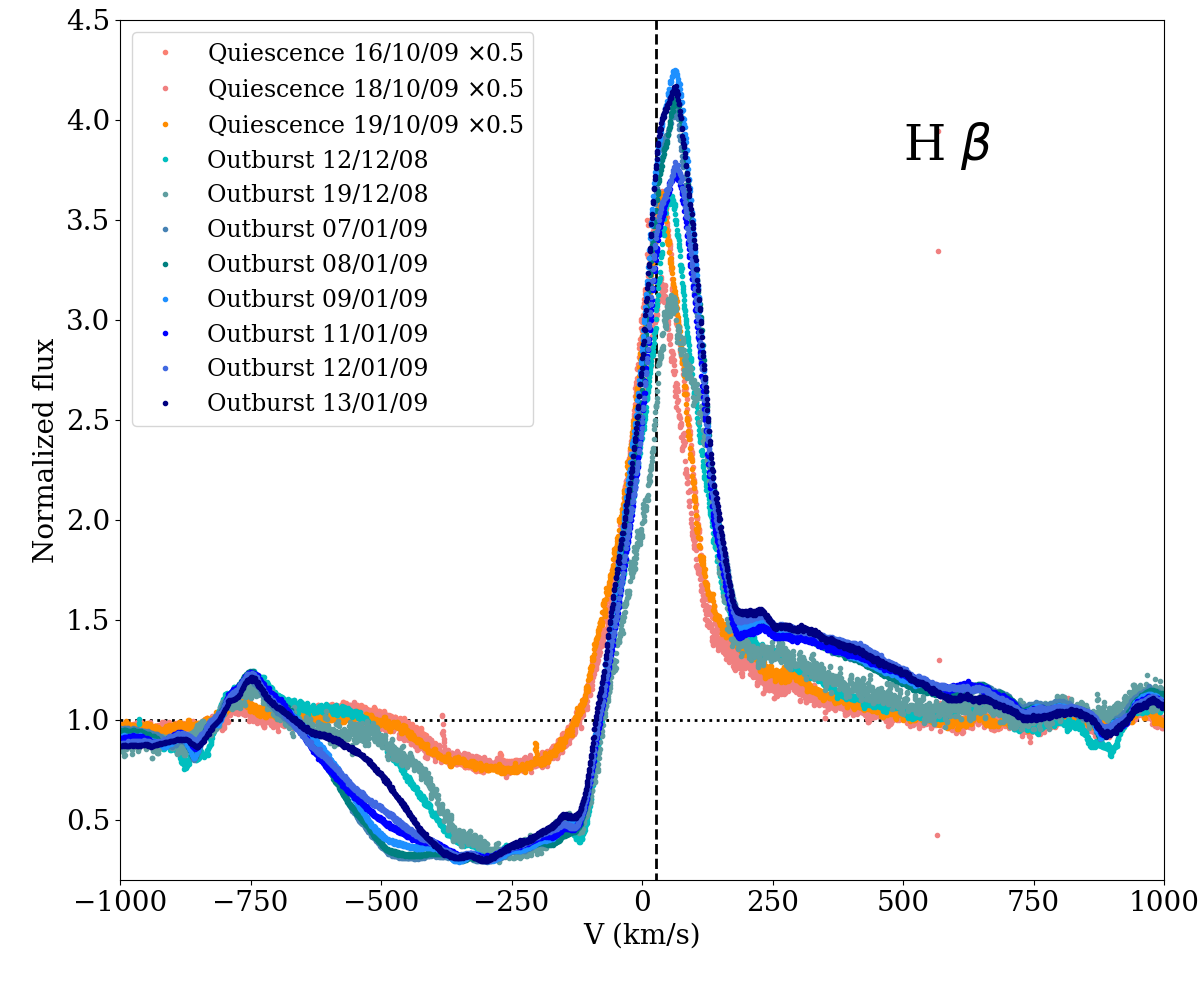
Young, pre-main sequence T Tauri and Herbig AeBe stars are known for their characteristic emission line spectra, with narrow and broad profiles and often, absorption features characteristic of winds and infall. The most prominent lines, such as the Balmer Hydrogen series, are very complex and result from combined emission and absorption in many different locations around the star. But young stars have also many metallic lines, including Fe I, Fe II, Ti I, Ti II, among others. These lines are many and may be excited under a large range of energies and densities. Combined with velocity-resolved and time-resolved spectra, emission (and absorption) line tomography can provide valuable information on the properties of the stars at spatial scales that cannot be resolved by other means.

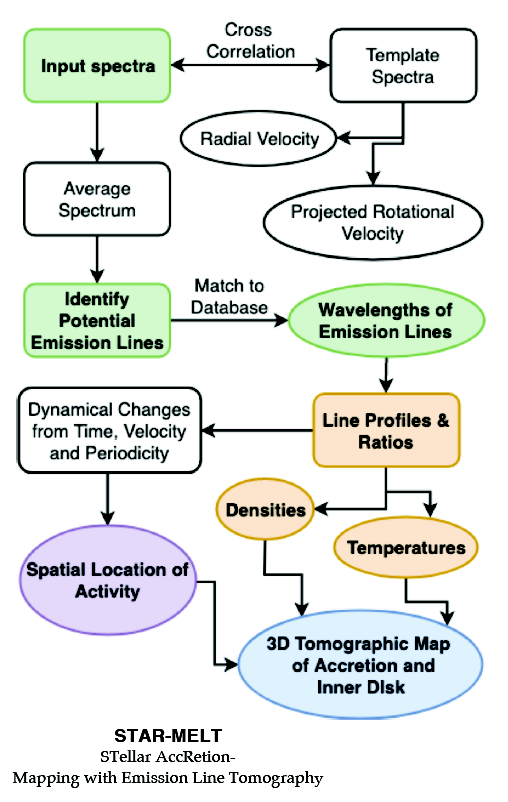
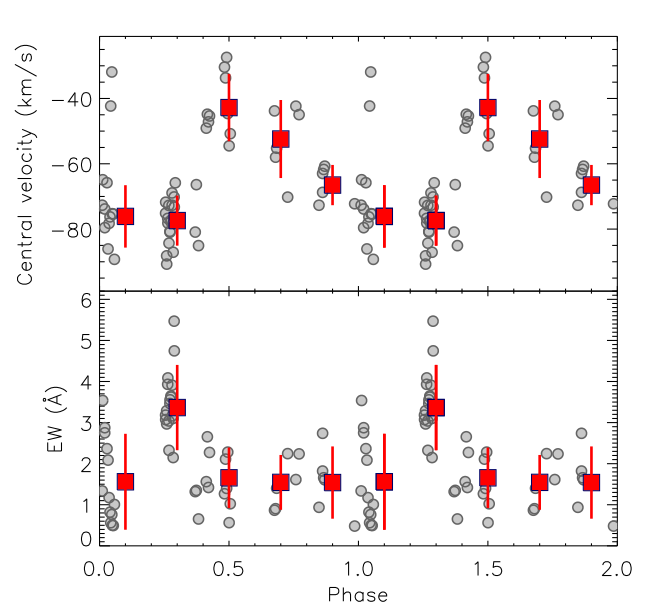
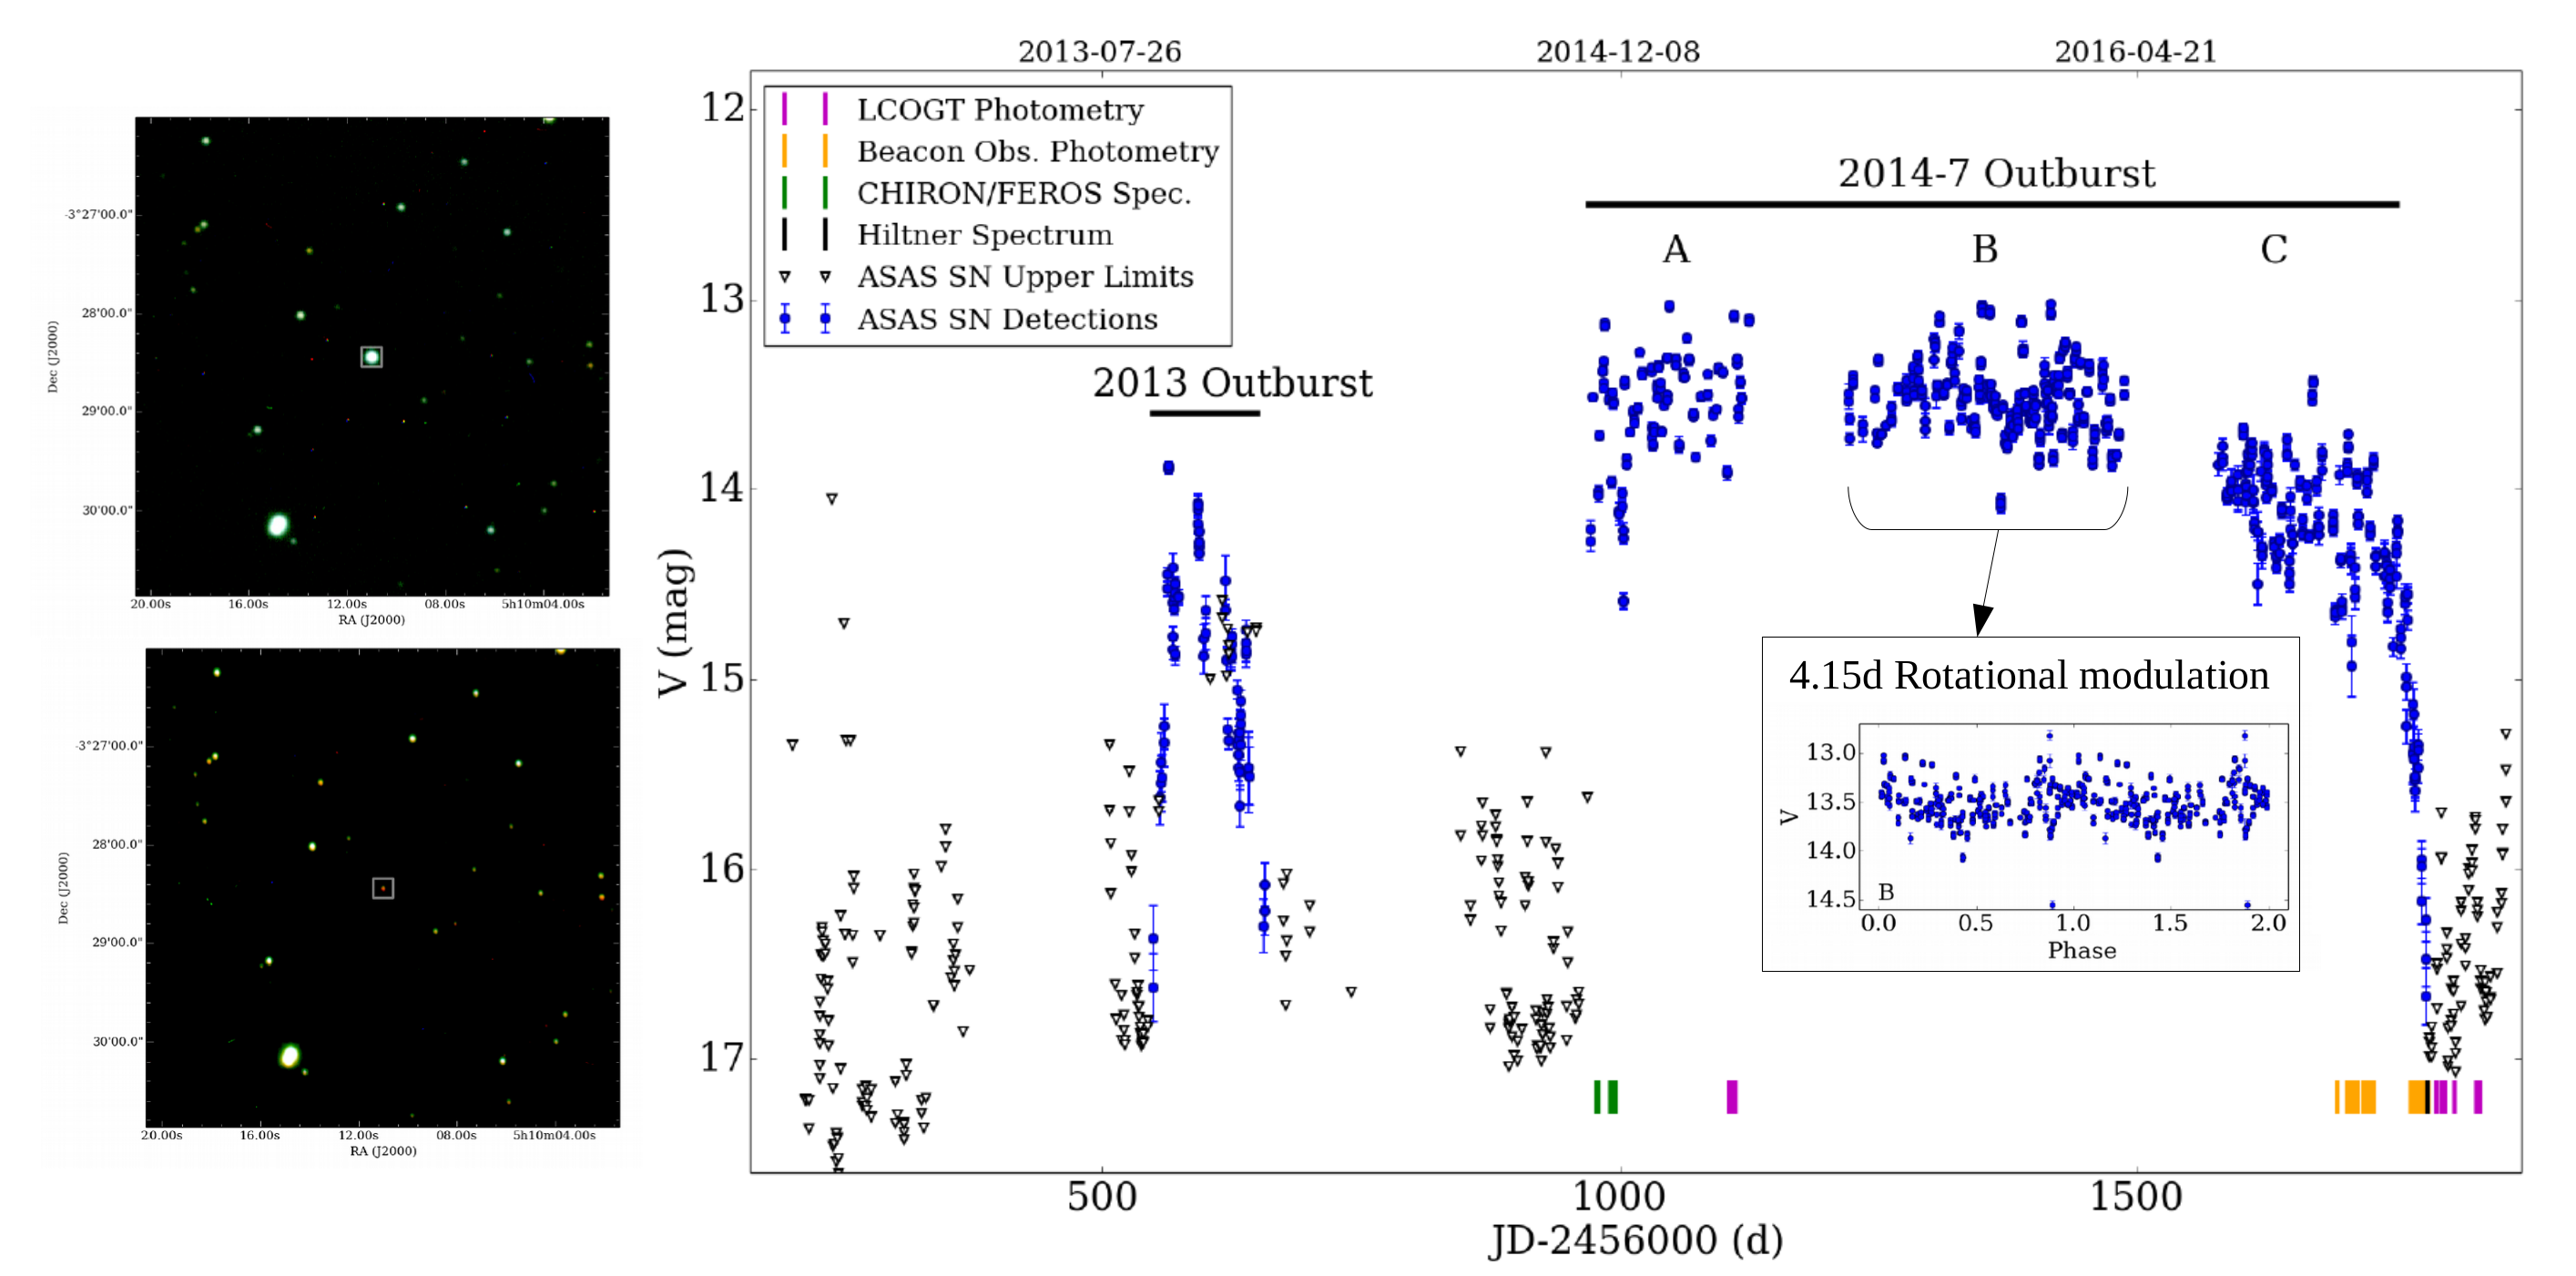
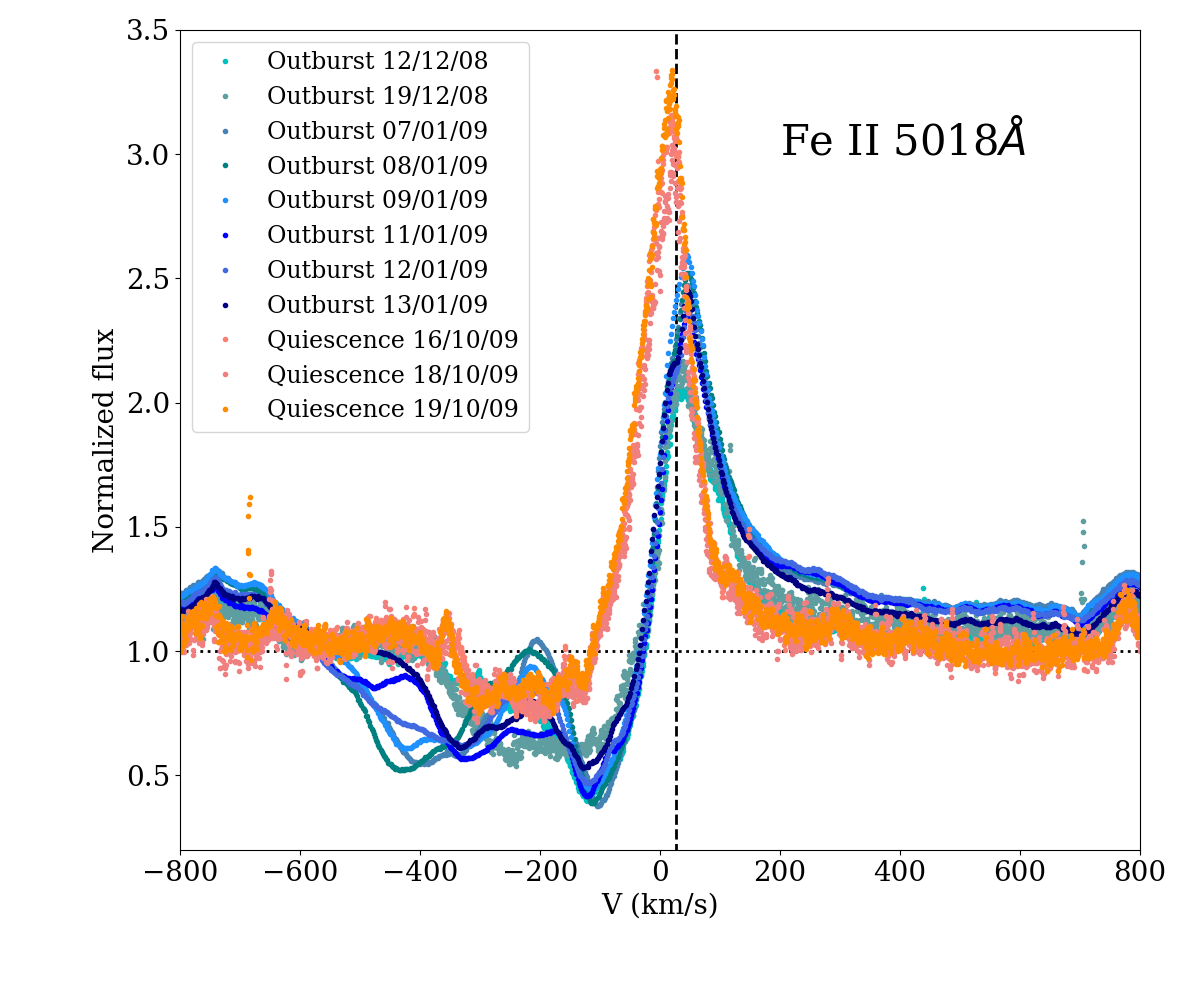
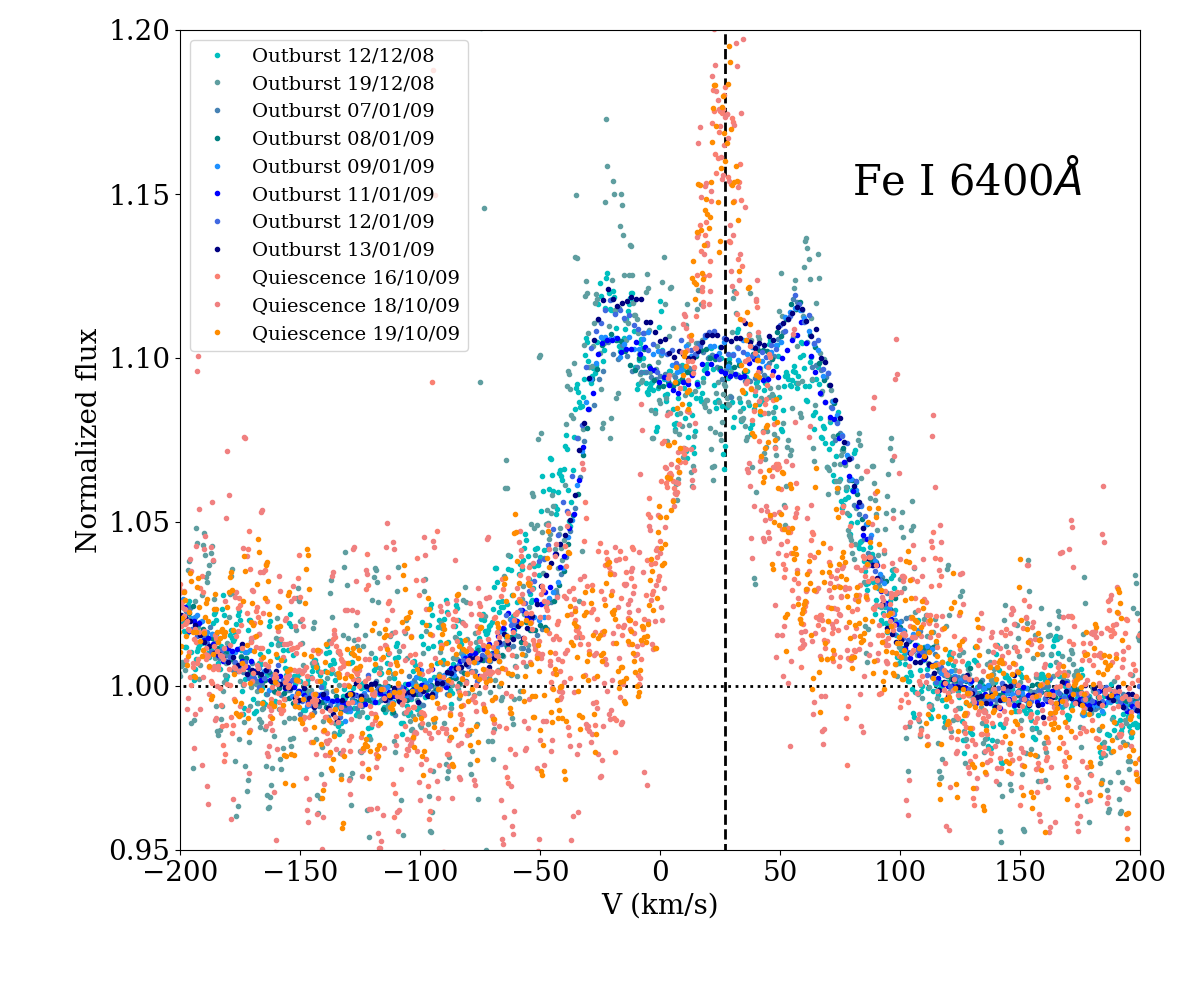
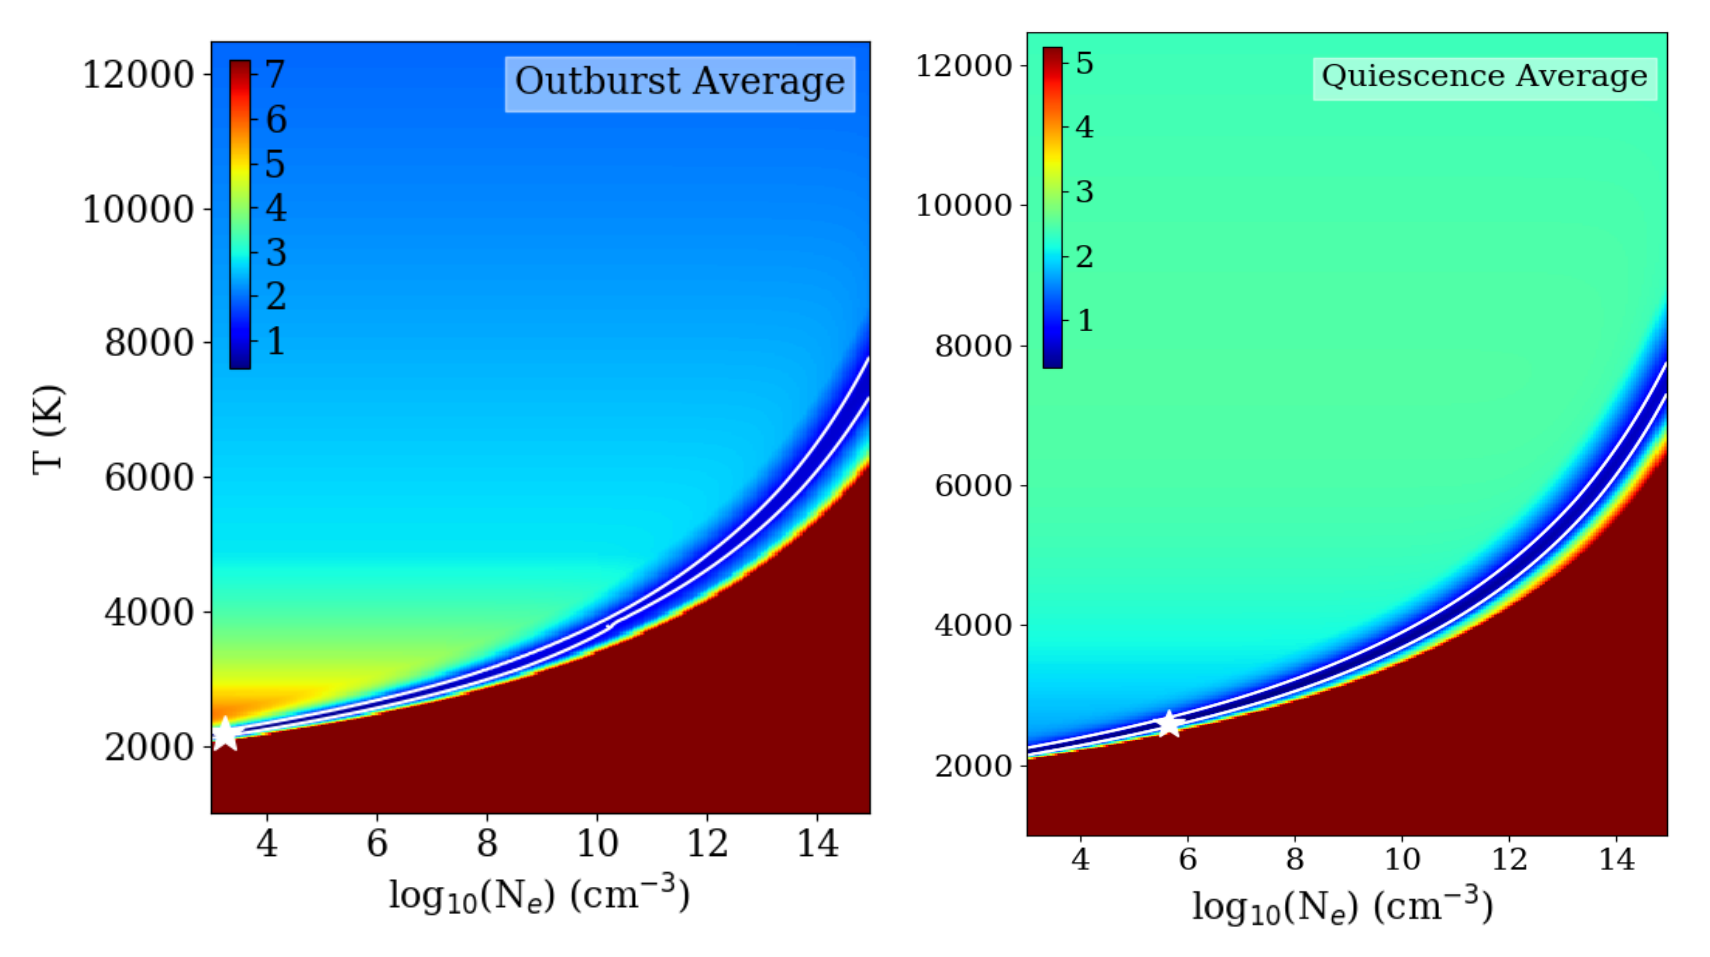
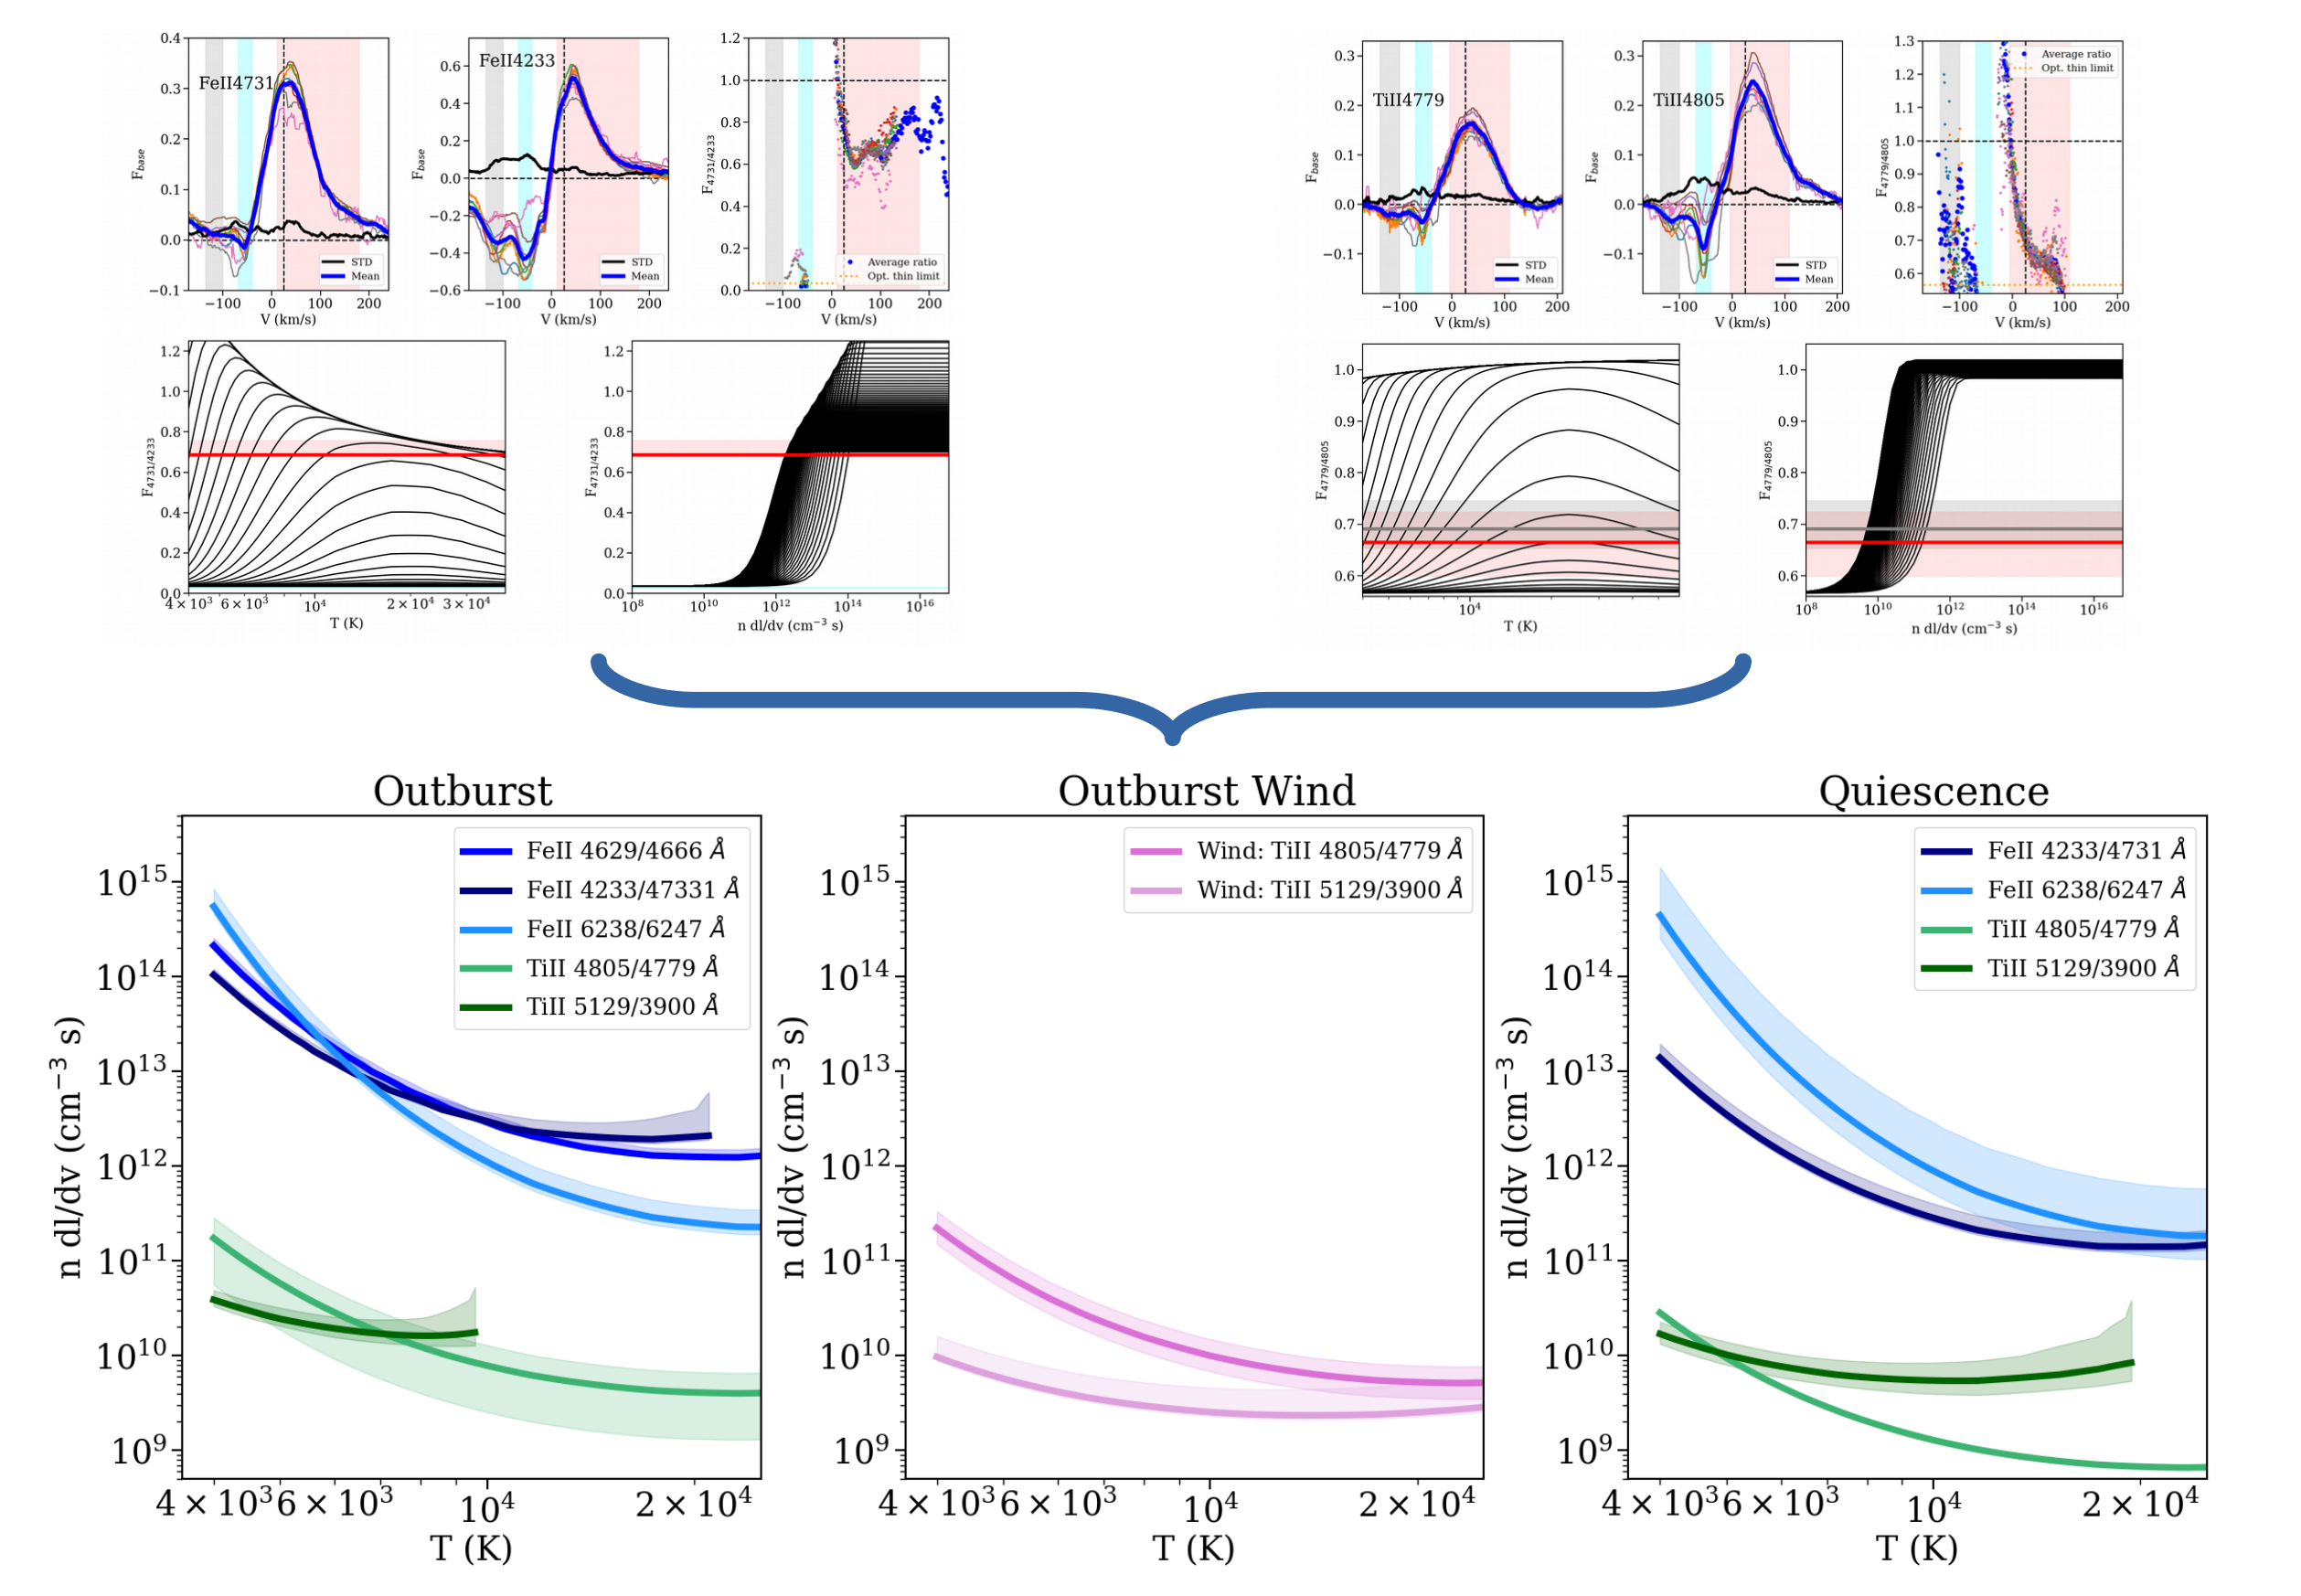
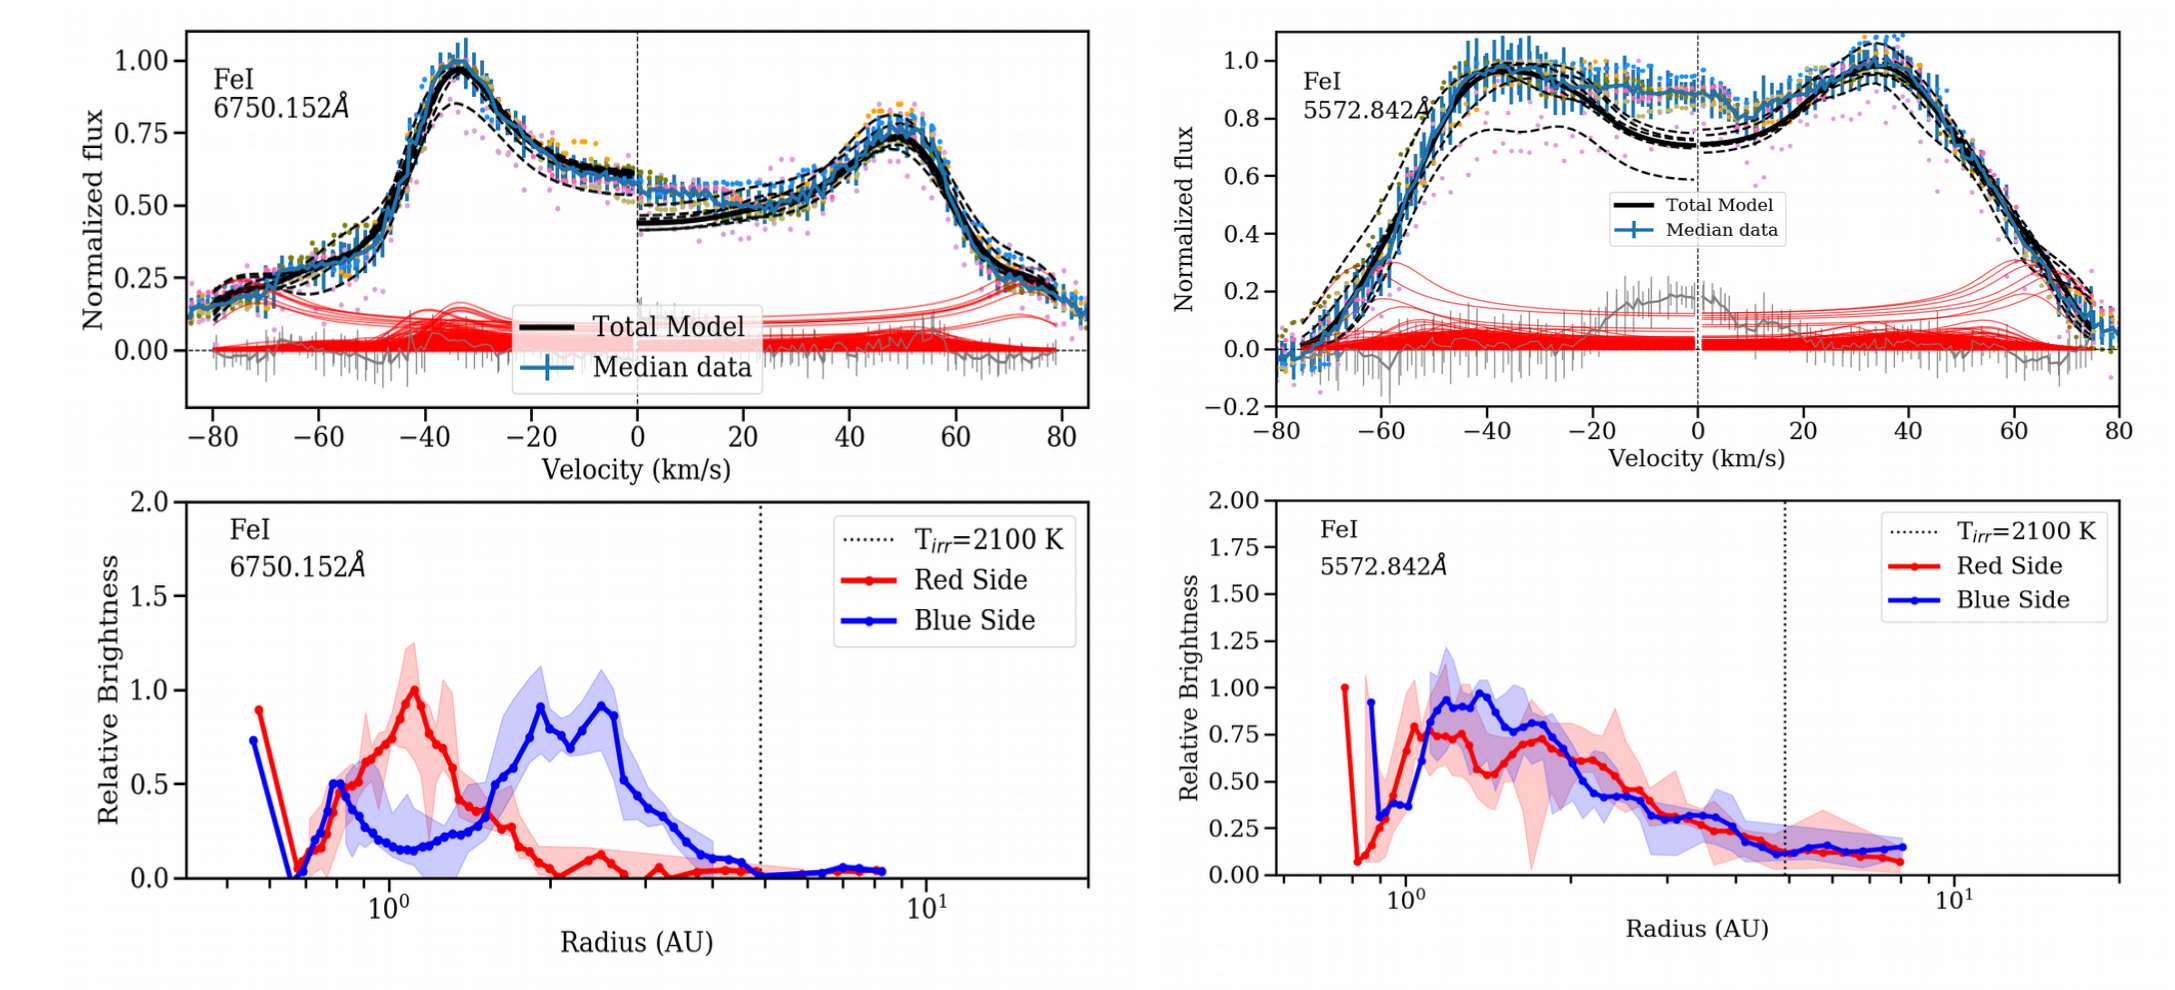
Different methods can be used to analyze the lines. First, velocities and timescales can be converted into spatial scales, providing information on the location at which the variability phenomena are observed (e.g. Dupree et al. 2012, Sicilia-Aguilar et al. 2020). Comparing lines of ionized and neutral species can be used to constrain the densities and temperatures using the Saha equation. The line ratios of lines that originate from the same velocity structure and share an upper level can offer further constraints that are independent of the way the levels are populated (Beristain et al. 1998).

In this poster, we show what we have learn about the innermost structures of several stars with different masses and properties applying this methodology.


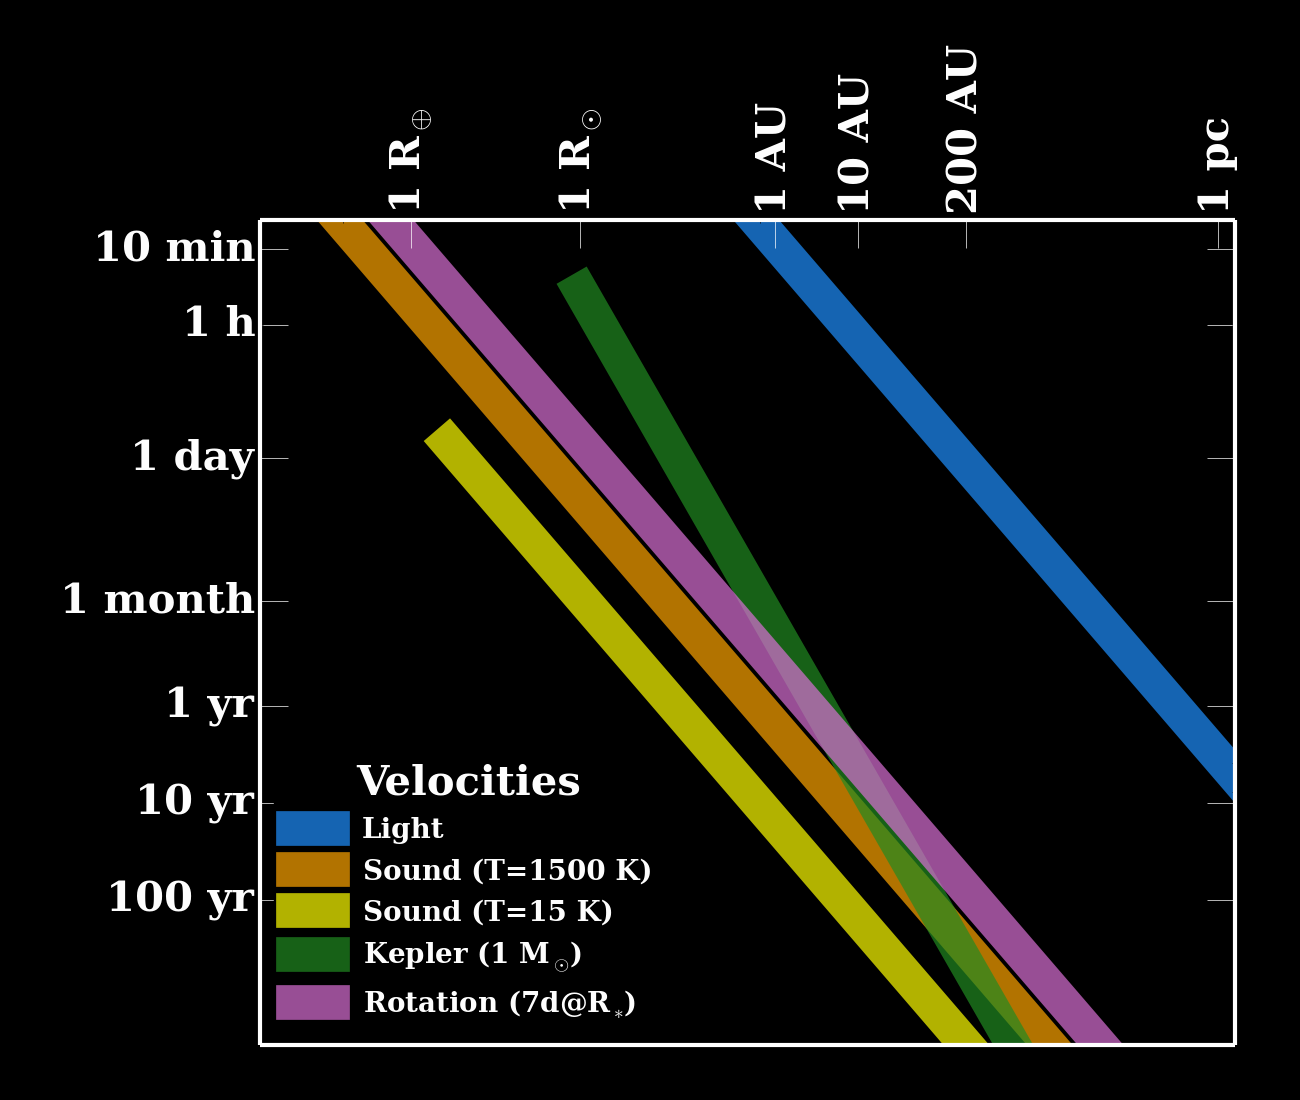
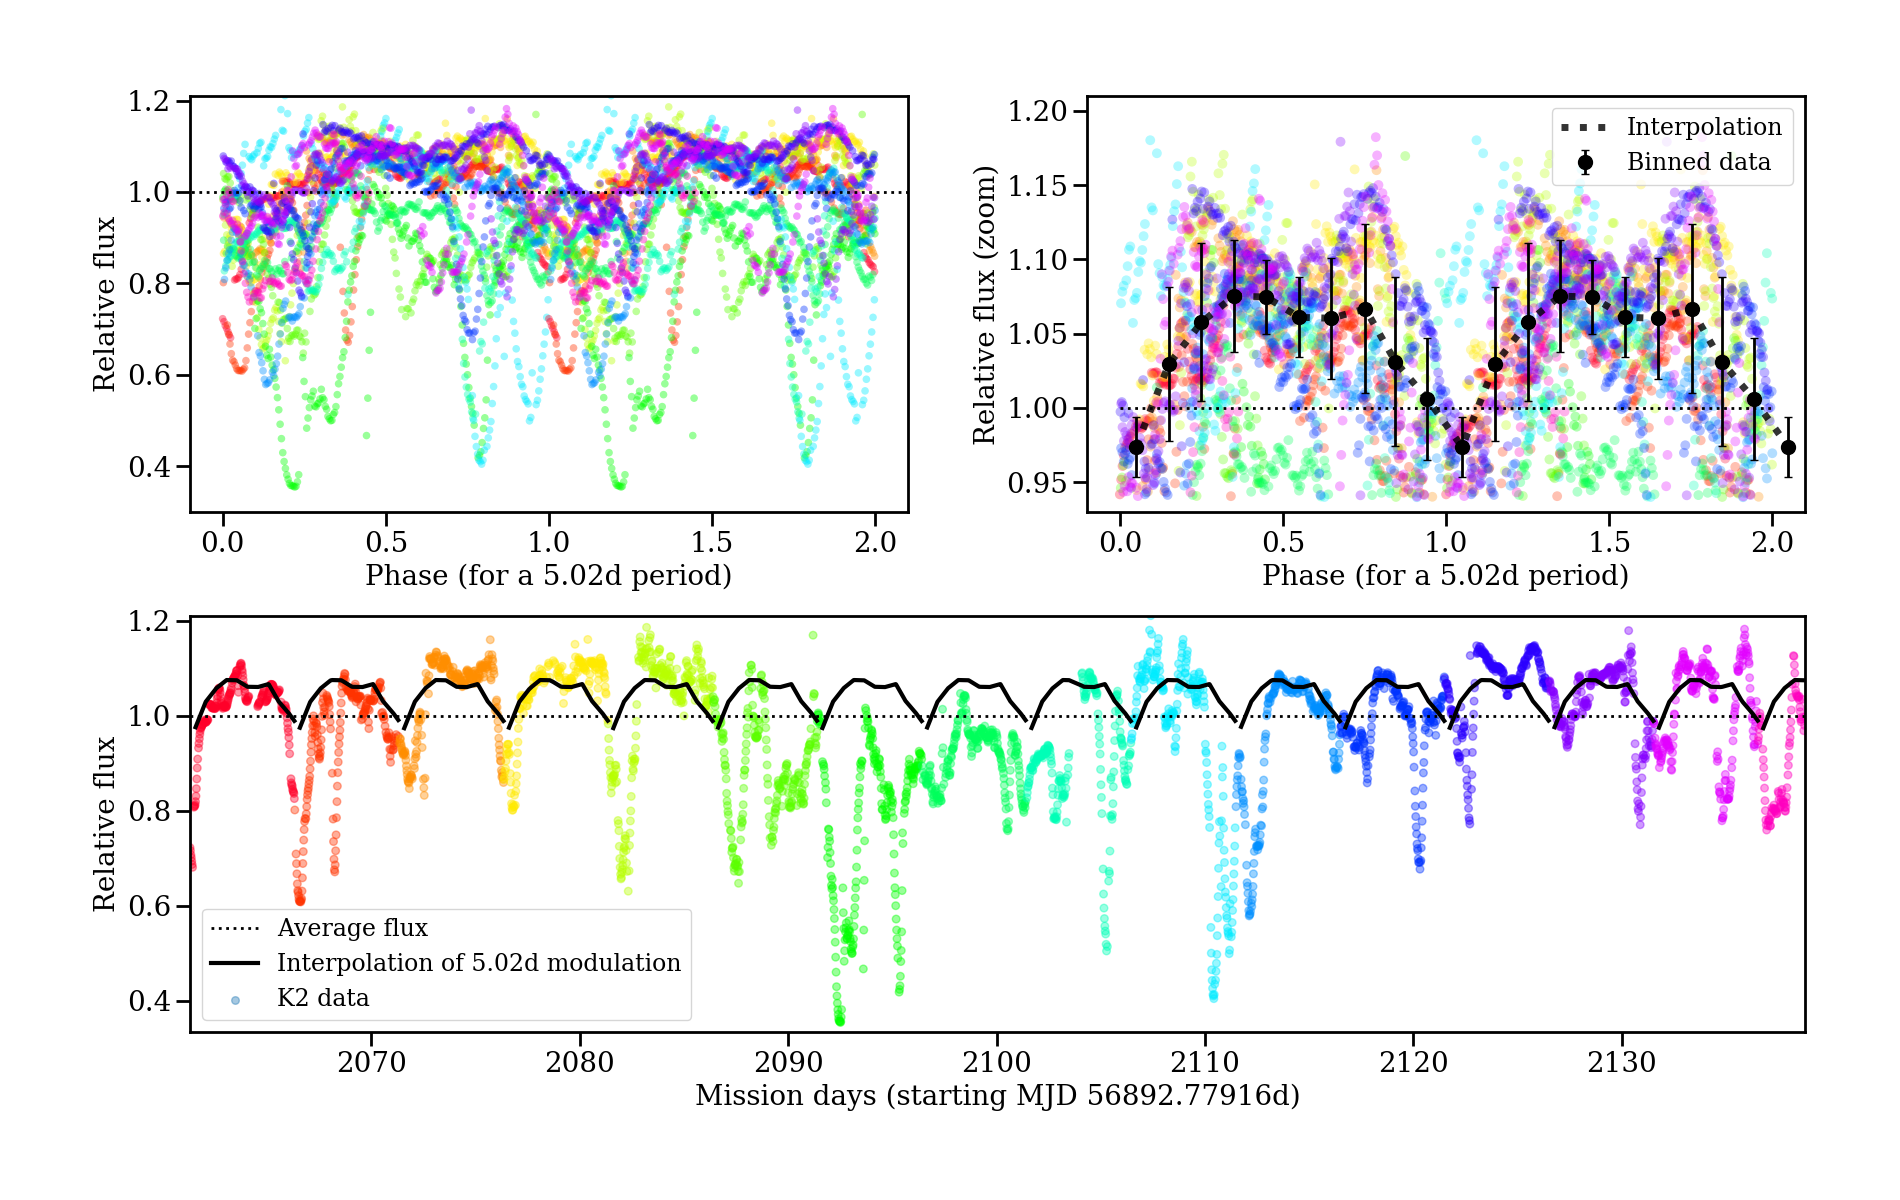
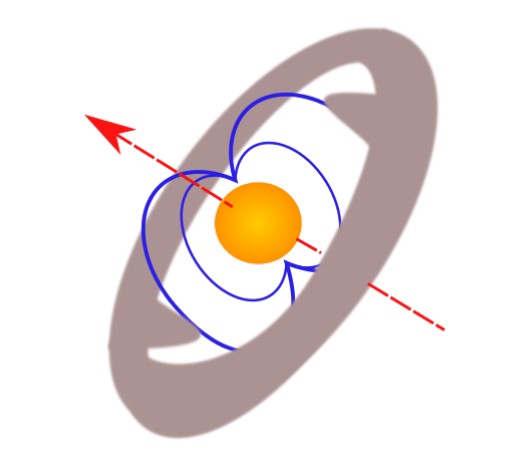
Figure on the right: Given a velocity, time resolution can provide spatial resolution. For optical spectra that trace material at the star or very close to it, the timescales of variability are typically days and can be used to map the structures around the forming star, including accretion columns, winds, and the innermost disk.

STAR-MELT: Analyzing time- and velocity-resolved spectra

With support from the STFC Consolidator grant, we are now developing an automated code, STAR-MELT, to extract, fit and analyze the emission line data from time- and velocity-resolved spectra of young stars (Campbell-White et al in prep).

STAR-MELT identifies, extracts and classifies the emission lines of the spectra, provides a basic analysis of the line profile and velocity (including time-resolved and periodicity information, if enough data are available) and uses similar procedures to those explained above for the various case studies to derive physical conditions (temperatures, densities, velocity structure and location) from the observed emission lines.

The code will be made publicly available as a Python package at the end of the project. See more details in the poster by Justyn Campbell-White.

References and contact

If you have any questions or would like to be kept up to date with this research, please let us know here.

This work summarizes the results of several publications with various authors that appear in the following reference list. For detailed information, have a look at the team's papers marked with *. The main line emission analysis project is supported by STFC Consolidated grant ST/S000399/1.

Abraham, Juhasz, Dullemond, et al. 2009 Nature, 459, 224

Berger, Monnier, Millan-Gabet, et al. 2011 A&A 529, L1

Beristain, Edwards, & Kwan 1998 ApJ 499, 828

* Campbell-White, Sicilia-Aguilar,  et al. in prep.

Dupree, Brickhouse, Cranmer, et al. 2012 ApJ 750, 73

* Fang, Sicilia-Aguilar, Roccatagliata,  et al. 2014 A&A 570, 118

Herbig 2008, AJ 135, 637

Holoien, Prieto, Stanek, et al. 2014, ApJ 785, 35

Luhman & Mamajek 2012, ApJ 758, 31

Pinilla, Benisty, de Boer et al. 2018 ApJ 868, 85

* Sicilia-Aguilar, Kospal, Setiawan, et al. 2012 A&A 544, 93

* Sicilia-Aguilar, Fang, Roccatagliata, et al. 2015 A&A 580, 82

* Sicilia-Aguilar, Oprandi, Froebrich, et al. 2017 A&A 607, 127

* Sicilia-Aguilar, Manara, de Boer, et al. 2020 A&A 633, 37

* Sicilia-Aguilar, Bouvier, Dougados, et al. submitted to A&A

EX Lupi: Very stable accretion columns in the EXor prototype

EX Lupi is the EXor prototype of irregular, variable young stars (Herbig 2008). After suffering a major outburst in 2008, it has become a key target to study the development and causes of accretion outbursts, as well as the consequences that they could have for forming planetary systems (Abraham et al. 2009). Observations and emission line analysis reveal very stable accretion columns suggestive of a strong and stable magnetic field that may overregulate the accretion of material between the disk and the star, and may also be related to the outbursting behavior (Sicilia-Aguilar et al. 2015).

Wind and non-axisymmetric accretion in outburst

The broad emission lines observed in EX Lupi during the 2008 outburst showed profiles with a rapid, day-to-day variation consistent with non-axisymmetric structures located at 0.1-0.3 au within the inner gaseous disk, as shown above for one of the Fe I lines observed.

A sketch of the structure around EX Lupi in outburst, including non-axisymmetric, extended accretion structures with a time and velocity modulation that suggests an origin at 0.1-0.3 au (Sicilia-Aguilar et al. 2012).

Very stable accretion columns in quiescence

EX Lupi spectra in quiescence still reveal hundreds of narrow emission lines. These lines show a periodic or quasi-periodic behavior that can be traced to structures on the accretion columns. High-energy, high-density lines (such as He II or Fe II) are more periodic and appear to originate on small regions near the stellar surface, likely related to the shock and post-shock regions. Lower-energy lines (e.g. Fe I, Mg I) are quasiperiodic and appear to originate in more extended (either vertically, or on the stellar surface) locations. Differences in phase reveal trailing structures. The accretion columns appear very stable over several years and before and after an eruption, suggesting that magnetic fields must be strong and may be "overcontrolling" accretion, maybe leading to accumulation of material in the inner disk that will eventually drive a new eruption (Sicilia-Aguilar et al. 2015). 

J1604: A tale of two disks

A dipper with a face-on disk

J1604 is a known "dipper" star, but scattered light images also revealed a face-on disk with a very large gap (~65 au) and two highly-variable shadows that suggested a highly inclined inner disk (Pinilla et al. 2018). Combined time-resolved photometry and archival spectroscopy revealed a quasi-periodic behavior in the inner disk, with the dips happening at the stellar rotation period of 5d but being rapidly variable as accretion routinely drains the inner disk within ~20 days time (Sicilia-Aguilar et al. 2020). Longer timescales reveal times of lack of accretion (weak Halpha emission lines) that coincide with the times at which there is no near-IR excess from the disk (Luhman & Mamajek 2012) and no eclipses show up in the archival Catalina data. This indicates a longer (up to 4 years) timescale for totally draining and replenishing the inner disk, which as in the case of GW Ori (Fang et al. 2014), it could be related to an undetected massive companion living close to the star within the large gap between the inner and the outer disk (Sicilia-Aguilar et al. 2020).

K2 lightcurve. The top panels show the lightcurve wrapped for a period of 5.02d, and a zoom at the stellar flux that reveals modulation induced by occultation by two structures (likely associated to the edge of the disk where the accretion columns are attached at corotation radius), one of which is clearly denser than the other. The plot below shows the total lightcurve, compared to the binned data shown in the upper right panel.

Sketch of the structure around J1604 inferred from the combination of time-resolved observations.

GW Ori: Using a binary to "probe" the disk and its wind

Mapping the inner disk wind in a star with a variable inner disk

GW Ori is a triple system surrounded by one of the most massive and extended disks observed (Fang et al. 2017). With a 4 Msun primary, a 0.5 Msun companion at 1au, and a low-mass star or BD companion at 8-10 au (Berger et al. 2011), it resembles an upscaled planetary system. Although it has shown IR variability since the 70's, with the inner disk suffering dramatic changes (see below), the accretion rate does not seem to vary significantly. Nevertheless, the wind-related absorption features show the same periodicity that the innermost companion, providing a direct measurement of the location of the disk wind (Fang et al. 2014). In some sense, the binary acts as a "probe" that disrupt the disk (and its wind) and can be traced with time- and velocity-resolved data.

Upper panel: Spectral energy distribution (SED) variability observed between 1971 and 2005, compared to several disk models generated by RADMC-2D. Lower panel: dust distribution for the above models, compared to the location of the B and C companions. Note how the disk evolves in timescales of tens of years, comparable to the period of C, and likely related to a "leaky" dust filter created by the third companion (Fang et al. 2014).

Modulation of the central velocity (top) and equivalent width (bottom) of the absorption component in the Halpha line, plotted over the orbital phases of GW Ori B. The consistency of the modulation with the orbital period of the companion betrays the location of the disk wind (Fang et al. 2014).

ASASSN-13db: Temperature structure around a M5 star

With a spectral type M5, ASASSN-13db is one of the lowest mass known to have EXor outbursts (Holoien et al. 2014). Its lightcurve has shown two eruptions since discovery, and reveals that the star turns bluer (with the emission dominated by a black-body component around 5800 K) during outburst, as expected in an increased accretion episode. The object shows a period of 4.15d during quiescence and outburst, likely associated to stable accretion structures around the star as in the case of EX Lupi (Sicilia-Aguilar et al. 2017). During outburst, this accretion structure would result in an extended, non-axisymmetric hot spot that induces the modulation as it rotates with the star. The modulation is still observed in quiescence, albeit at a lower level.

Non-spherical accretion and non-axisymmetric winds

Most of the emission lines show an inverse P-Cygni profile, characteristic of non-spherical accretion. Analysis of the maximum redshifted absorption velocity for different lines reveals an anticorrelation between maximum redshifted velocity and the strength and total excitation potential of the lines (see figure, rightmost panel). This suggests that the highest temperature is not reached on the stellar photosphere, but a bit higher, probably in a shock region hovering the stellar photosphere (Sicilia-Aguilar et al. 2017). This result is not too different from what has been observed for TW Hya (Dupree et al. 2012). The lines also reveal a non-axisymmetric wind appearing during the accretion burst.

Z CMa: Disk, winds, and accretion around a young B star

Z CMa is a binary star with a FUor companion (which appears to have returned to quiescence as of the late 90's) and a Herbig AeBe primary that suffers repeated accretion bursts. We used the emission and absorption features in outburst and quiescence to estimate the regions involved in the burst, their temperatures, and densities. Below we summarize what we can unveil from the line profiles and strength of the emission lines, as presented in Sicilia-Aguilar et al. subm.

The many emission line profiles in Z CMa

Hbeta line during outburst (blue) and quiescence (orange), showing a strong saturated wind absorption.

Fe II emission and absorption features in outburst (blue) and quiescence (orange). The outburst data shows a much stronger, multi-component wind that has a very strong day-to-day variability.

Fe I emission line in outburst (blue) and quiescence (orange). The line is narrow during quiescence, but becomes double-peaked in outburst, indicating an origin in the accretion disk.

Disk, wind, and accretion properties from the lines

We use the line profiles to determine the origin of the emission lines. Lines with similar profiles originate in the same structures and can be then used to constrain the properties of this structure. Using weak Fe I and Fe II lines with narrow and disky profiles and Saha's equation, we can estimate the temperature and density of the regions emitting these lines. The figure on the side shows the best fits in the temperature/electron density plane. The color scale indicates the differences between the model and the observed lines, with the best fit being marked by a star and the good fits appearing in blue, surrounded by a thin white line. Although there is substantial degeneracy in the process, the analysis suggests the emission lines moving towards more denser, hotter regions in quiescence (as it happens in EX Lupi; Sicilia-Aguilar et al. 2015).  We can then use lines from the same upper level and disk decomposition for the lines and observations of other species to reduce the degeneracy.

Deriving structure properties using lines from the same upper level

For lines that originate from the same upper level, the way the upper level is populated does not matter, and the line intensity ratio depends on the temperature and optical thickness or, in case of velocity-resolved lines, the Sobolev approximation can be used to write the result in terms of the temperature and the density-velocity gradient (Beristain et al. 1998). Repeating the exercise for several lines originating in different components around the star (e.g. using disk-like lines, or lines with signatures of wind), it is possible to constrain the temperature and density of these structures (see figure, Sicilia-Aguilar et al. subm).

Investigating the location of the disk emission around Z CMa

Brightness decomposition (Acke & van den Ancker 2006) can be used, together with a simple disk model, to reveal the location of the disk emission in double-peaked lines. This exercise reveals that lines are originated between 0.5-5 au, and that the strongest lines, arising from the disk upper layers, are more variable than the weak lines that are formed near the midplane. The temperatures over ~2000 K inferred from Saha's equation are also confirmed (Sicilia-Aguilar et al. subm).