This one minute video gives an overview of the STAR-MELT package features
The STAR-MELT (STellar AccRetion-Mapping with Emission Line Tomography) Python Package

- 1 University of Dundee
Abstract
Accretion is a fundamentally important process for pre-main-sequence stars, affecting disk stability and evolution, stellar rotation and activity, and planet formation and migration. The main observational challenge is probing the sub-au scales of the innermost disk, which is not yet possible via interferometry. Such young stars, however, possess a wealth of metallic emission lines that can reveal the nature of these accretion-related processes. The use of archival spectroscopic data to both achieve new science results, and to justify future observing proposals was a key aspect in developing our Python package STAR-MELT.
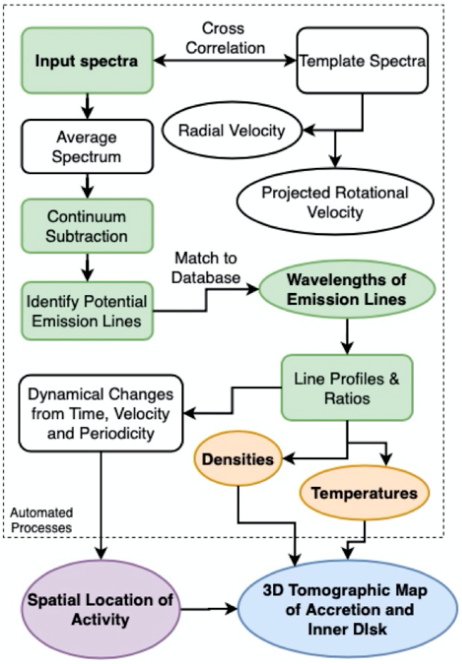
Our analysis involves emission line tomography of time-resolved, high-resolution spectra of young stars. This technique uses the time domain and variability to investigate distortions in the emission line profiles and radial velocity signatures. Local temperatures and densities can be determined for the various emission line species using Boltzmann & Saha statistics and the Sobolev large velocity gradient approximation. With both temporal and spatial information, we can then infer a tomographic map of the accretion structures, activity spots, and the innermost hot atomic gas; down to scales smaller than those achievable with direct imaging. By using STAR-MELT, our analysis allows for new results to be obtained from archival data, as well as facilitating timely analysis of new data as it is obtained. This will enable us to achieve a statistically-significant and complete sample of accretion processes in young stars across the range of stellar masses and disk types.
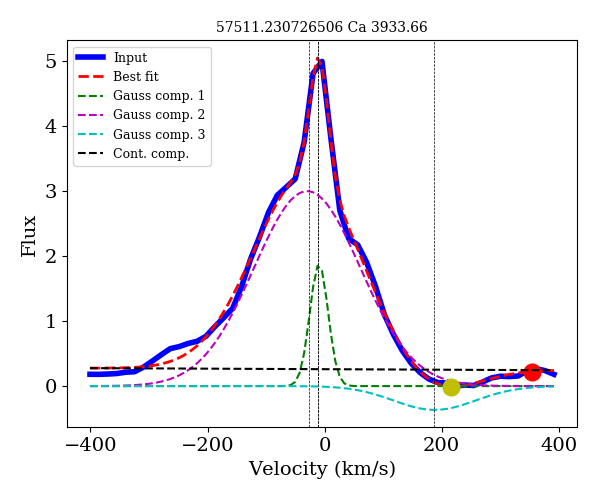
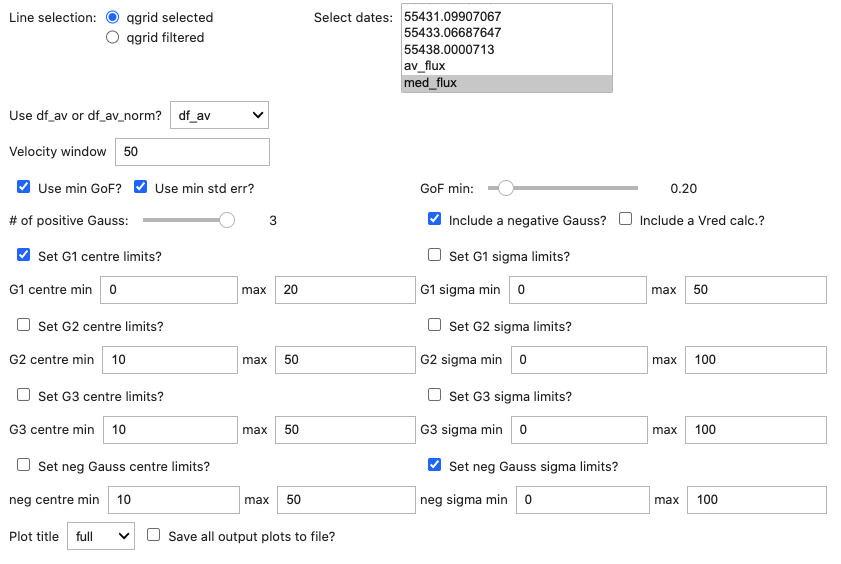
We will give a live demonstration of STAR-MELT using an interactive Jupyter notebook. Directly from the input data files, the emission lines are automatically extracted and identified, via matching to a compiled reference database of lines. Line profiles are fitted and quantified, allowing for calculations of physical properties across each individual observation. Temporal variations in lines can readily be displayed and quantified. We are also using STAR-MELT to analyse hyper-velocity impact flash spectra from simulated solar-system body collisions, and we foresee many further applications for all kinds of spectroscopy data. Standard data formats for spectra are automatically compatible, with user-defined custom formats also available. Any reference database (atomic or molecular) can be specified for line identification. We will be publicly releasing STAR-MELT in the near future and welcome feedback from the community.
Our analysis involves emission line tomography of time-resolved, high-resolution spectra of young stars. This technique uses the time domain and variability to investigate distortions in the emission line profiles and radial velocity signatures. Local temperatures and densities can be determined for the various emission line species using Boltzmann & Saha statistics and the Sobolev large velocity gradient approximation. With both temporal and spatial information, we can then infer a tomographic map of the accretion structures, activity spots, and the innermost hot atomic gas; down to scales smaller than those achievable with direct imaging. By using STAR-MELT, our analysis allows for new results to be obtained from archival data, as well as facilitating timely analysis of new data as it is obtained. This will enable us to achieve a statistically-significant and complete sample of accretion processes in young stars across the range of stellar masses and disk types.
We will give a live demonstration of STAR-MELT using an interactive Jupyter notebook. Directly from the input data files, the emission lines are automatically extracted and identified, via matching to a compiled reference database of lines. Line profiles are fitted and quantified, allowing for calculations of physical properties across each individual observation. Temporal variations in lines can readily be displayed and quantified. We are also using STAR-MELT to analyse hyper-velocity impact flash spectra from simulated solar-system body collisions, and we foresee many further applications for all kinds of spectroscopy data. Standard data formats for spectra are automatically compatible, with user-defined custom formats also available. Any reference database (atomic or molecular) can be specified for line identification. We will be publicly releasing STAR-MELT in the near future and welcome feedback from the community.